Copyright
©The Author(s) 2015.
World J Gastroenterol. Dec 7, 2015; 21(45): 12767-12777
Published online Dec 7, 2015. doi: 10.3748/wjg.v21.i45.12767
Published online Dec 7, 2015. doi: 10.3748/wjg.v21.i45.12767
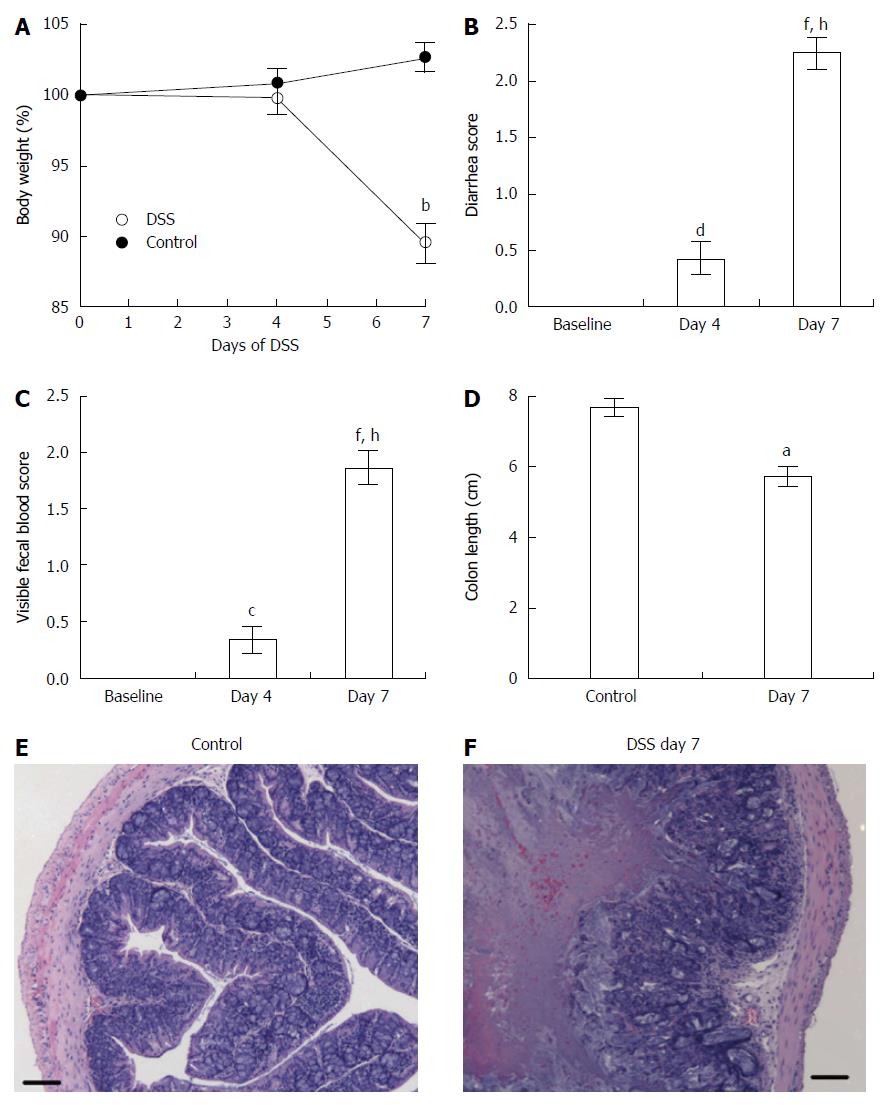
Figure 1 Clinical and inflammatory symptoms during dextran sulfate sodium-induced acute colitis assessed by changes in body weight (A), diarrhea score (B), visible fecal blood score (C), colon length (D), and histological sections of the colons in control mice (E) and mice that received dextran sulfate sodium for 7 d (F).
Control (n = 9) and dextran sulfate sodium (DSS)-treated (n = 21) mice. Data presented as mean ± SE. aP < 0.05, bP < 0.001 vs control. cP < 0.05, dP < 0.01, fP < 0.001 vs baseline. hP < 0.001 vs day 4. Scale bar = 100 μm.
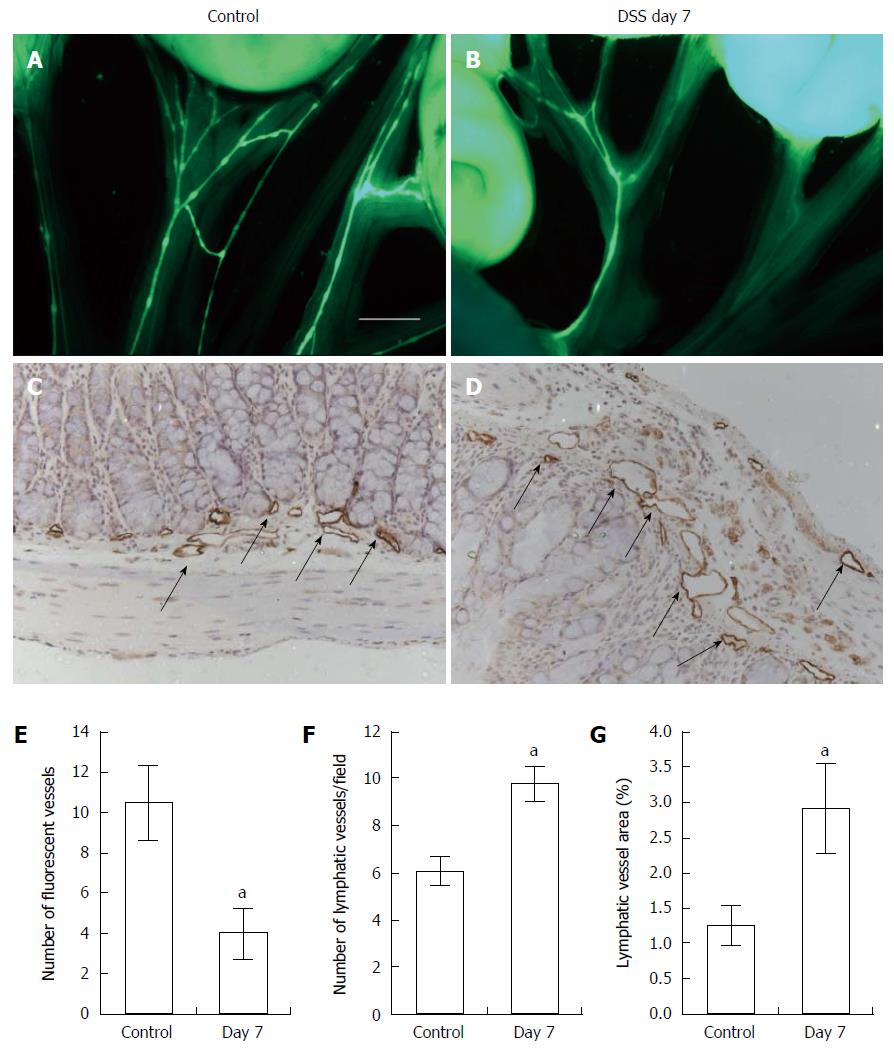
Figure 2 Intravital fluorescent lymphangiography 30 min after oral gavage administration of Bodipy-FL-C16.
Lymphangiography showing mesenteric lymphatic drainage in control (A, n = 4) and mice with dextran sulfate sodium (DSS)-induced colitis (B, n = 5) after oral gavage of 1 mL of Bodipy-FL-C16. Significantly reduced number of fluorescent mesenteric lymphatic vessels was observed in mice with DSS-induced colitis as compared to control mice (E). Scale bar = 2 mm. IHC assessment of lymphatic vessels using antibody against LYVE-1 in the colon of control (C) and mice with DSS-induced colitis (D) and quantification of number of lymphatic vessels (F) and vessel area (G) in colons. Data presented as mean ± SE. aP < 0.05 control vs DSS day 7.
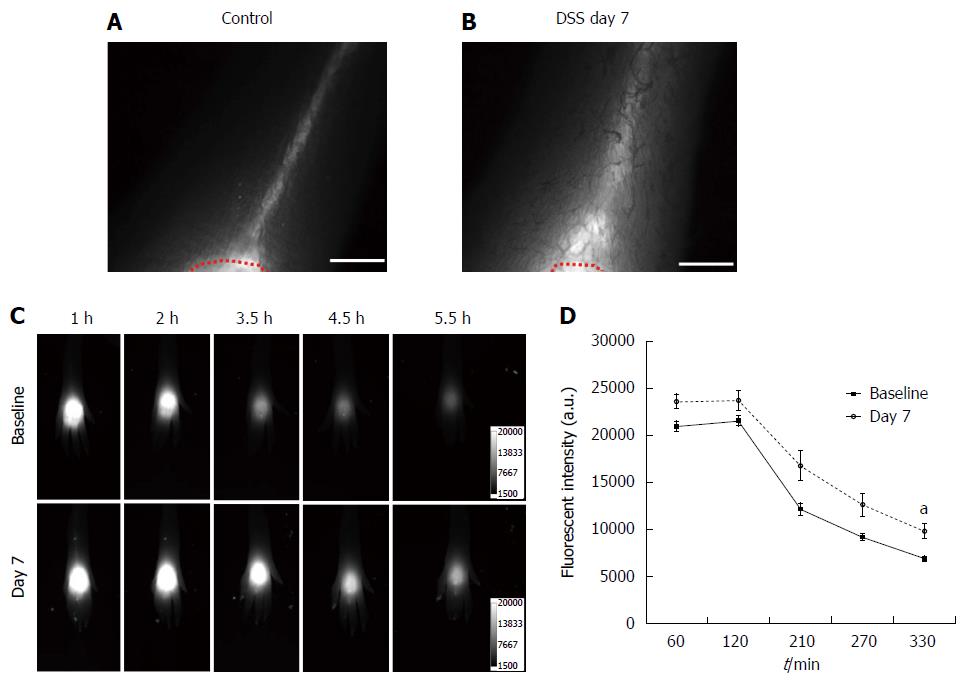
Figure 3 Near-infrared fluorescence imaging after id injection of indocyanine green in the dorsal aspect of the hind paw.
NIR fluorescent images of the foot in control mice (A) and mice treated with dextran sulfate sodium (DSS) for 7 d (B) after id injection of 2 μL of indocyanine green (ICG) in the dorsal aspect of the foot. A red dotted line delineates the ICG injection area. Representative fluorescent images in the foot of a mouse 1, 2, 3.5, 4.5, and 5.5 h after id injection of 2 μL of Alexa680-BSA prior to (baseline), and 7 d after DSS treatment displayed the clearance of Alexa680-BSA from the depot over time (C). Quantification of the fluorescent intensities (D) remaining in the depot of Alexa680-BSA in the skin of mice treated with DSS for 7 d (n = 7; grey open circle) showed higher fluorescent intensity over time as compared to baseline (filled black square), which was statistically significant at 5.5 h (P = 0.01) in comparison to control mice. aP < 0.05. Scale bar = 1 mm.
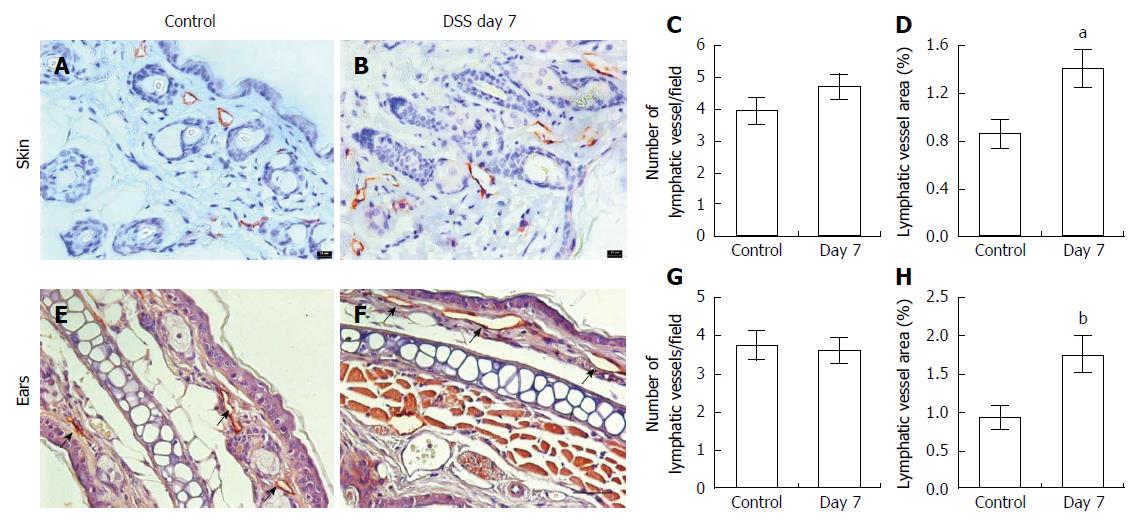
Figure 4 Immunohistochemical assessment of lymphatic vessels using antibodies to LYVE-1.
In the skin (A) and ears (E, arrows) of control (n = 5 skin; n = 7 ear) and mice with dextran sulfate sodium (DSS)-induced acute colitis (B, F; n = 6 skin; n = 9 ears). Computer-assisted image analysis showed no difference in the number of lymphatic vessels per field (C, G) but increased lymphatic vessel area in both skin and ears (D, H) compared to control mice. Data presented as mean ± SE. aP < 0.05, bP < 0.01 vs control. Scale bar = 100 μm (C, D).
Figure 5 Lymphatic contractile function in the skin of mice with dextran sulfate sodium-induced acute colitis.
Overlay of fluorescent and white light images showing lymphatic drainage of indocyanine green (ICG) from the foot, where ICG was injected (arrowhead), to the popliteal LN (broken arrow) via the popliteal afferent lymphatic vessel (A). The quantification of lymphatic contractility in the popliteal afferent (B) and efferent (C) lymphatic vessels in the foot of mice prior to 4, and 7 d after DSS alone (n = 21). Data represent mean ± SE. bP < 0.01, dP < 0.001 vs baseline; fP < 0.001 vs day 4.
- Citation: Agollah GD, Wu G, Peng HL, Kwon S. Dextran sulfate sodium-induced acute colitis impairs dermal lymphatic function in mice. World J Gastroenterol 2015; 21(45): 12767-12777
- URL: https://www.wjgnet.com/1007-9327/full/v21/i45/12767.htm
- DOI: https://dx.doi.org/10.3748/wjg.v21.i45.12767


