Copyright
©The Author(s) 2015.
World J Gastroenterol. Apr 28, 2015; 21(16): 4852-4863
Published online Apr 28, 2015. doi: 10.3748/wjg.v21.i16.4852
Published online Apr 28, 2015. doi: 10.3748/wjg.v21.i16.4852
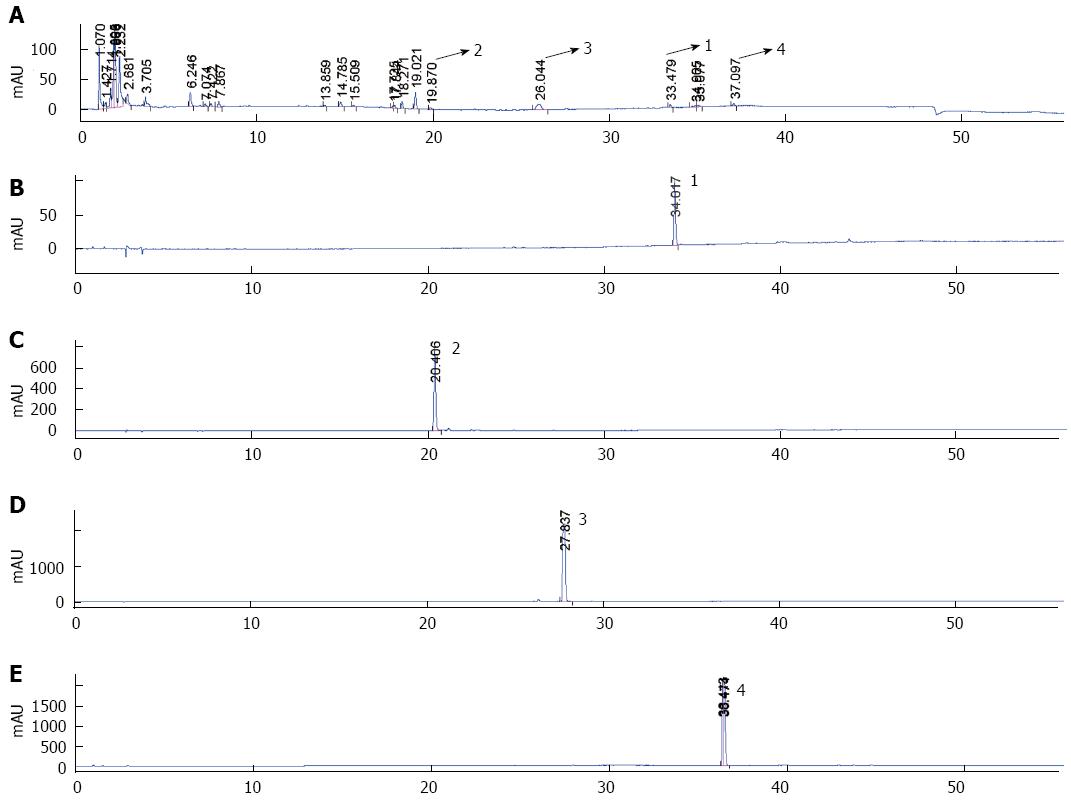
Figure 1 Analysis of the chemical constituents of Shugan decoction by high-performance liquid chromatography.
HPLC chromatogram of SGD and standard reference monitored at 210 nm; Peak 1: saikosaponin d; Peak 2: penoniflorin; Peak 3: poncirin; Peak 4: atractylenolide III. A: HPLC chromatogram of SGD; B: HPLC chromatogram of saikosaponin d; C: HPLC chromatogram of penoniflorin; D: HPLC chromatogram of poncirin; E: HPLC chromatogram of atractylenolide III. SGD: Shugan decoction; HPLC: High-performance liquid chromatography.
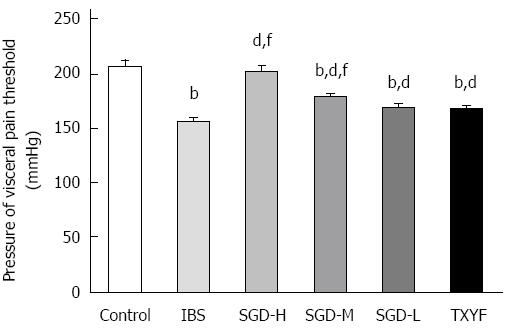
Figure 2 Abdominal withdrawal reflex pressure threshold measured in response to colorectal distension.
Data are presented as mean ± SD, bP < 0.01 vs control; dP < 0.01 vs irritable bowel syndrome; fP < 0.01 vs TongXieYaoFang. Statistical comparisons were performed using One-way ANOVA followed by Dunnett’s test using GraphPad Prism 5.0. (n = 9 or 10). IBS: Irritable bowel syndrome; SGD: Shugan decoction; TXYF: TongXieYaoFang.
Figure 3 Colon transit measured by fecal pellet output in 1 h.
A: Colon transit measured by fecal pellet output in 1 h on day 3; B: Colon transit measured by fecal pellet output in 1 h on day 10. Data are presented as mean ± SD, bP < 0.01 vs control; dP < 0.01 vs irritable bowel syndrome; eP < 0.05 vs TongXieYaoFang. Statistical comparisons were performed using One-way ANOVA followed by Dunnett’s test using GraphPad Prism 5.0. (n = 10). IBS: Irritable bowel syndrome; SGD: Shugan decoction; TXYF: TongXieYaoFang.
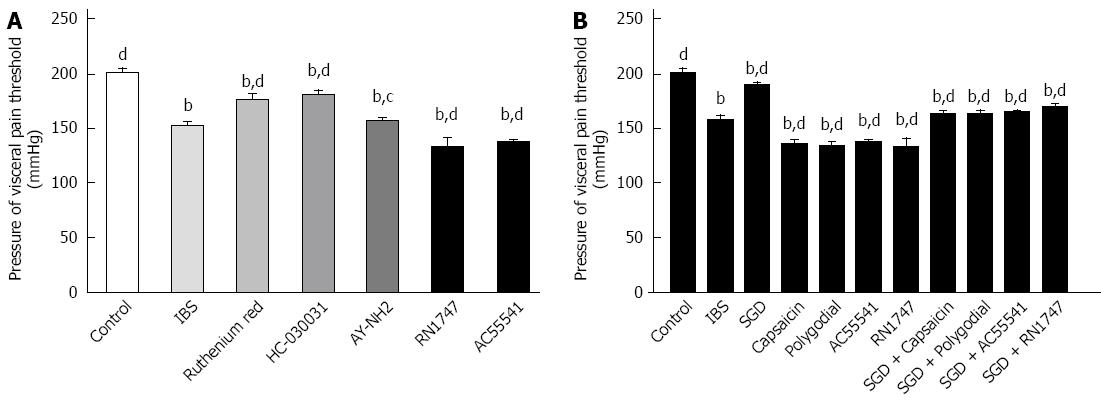
Figure 4 Transient receptor potential channels and protease-activated receptors involved in water avoidance stress-induced visceral hyperalgesia.
A: TRP channels and PARs involved in WAS-induced VHL; B: TRP channels and PARs involved in the effect of SGD on VHL. The blockers or activators of TRP channels and PARs were given by intraperitoneal injection after WAS on day 10. One hour later, rats were subjected to colorectal distension and AWR pressure threshold measurement. Ruthenium Red: blocker of TRPV1, 5 mg/kg; HC-030031: blocker of TRPA1, 5 mg/kg; AY-NH2: activator of PAR4, 1 mg/kg; RN1747: activator of TRPV4, 5 mg/kg; AC55541: activator of PAR2, 0.78 mg/kg; capsaicin: activator of TRPV1, 5 mg/kg; Polygodial: activator of TRPA1, 5 mg/kg. Ruthenium Red was dissolved in distilled water. Other blockers or activators were dissolved in 10% dimethylsulfoxide/5% Tween 80/ 85% saline. Data are presented as mean ± SD, bP < 0.01 vs control; cP < 0.05, dP < 0.01 vs IBS. Statistical comparisons were performed using One-way ANOVA followed by Dunnett’s test using GraphPad Prism 5.0. (n = 5-7). TRP: Transient receptor potential; PAR: protease-activated receptor; WAS: Water avoidance stress; VHL: Visceral hyperalgesia; IBS: Irritable bowel syndrome; SGD: Shugan decoction.
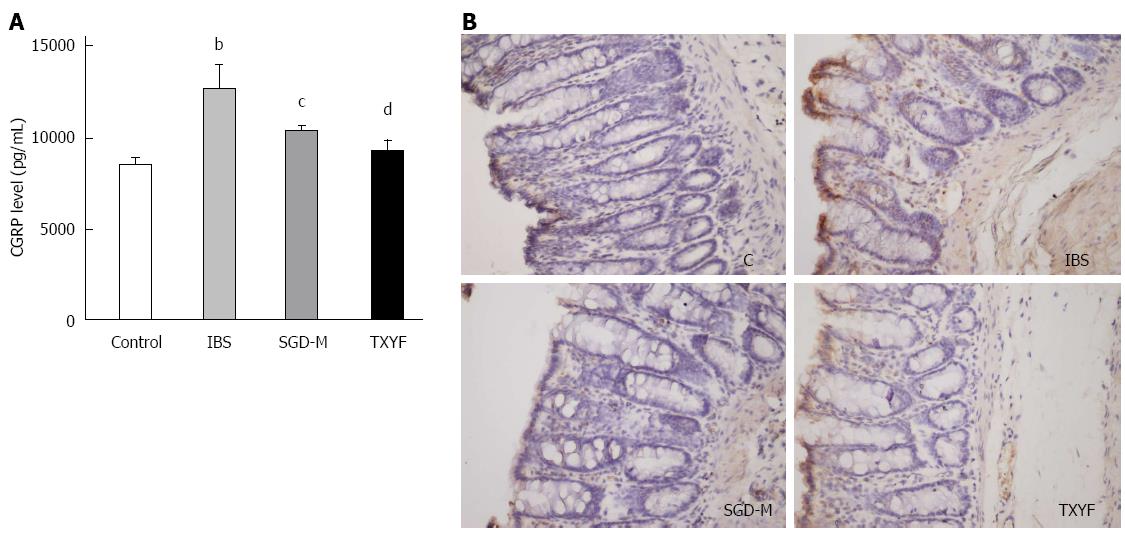
Figure 5 Calcitonin-gene-related peptide level in serum and colonic tissues.
A: CGRP level in serum measured by ELISA; B: CGRP expression in colonic tissues measured by immunochemistry. Data are presented as mean ± SD, bP < 0.01 vs control; cP < 0.05, dP < 0.01 vs IBS. Statistical comparisons were performed using One-way ANOVA followed by Dunnett’s test using GraphPad Prism 5.0. (n = 3 or 4). CGRP: Calcitonin-gene-related peptide; IBS: Irritable bowel syndrome; SGD: Shugan decoction; TXYF: TongXieYaoFang.
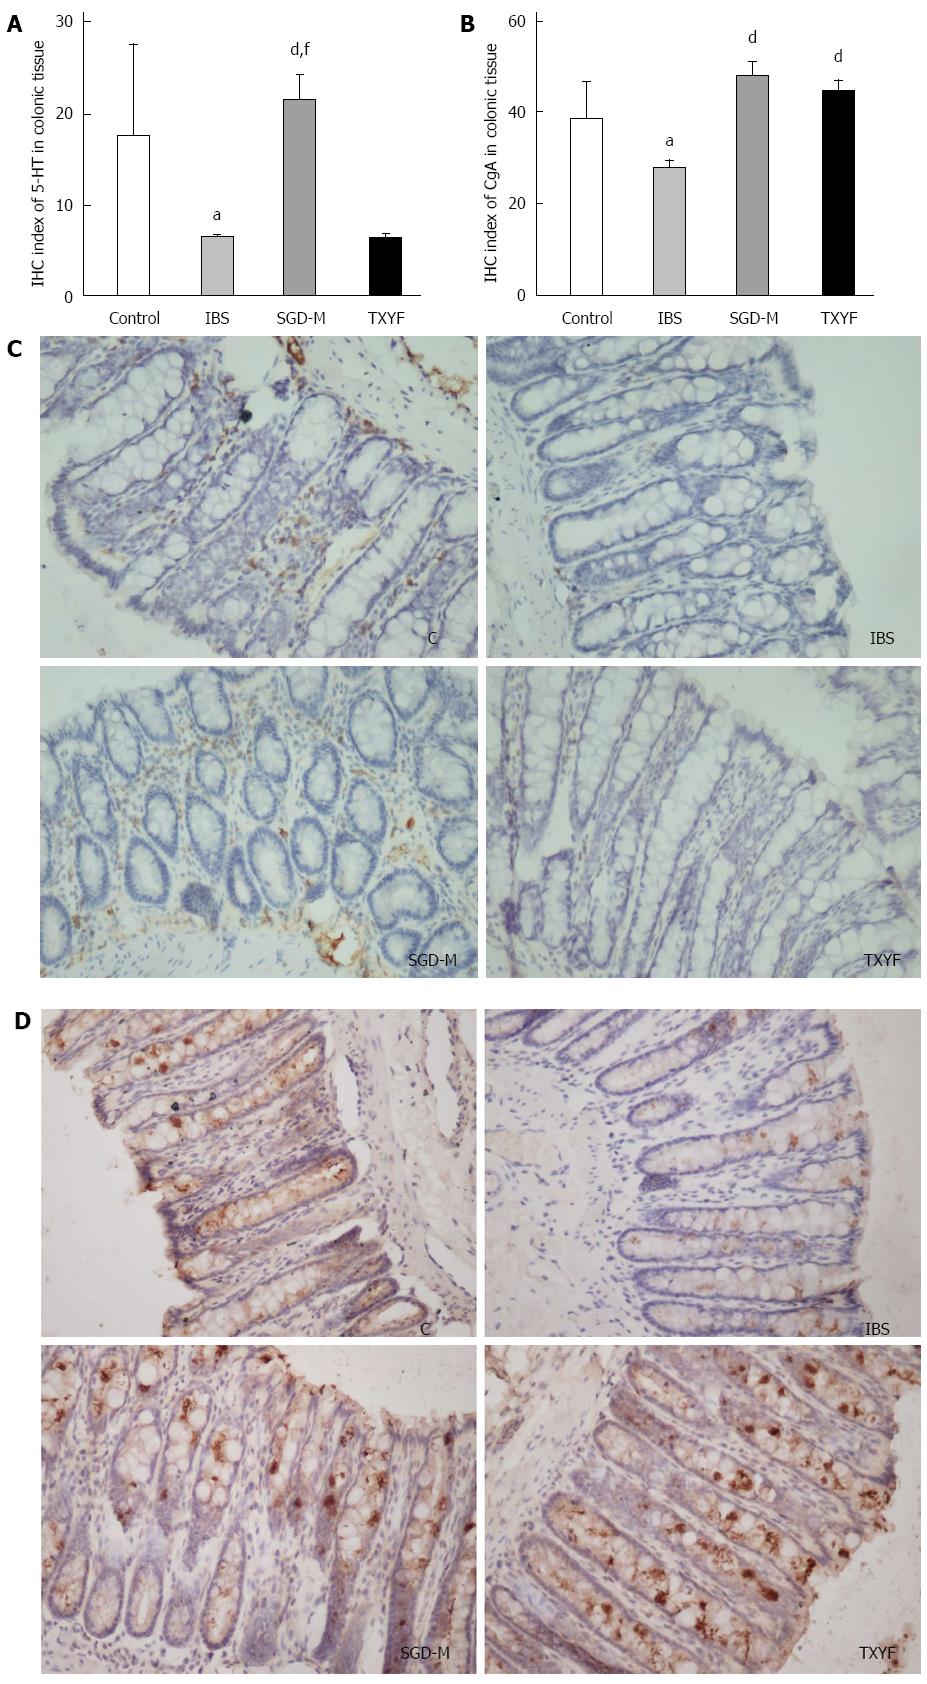
Figure 6 Endocrine cells in colonic tissues.
A, C: 5-HT levels in colonic tissues measured by IHC; B, D: CgA expression in colon tissues measured by immunohistochemistry. Data are presented as mean ± SD, aP < 0.05 vs control; dP < 0.01 vs IBS, Statistical comparisons were performed using One-way ANOVA followed by Dunnett’s test using GraphPad Prism 5.0.; fP < 0.01 vs TXYF, difference between SGD-M and TXYF was analyzed by Student’s t test using GraphPad Prism 5.0. (n = 3-5). 5-HT: 5-hydroxytryptamide; IHC: Immunohistochemistry; IBS: Irritable bowel syndrome; SGD: Shugan decoction; TXYF: TongXieYaoFang.
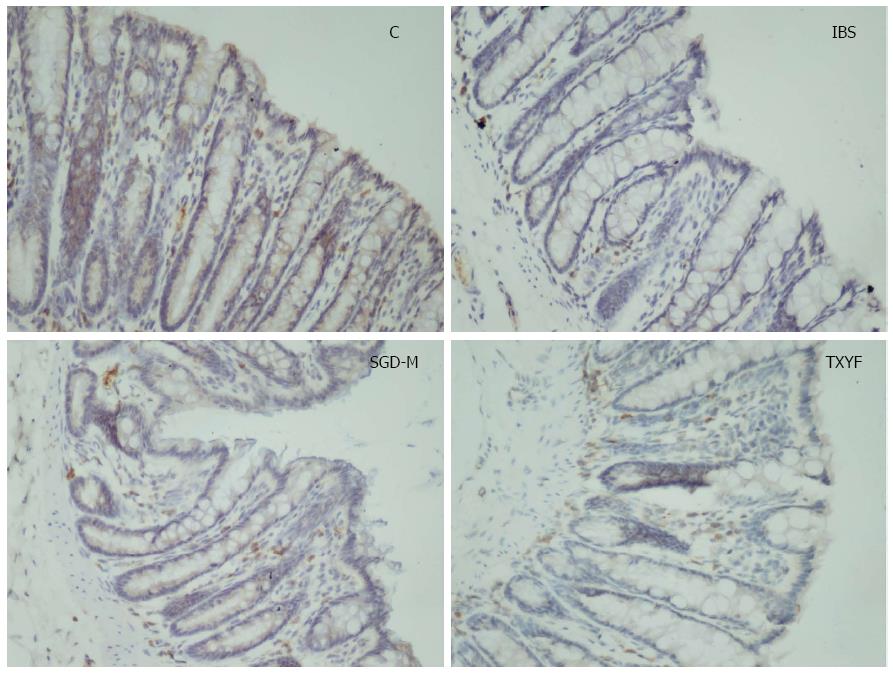
Figure 7 Serotonin transporter expression in colon tissue measured by immunochemistry.
IBS: Irritable bowel syndrome; SGD: Shugan decoction; TXYF: TongXieYaoFang.
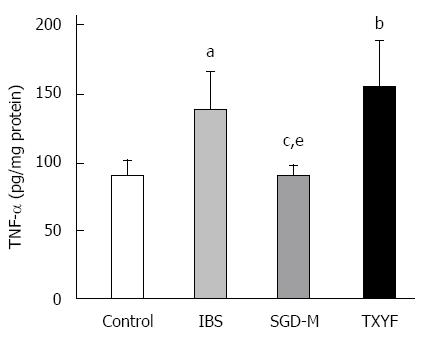
Figure 8 Tumor necrosis factor-α level in colonic tissue.
Data are presented as mean ± SD, aP < 0.05, bP < 0.01 vs control, Statistical comparisons were performed using One-way ANOVA followed by Dunnett’s test using GraphPad Prism 5.0.; cP < 0.05 vs IBS; eP < 0.05 vs TXYF, difference between SGD-M and TXYF was analyzed by the Student’s t test using GraphPad Prism 5.0. (n = 4). TNF: Tumor necrosis factor; SGD: Shugan decoction; IBS: Irritable bowel syndrome; TXYF: TongXieYaoFang.
- Citation: Shi HL, Liu CH, Ding LL, Zheng Y, Fei XY, Lu L, Zhou XM, Yuan JY, Xie JQ. Alterations in serotonin, transient receptor potential channels and protease-activated receptors in rats with irritable bowel syndrome attenuated by Shugan decoction. World J Gastroenterol 2015; 21(16): 4852-4863
- URL: https://www.wjgnet.com/1007-9327/full/v21/i16/4852.htm
- DOI: https://dx.doi.org/10.3748/wjg.v21.i16.4852


