Copyright
©The Author(s) 2015.
World J Gastroenterol. Apr 28, 2015; 21(16): 4852-4863
Published online Apr 28, 2015. doi: 10.3748/wjg.v21.i16.4852
Published online Apr 28, 2015. doi: 10.3748/wjg.v21.i16.4852
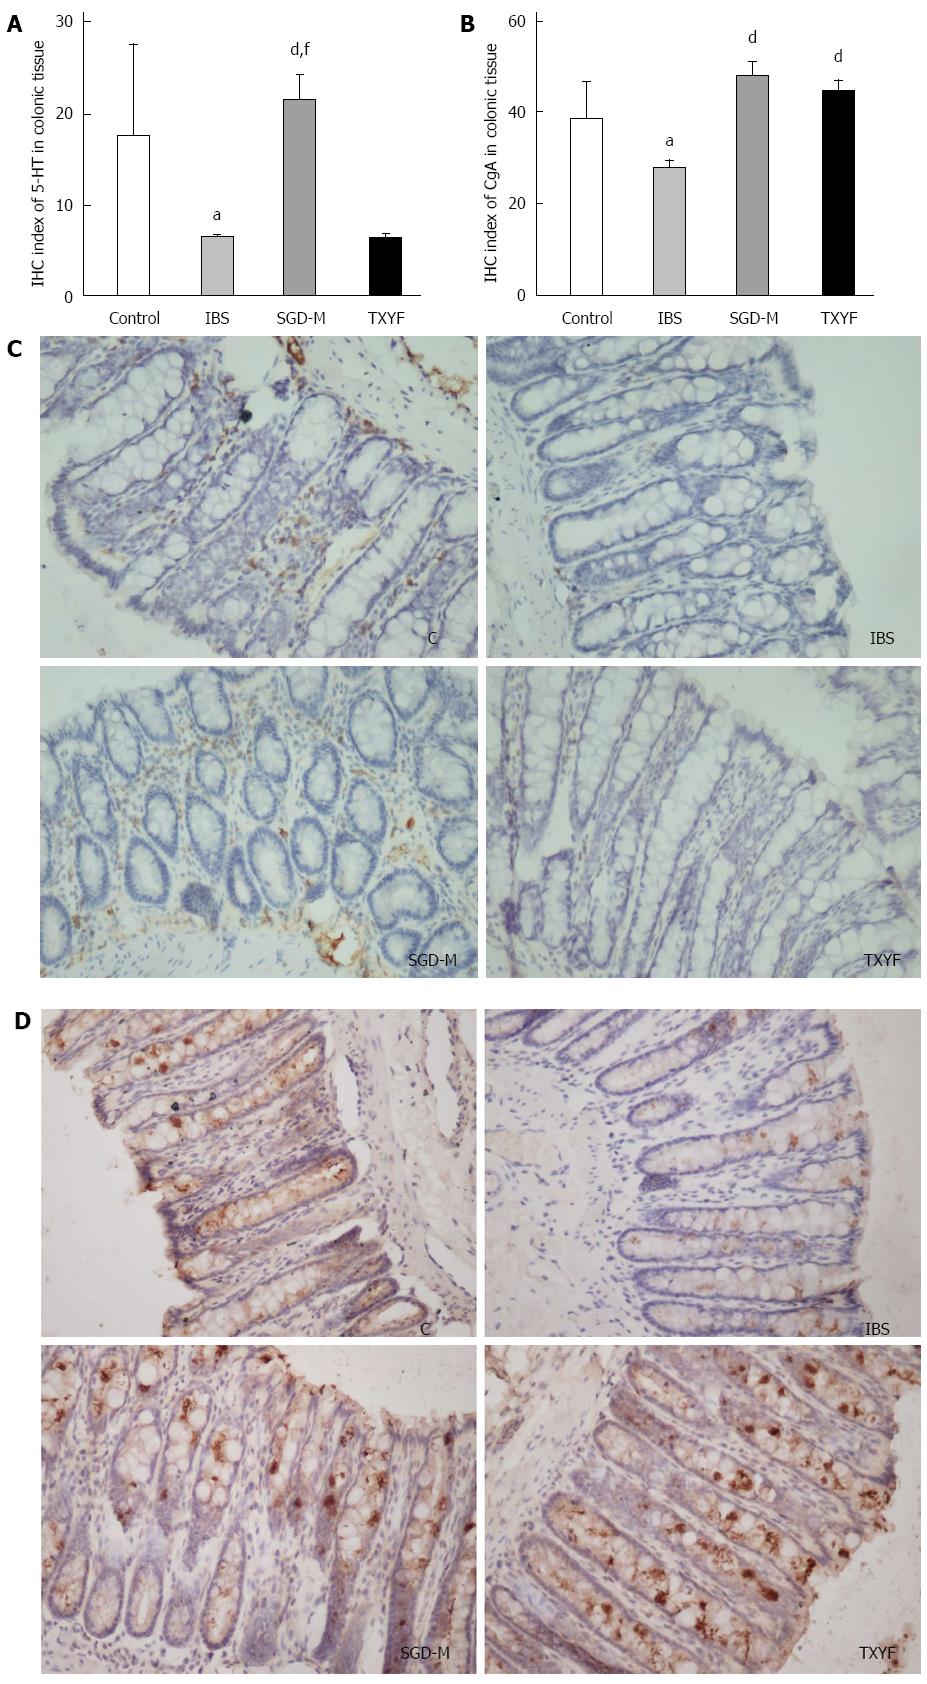
Figure 6 Endocrine cells in colonic tissues.
A, C: 5-HT levels in colonic tissues measured by IHC; B, D: CgA expression in colon tissues measured by immunohistochemistry. Data are presented as mean ± SD, aP < 0.05 vs control; dP < 0.01 vs IBS, Statistical comparisons were performed using One-way ANOVA followed by Dunnett’s test using GraphPad Prism 5.0.; fP < 0.01 vs TXYF, difference between SGD-M and TXYF was analyzed by Student’s t test using GraphPad Prism 5.0. (n = 3-5). 5-HT: 5-hydroxytryptamide; IHC: Immunohistochemistry; IBS: Irritable bowel syndrome; SGD: Shugan decoction; TXYF: TongXieYaoFang.
- Citation: Shi HL, Liu CH, Ding LL, Zheng Y, Fei XY, Lu L, Zhou XM, Yuan JY, Xie JQ. Alterations in serotonin, transient receptor potential channels and protease-activated receptors in rats with irritable bowel syndrome attenuated by Shugan decoction. World J Gastroenterol 2015; 21(16): 4852-4863
- URL: https://www.wjgnet.com/1007-9327/full/v21/i16/4852.htm
- DOI: https://dx.doi.org/10.3748/wjg.v21.i16.4852


