Copyright
©2014 Baishideng Publishing Group Inc.
World J Gastroenterol. Nov 7, 2014; 20(41): 15289-15298
Published online Nov 7, 2014. doi: 10.3748/wjg.v20.i41.15289
Published online Nov 7, 2014. doi: 10.3748/wjg.v20.i41.15289
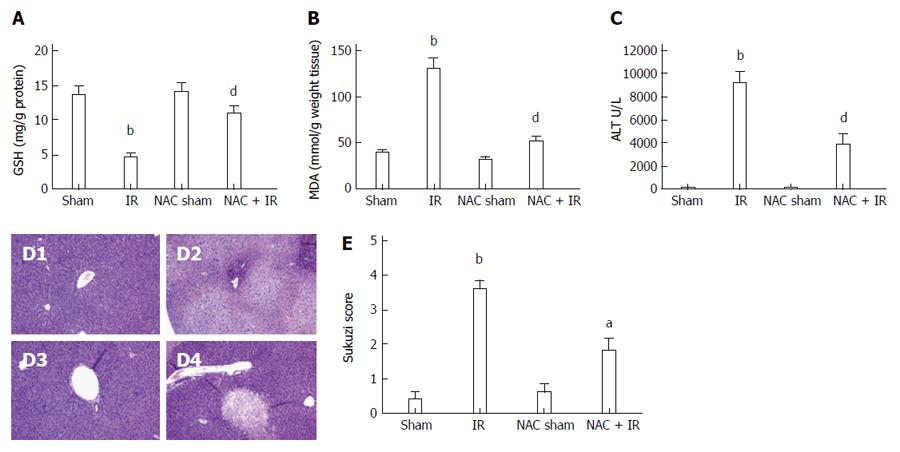
Figure 1 N-acetylcysteine treatment attenuates reactive oxygen species-induced liver injury after ischemia-reperfusion.
Mice were subjected to 90 min partial liver ischemia, followed by 6 h reperfusion. A and B: reactive oxygen species levels evaluated by glutathione (mg/g protein) and malondialdehyde (nmol/g tissue); mean ± SD, n = 3-5/group, bP < 0.01 vs sham group; dP < 0.01 vs IR group; C: hepatocellular function evaluated by alanine aminotransferase (U/L); mean ± SD, n = 3-5/group, bP < 0.01 vs sham group; dP < 0.01 vs IR group; D: histopathological analysis of livers harvested 6 h after reperfusion: D1: sham group: normal hepatic architecture; D2: IR group: severe hepatic lobule distortion, sinusoidal congestion, apparent edema, vacuolization and massive necrosis; D3: NAC sham group: normal hepatic architecture; D4: NAC + IR group: mild vacuolization, punctate necrosis and edema; E: severity of liver IRI by Suzuki’s histological grading; mean ± SD, n = 3-5/group, bP < 0.01 vs sham group; aP < 0.05 vs IR group. NAC: N-acetylcysteine; IR: Ischemia-reperfusion; ALT: Alanine aminotransferase.
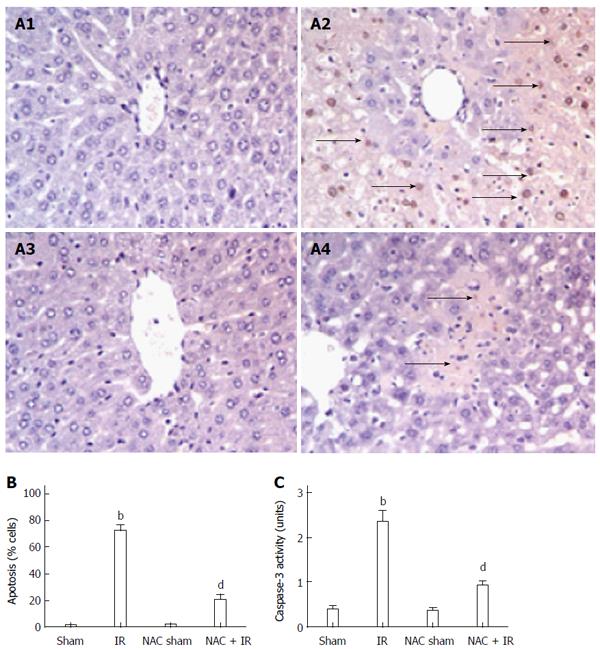
Figure 2 N-acetylcysteine treatment reduces hepatocellular apoptosis in liver after ischemia-reperfusion.
A: Liver apoptosis by transferase dUTP nick-end labeling staining: A1: Sham group; A2: IR group; A3: NAC sham group; A4: NAC + IR group; B: apoptotic cells were quantified in six high-power fields (× 400), and expressed as percentages of apoptotic cells among total cells; mean ± SD, n = 3-5/group, bP < 0.01 vs sham group; dP < 0.01 vs IR group; C: caspase-3 activity; mean ± SD, n = 3-5/group, bP < 0.01 vs sham group; dP < 0.001 vs IR group. NAC: N-acetylcysteine; IR: Ischemia-reperfusion.
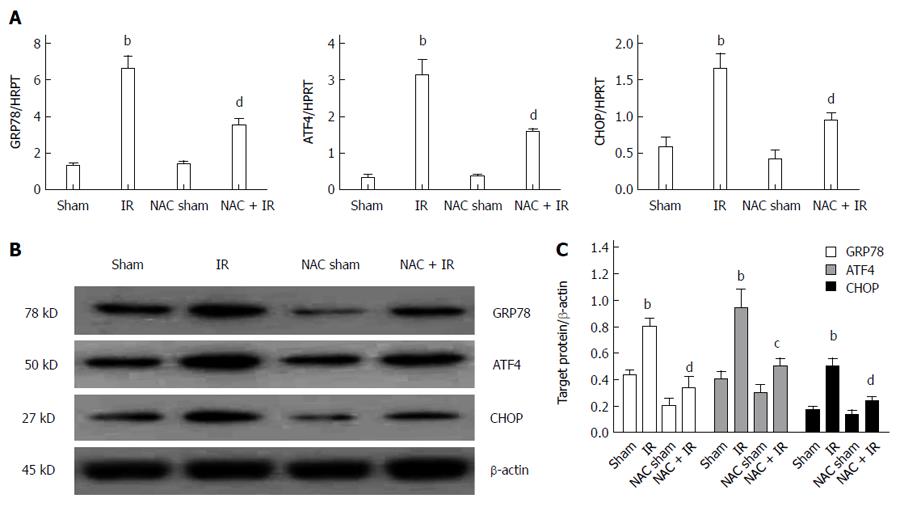
Figure 3 Reactive oxygen species-mediated endoplasmic reticulum stress is inhibited by N-acetylcysteine treatment in liver after ischemia-reperfusion.
A: Endoplasmic reticulum stress related gene (GRP78, ATF4 and CHOP) expressions in livers harvested 6 h after reperfusion, by quantitative real-time reverse transcriptase polymerase chain reaction analysis; mean ± SD, n = 3-5/group, bP < 0.01 vs sham group; dP < 0.01 vs IR group; B: western blot-assisted analysis of GRP78, ATF4, CHOP and β-actin; C: Relative quantities of protein of GRP78, ATF4 and CHOP, mean ± SD, n= 3-5/group, bP < 0.01 vs sham group; dP < 0.01, cP < 0.05 vs IR group; representative of three experiments. NAC: N-acetylcysteine; IR: Ischemia-reperfusion.
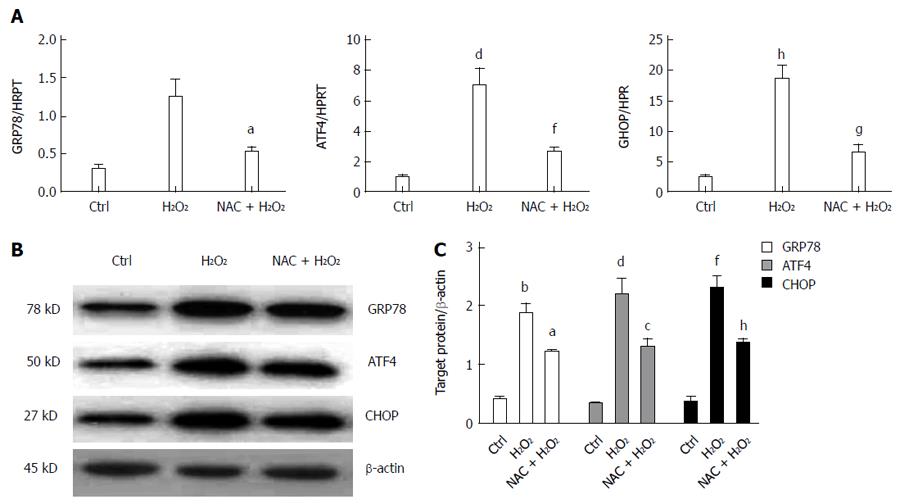
Figure 4 Reactive oxygen species-mediated endoplasmic reticulum stress is inhibited by N-acetylcysteine treatment in vitro.
A: Endoplasmic reticulum stress related gene (GRP78, ATF4 and CHOP) expressions in primary hepatocytes harvested 3 h after H2O2 treatment by quantitative real-time reverse transcriptase polymerase chain reaction analysis; mean ± SD, n = 3-5/group, bP < 0.01, dP < 0.01, hP < 0.01 vs Ctrl group; aP < 0.05, fP < 0.01, gP < 0.05 vs NAC + H2O2 group; B: western blot-assisted analysis of GRP78, ATF4, CHOP and β-actin; C: Relative quantities of protein of GRP78, ATF4 and CHOP, mean ± SD, n = 3-5/group, bP < 0.01, dP < 0.01, fP < 0.01 vs Ctrl group; aP < 0.05, cP < 0.05, hP < 0.01 vs NAC + H2O2 group; representative of three experiments. NAC: N-acetylcysteine; IR: Ischemia-reperfusion; Ctrl: Control.
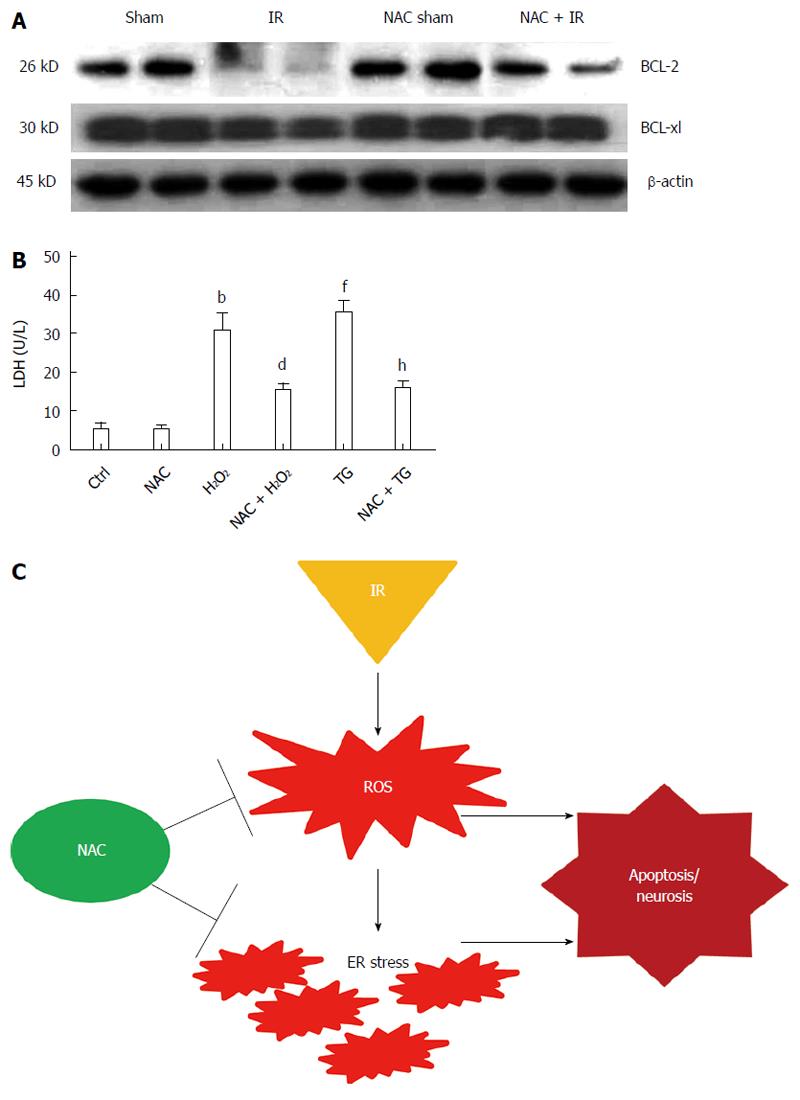
Figure 5 Reactive oxygen species or endoplasmic reticulum stress-induced hepatocyte death is inhibited by N-acetylcysteine treatment.
A: Western blot-assisted analysis of BCL-2, BCL-xl and β-actin; B: released lactate dehydrogenase level of primary hepatocytes after H2O2 (200 μmol) or TG (1 µmol) treatment; mean ± SD, n = 4/group, bP < 0.01 vs Ctrl group; dP < 0.01 vs H2O2 group; fP < 0.01 vs Ctrl group; hP < 0.01 vs TG group; C: schematic illustration of NAC works in IR-stressed liver. NAC: N-acetylcysteine; IR: Ischemia-reperfusion; Ctrl: Control; ROS: Reactive oxygen species.
- Citation: Sun Y, Pu LY, Lu L, Wang XH, Zhang F, Rao JH. N-acetylcysteine attenuates reactive-oxygen-species-mediated endoplasmic reticulum stress during liver ischemia-reperfusion injury. World J Gastroenterol 2014; 20(41): 15289-15298
- URL: https://www.wjgnet.com/1007-9327/full/v20/i41/15289.htm
- DOI: https://dx.doi.org/10.3748/wjg.v20.i41.15289


