Copyright
©2014 Baishideng Publishing Group Co.
World J Gastroenterol. May 14, 2014; 20(18): 5375-5388
Published online May 14, 2014. doi: 10.3748/wjg.v20.i18.5375
Published online May 14, 2014. doi: 10.3748/wjg.v20.i18.5375
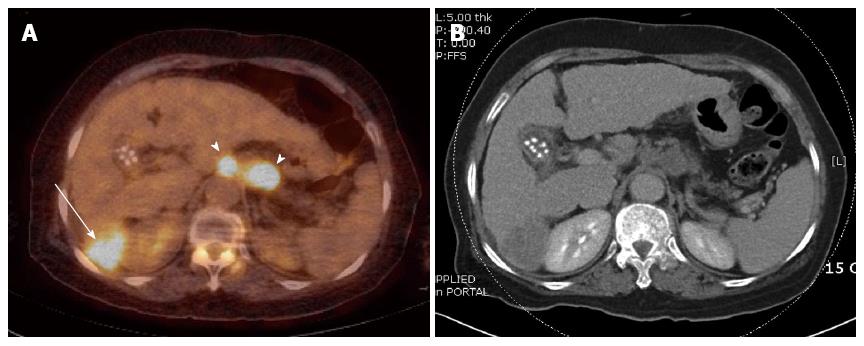
Figure 1 18F-fluorodeoxyglucose-positron emission tomography in hepatocellular carcinoma.
18F-fluorodeoxyglucose-positron emission tomography/computed tomography (CT) fusion (A) and CT (B) images show hot uptake in the primary lesion (arrow) in the right lobe of the liver and regional lymph node metastases (arrowhead).
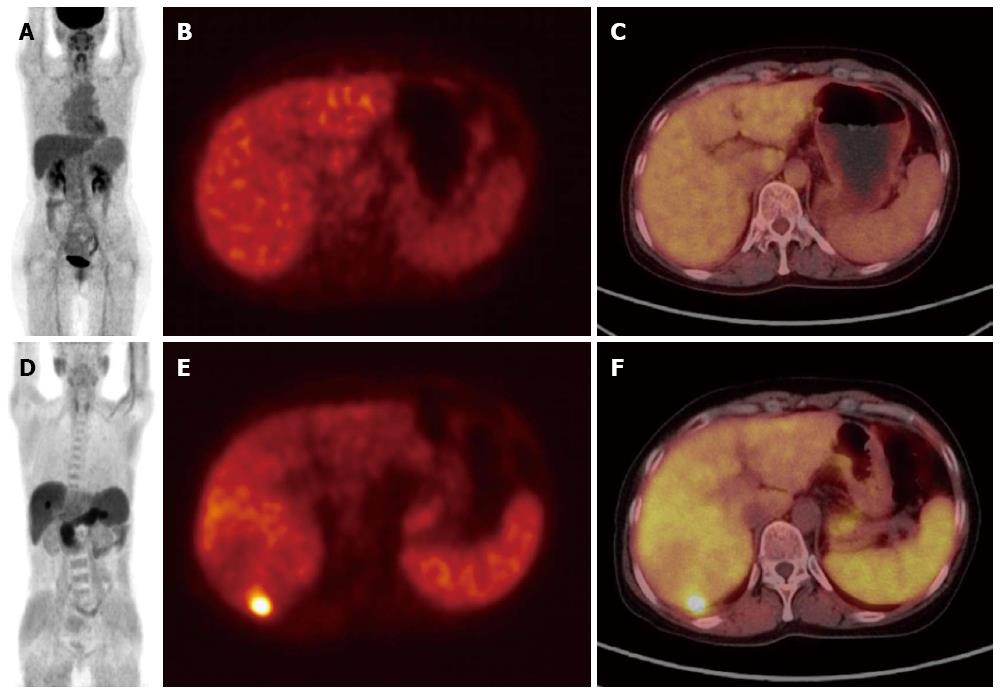
Figure 2 18F-fluorodeoxyglucose and 11C-acetate positron emission tomography in hepatocellular carcinoma.
In a patient with HCC, maximal intensity projection (A), PET (B), and PET/CT fusion (C) images of 18F-fluorodeoxyglucose-PET does not show a lesion of hot uptake. However, the same image set of 11C-acetate PET (D-F) shows hot uptake in the S7 segment of the liver. PET: Positron emission tomography; HCC: Hepatocellular carcinoma; CT: Computed tomography.
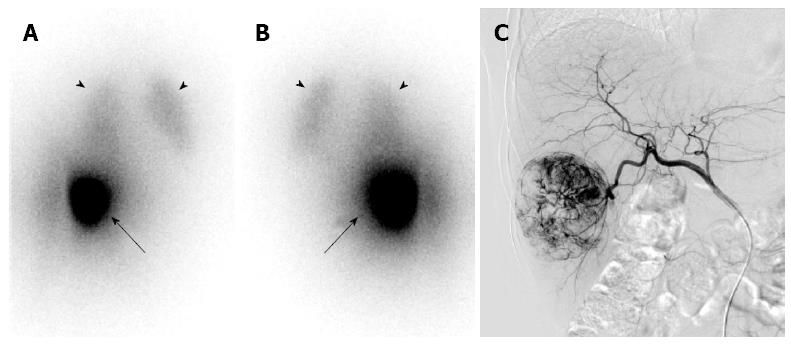
Figure 3 A Bremsstrahlung scan of 90Y-microsphere transarterial radioembolization.
Anterior (A) and posterior (B) planar scan images show hot uptake (arrows) in the right lobe of the liver, which is well correlated with findings on angiography (C), in spite of relatively poor image quality with blurring. Some liver-to-lung shunt activities are shown in the lungs (arrowheads).
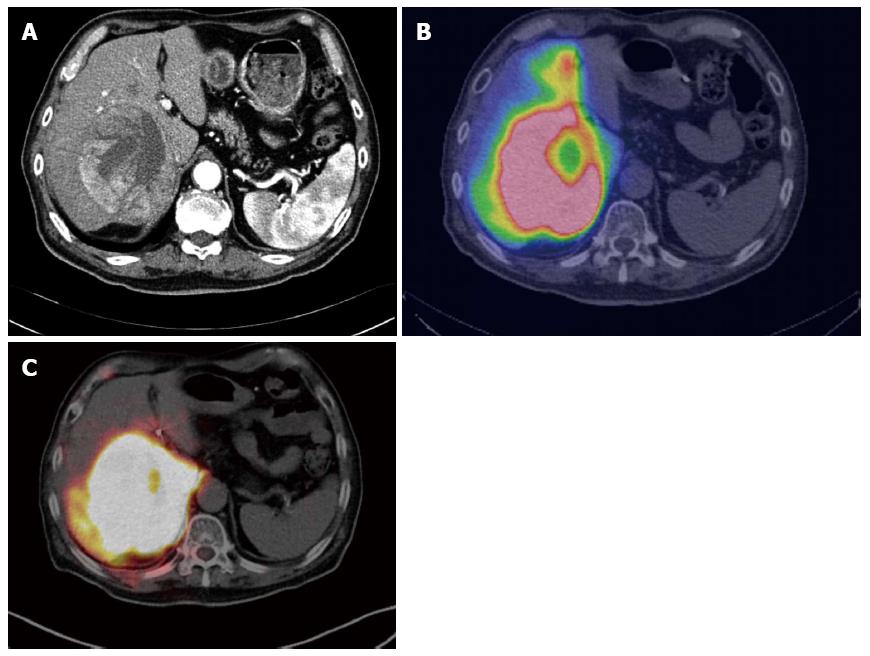
Figure 4 Pretreatment planning and post-treatment evaluation using single photon emission computed tomography and positron emission tomography.
In a patient with a large hypervascular tumor in the right lobe of the liver (A; contrast-enhanced CT), pretreatment SPECT/CT using 99mTc-labeled macroaggregated albumin shows well-localized accumulation of the radiotracer (B). After treatment evaluation using 90Y-microsphere, 90Y PET/CT image shows a similar uptake pattern in the liver (C). SPECT: Single photon emission computed tomography; CT: Computed tomography; PET: Positron emission tomography.
- Citation: Eo JS, Paeng JC, Lee DS. Nuclear imaging for functional evaluation and theragnosis in liver malignancy and transplantation. World J Gastroenterol 2014; 20(18): 5375-5388
- URL: https://www.wjgnet.com/1007-9327/full/v20/i18/5375.htm
- DOI: https://dx.doi.org/10.3748/wjg.v20.i18.5375


