Copyright
©2014 Baishideng Publishing Group Co.
World J Gastroenterol. May 14, 2014; 20(18): 5375-5388
Published online May 14, 2014. doi: 10.3748/wjg.v20.i18.5375
Published online May 14, 2014. doi: 10.3748/wjg.v20.i18.5375
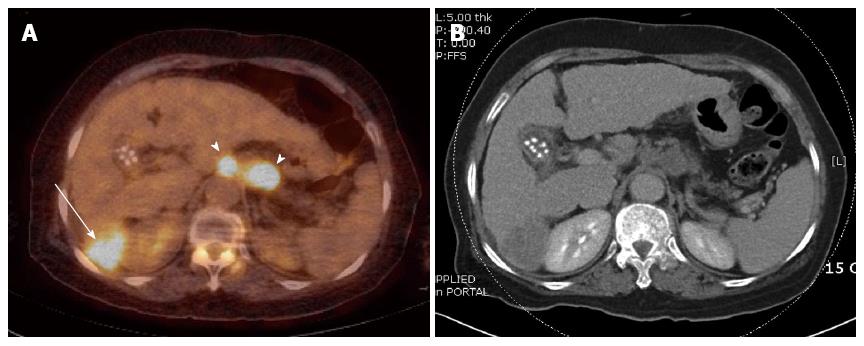
Figure 1 18F-fluorodeoxyglucose-positron emission tomography in hepatocellular carcinoma.
18F-fluorodeoxyglucose-positron emission tomography/computed tomography (CT) fusion (A) and CT (B) images show hot uptake in the primary lesion (arrow) in the right lobe of the liver and regional lymph node metastases (arrowhead).
- Citation: Eo JS, Paeng JC, Lee DS. Nuclear imaging for functional evaluation and theragnosis in liver malignancy and transplantation. World J Gastroenterol 2014; 20(18): 5375-5388
- URL: https://www.wjgnet.com/1007-9327/full/v20/i18/5375.htm
- DOI: https://dx.doi.org/10.3748/wjg.v20.i18.5375


