Copyright
©2014 Baishideng Publishing Group Co.
World J Gastroenterol. May 14, 2014; 20(18): 5375-5388
Published online May 14, 2014. doi: 10.3748/wjg.v20.i18.5375
Published online May 14, 2014. doi: 10.3748/wjg.v20.i18.5375
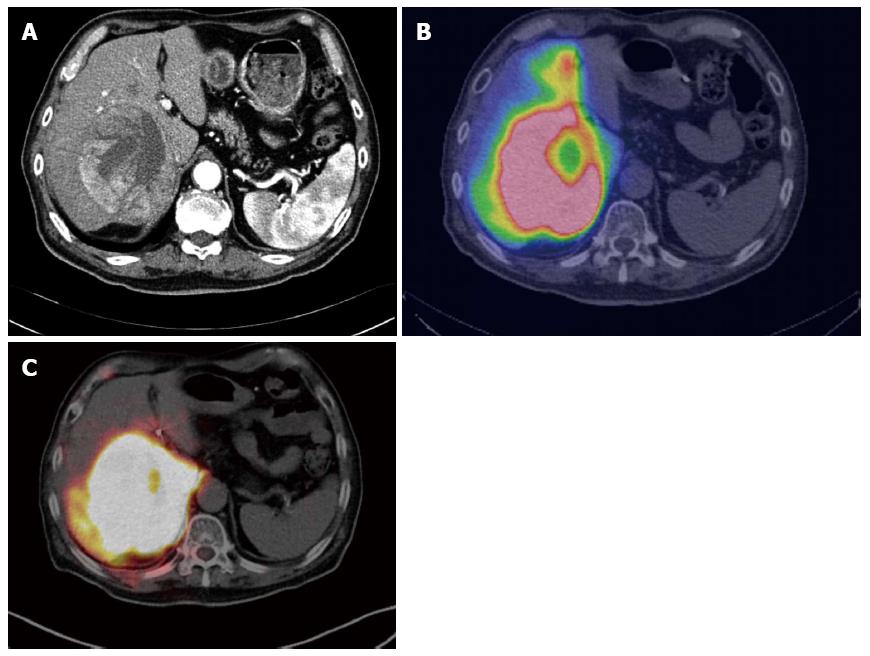
Figure 4 Pretreatment planning and post-treatment evaluation using single photon emission computed tomography and positron emission tomography.
In a patient with a large hypervascular tumor in the right lobe of the liver (A; contrast-enhanced CT), pretreatment SPECT/CT using 99mTc-labeled macroaggregated albumin shows well-localized accumulation of the radiotracer (B). After treatment evaluation using 90Y-microsphere, 90Y PET/CT image shows a similar uptake pattern in the liver (C). SPECT: Single photon emission computed tomography; CT: Computed tomography; PET: Positron emission tomography.
- Citation: Eo JS, Paeng JC, Lee DS. Nuclear imaging for functional evaluation and theragnosis in liver malignancy and transplantation. World J Gastroenterol 2014; 20(18): 5375-5388
- URL: https://www.wjgnet.com/1007-9327/full/v20/i18/5375.htm
- DOI: https://dx.doi.org/10.3748/wjg.v20.i18.5375


