Copyright
©2012 Baishideng Publishing Group Co.
World J Gastroenterol. Jun 28, 2012; 18(24): 3070-3080
Published online Jun 28, 2012. doi: 10.3748/wjg.v18.i24.3070
Published online Jun 28, 2012. doi: 10.3748/wjg.v18.i24.3070
Figure 1 Expression of chloride intracellular channel 1 in human gastric cancer cell lines SGC-7901 and MGC-803.
Specific reverse transcription polymerase chain reaction analysis for chloride intracellular channel 1 (CLIC1).Glyceraldehyde-3-phosphate dehydrogenase (GAPDH) was used as loading control.
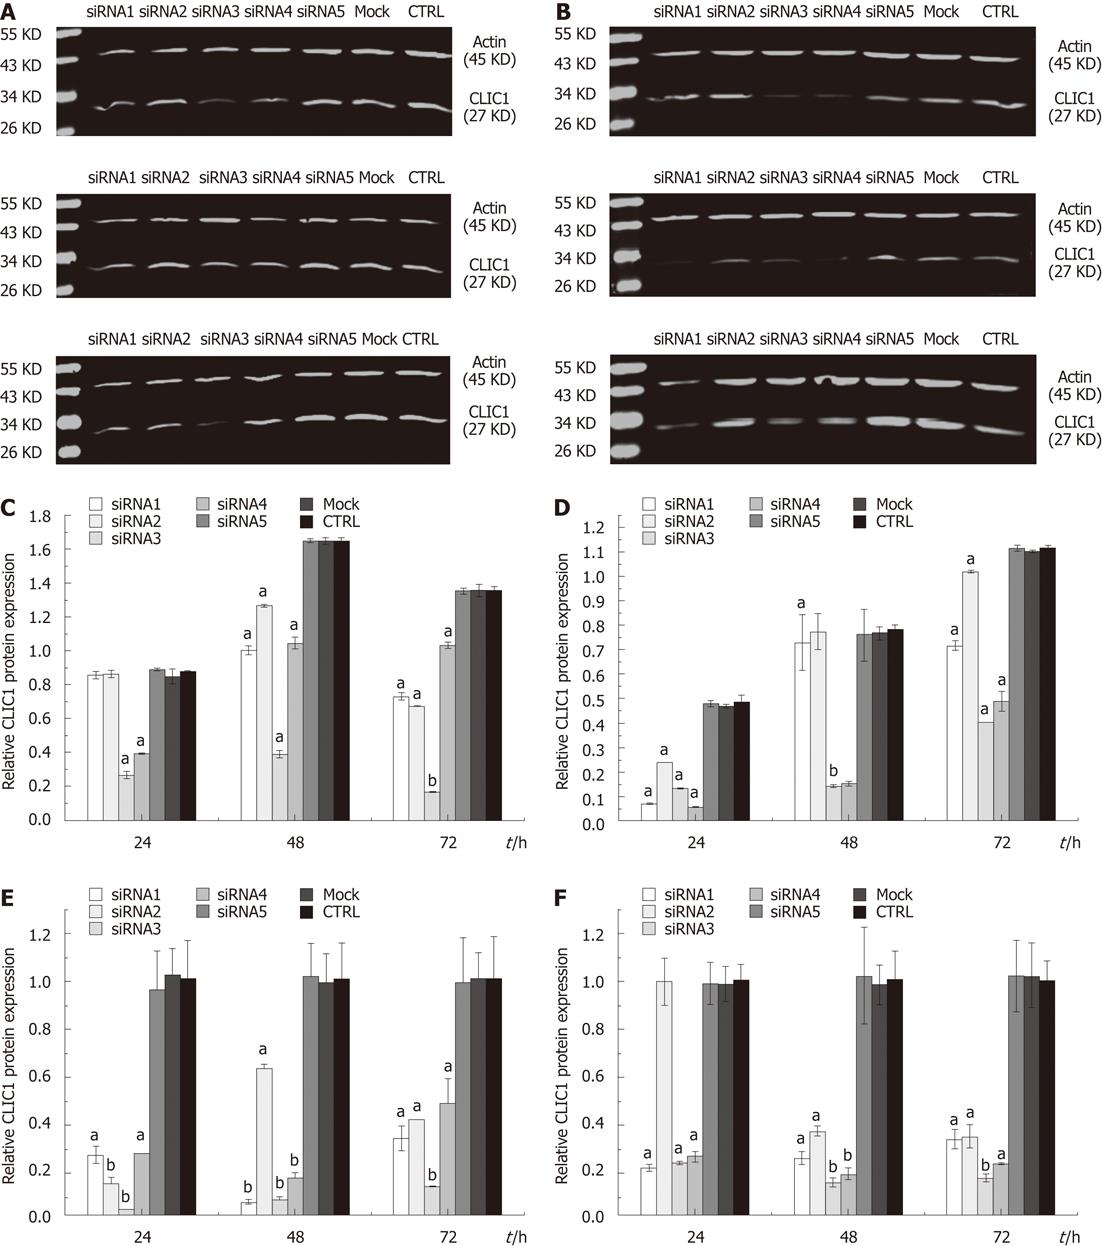
Figure 2 Effect of chloride intracellular channel 1 knockdown in SGC-7901 and MGC-803 cells.
Chloride intracellular channel 1 (CLIC1) protein expression was detected by Western blotting using a rat polyclonal CLIC1 antibody (1:500). β-actin was used as loading control. CLIC1 mRNA expression was detected by quantitative real-time polymerase chain reaction. β-actin was used as loading control. The figure represents one of the three experiments performed independently with similar results. A: CLIC1 protein expression in SGC-7901 by Western blotting; B: CLIC1 protein expression in MGC-803 by Western blotting; C: Relative CLIC1 protein expression level in SGC-7901; D: Relative CLIC1 protein expression level in MGC-803; E: Relative CLIC1 mRNA expression level in SGC-7901; F: Relative CLIC1 mRNA expression level in MGC-803. The experiment was done in triplicate and the value obtained from the control (CTRL) group set as 100%. aP < 0.05, bP < 0.01 vs CTRL and mock.
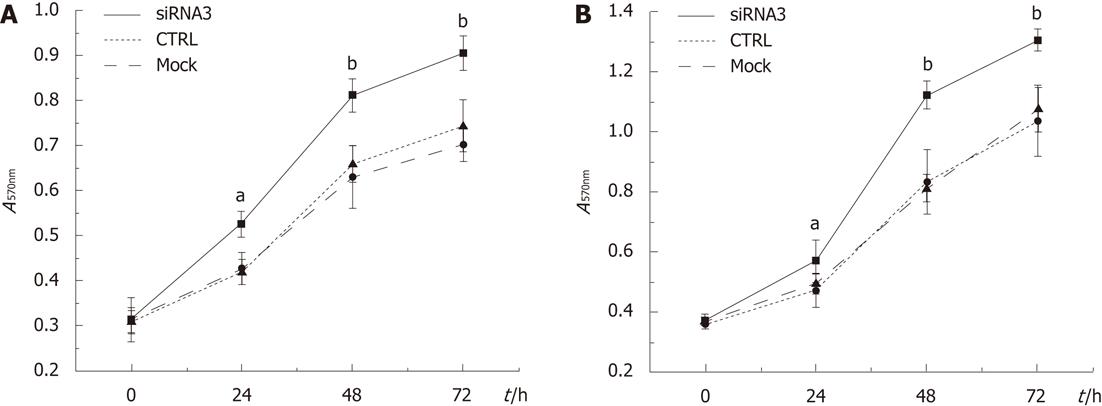
Figure 3 Effects of chloride intracellular channel 1 knockdown on cell growth in gastric cancer cell lines.
Basal growth was determined in complete medium by the methyl thiazolyl tetrazolium assay after 0, 24, 48 and 72 h. A: Data obtained from SGC-7901 cells; B: Data obtained from MGC-803 cells. Results were shown as mean absorbance of the respective SGC7901 and MGC-803 cell lines. The experiment was done in triplicate. aP < 0.05, bP < 0.05 vs control (CTRL) and mock.
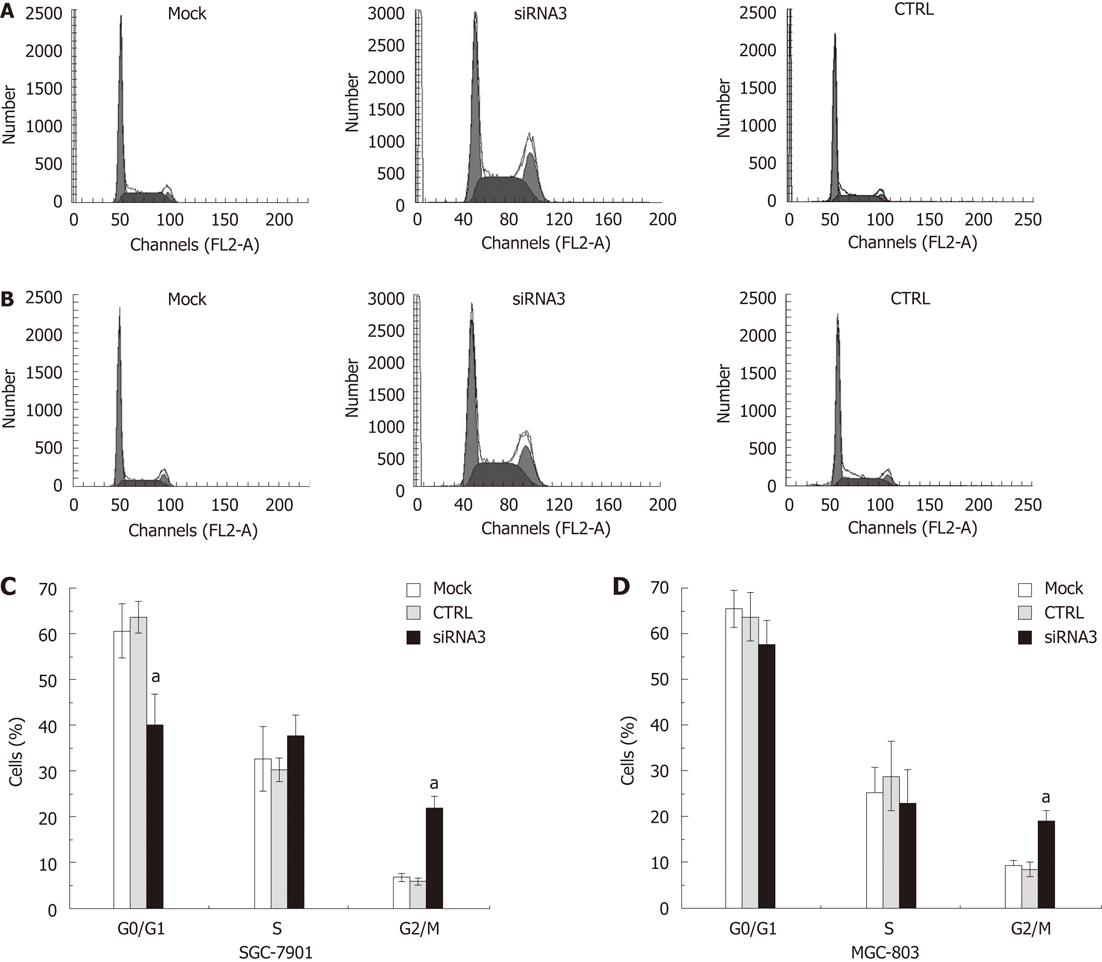
Figure 4 Measurement of the cell-cycle distribution by flow cytometry.
Downregulation of chloride intracellular channel 1 (CLIC1) expression by small interference RNA (siRNA) 3 transfection changed cell cycle distribution in SGC-7901 and MGC-803 cells. At 48 h post-transfection, the cell cycle distribution of these cells was analyzed using propidium iodide staining on flow cytometry. The experiment was done in triplicate. The figure represented one of the 3 experiments performed in duplicate. A: The figure was obtained from SGC-7901 cells; B: The figure was obtained from MGC-803; C: The data was obtained from SGC-7901 cells; D: The data was obtained from MGC-803 cells. aP < 0.05 vs control (CTRL) and mock.
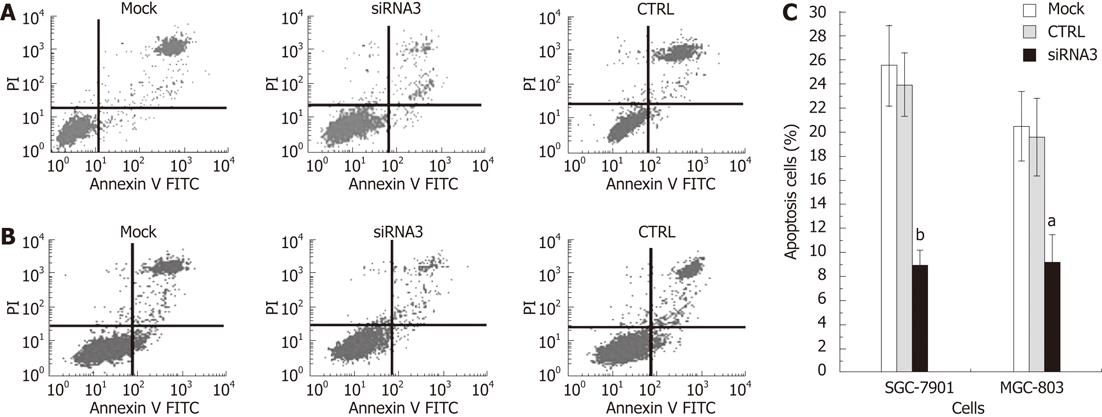
Figure 5 Chloride intracellular channel 1 knockdown reduces apoptosis in gastric cancer cell lines.
Apoptosis detection by flow cytometry. For each sample, 10 000 cells were counted, and the apoptotic cells were summarized in the right panel. A: Figure was obtained from SGC-7901 cells; B: Figure was obtained from MGC-803 cells; C: The apoptotic rate of the chloride intracellular channel 1 (CLIC1) specific small interference RNA (siRNA) 3 group obviously decreased in both SGC-7901 cells (62.24%, P = 0.000) and MGC-803 cells (52.67%, P = 0.000), compared with the control (CTRL) group; while there were no significant difference of cell apoptosis rate between the negative control group cells and the mock group cells. The experiment was done in triplicate. The figure represented one of the 3 experiments performed in duplicate. aP < 0.05, bP < 0.05 vs CTRL and mock.
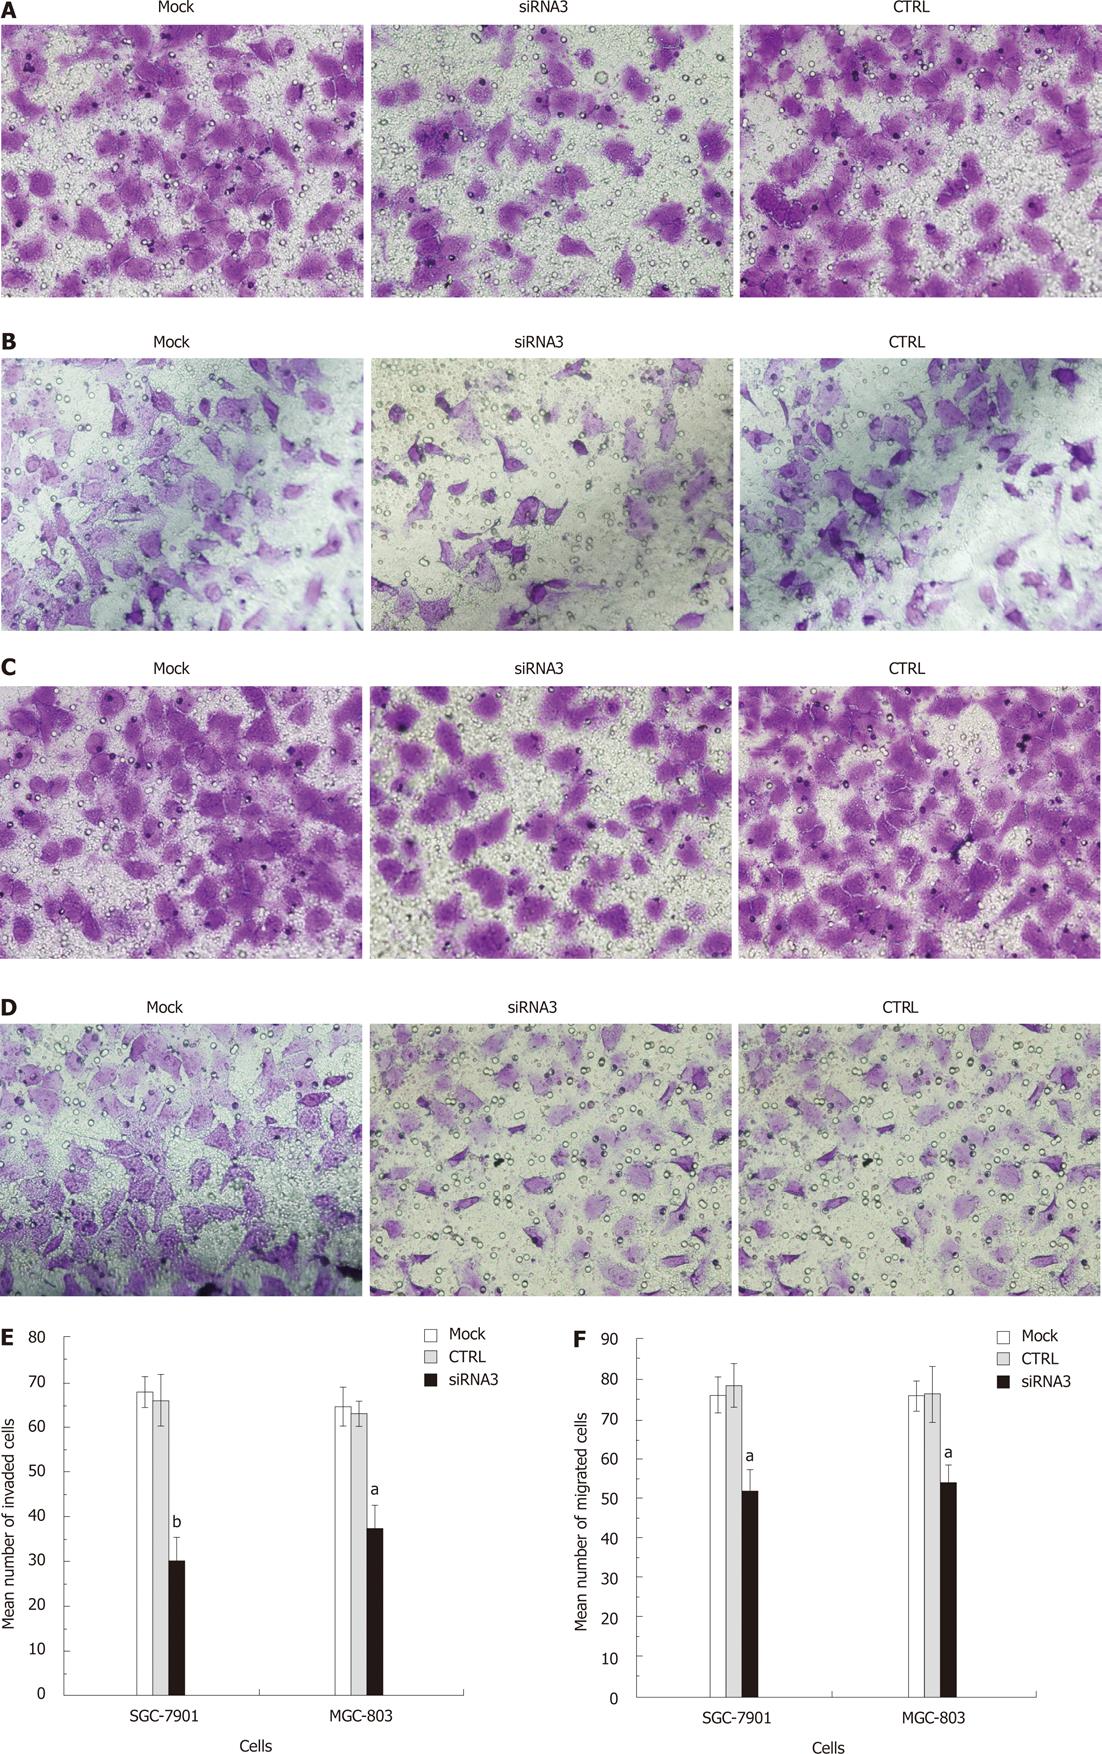
Figure 6 Effects of chloride intracellular channel 1 knockdown on cell migration and invasion in SGC-7901 and MGC-803 cell lines at 48 h.
A: The figure was obtained from the invasion assay of SGC-7901 cells; B: The figure was obtained from the invasion assay of MGC-803 cell; C: The figure was obtained from the migration assay of SGC-7901 cells; D: The figure was obtained from the invasion assay of MGC-803 cell; E: The data was obtained from the invasion assay; F: The data was obtained from the migration assay. The experiment was done in triplicate. The figure represented one of the 3 experiments performed in duplicate. Cell invasion and migration were evaluated after two days SGC-7901 and MGC-803 cells were transfected in vitro. Representative microscopic images were presented in the upper panel of each assay graph. The number of cells that invaded or migrated through the filter was counted. Data are expressed as average number of migrated or invaded cells. The cells transfected with chloride intracellular channel 1 (CLIC1) specific small interference RNA (siRNA) 3 were significantly less able to invade or migrate than the mock cells or the negative control cells in both SGC-7901 and MGC-803 cells. aP < 0.05, bP < 0.05 vs control (CTRL) and mock.
- Citation: Ma PF, Chen JQ, Wang Z, Liu JL, Li BP. Function of chloride intracellular channel 1 in gastric cancer cells. World J Gastroenterol 2012; 18(24): 3070-3080
- URL: https://www.wjgnet.com/1007-9327/full/v18/i24/3070.htm
- DOI: https://dx.doi.org/10.3748/wjg.v18.i24.3070


