Copyright
©2012 Baishideng Publishing Group Co.
World J Gastroenterol. Jun 28, 2012; 18(24): 3070-3080
Published online Jun 28, 2012. doi: 10.3748/wjg.v18.i24.3070
Published online Jun 28, 2012. doi: 10.3748/wjg.v18.i24.3070
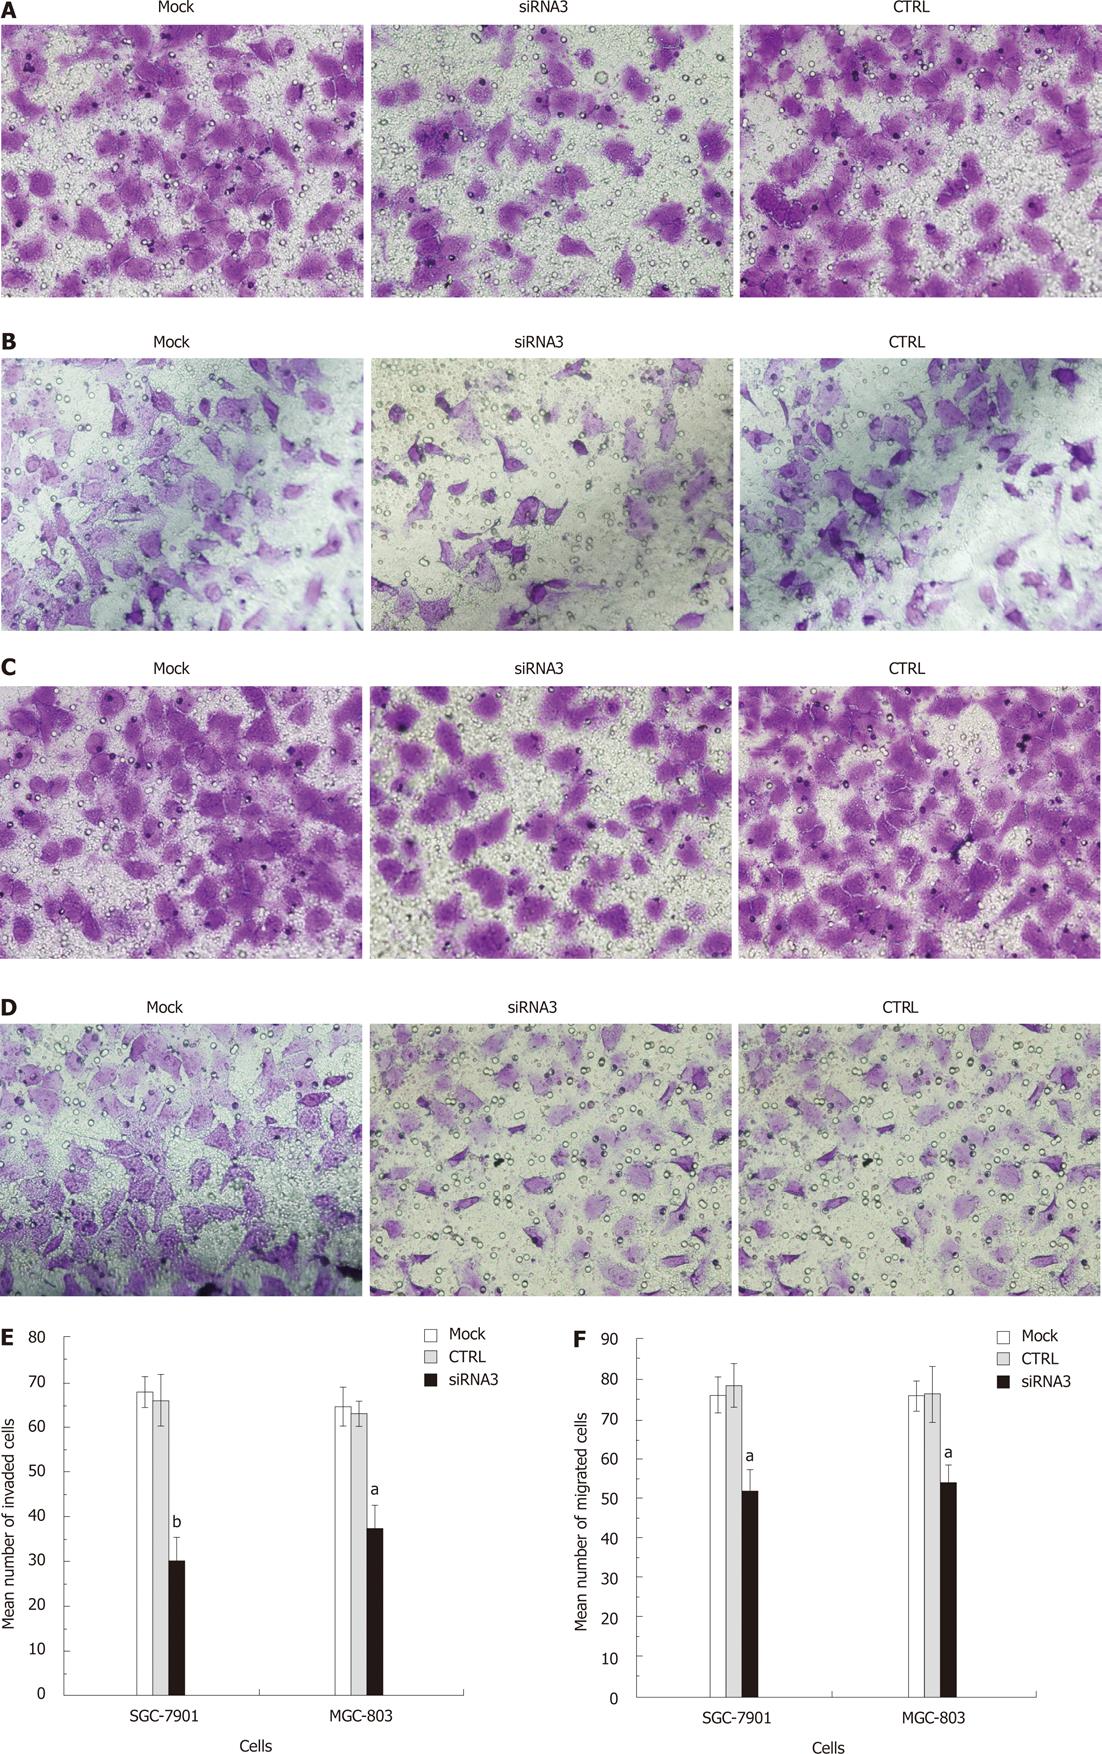
Figure 6 Effects of chloride intracellular channel 1 knockdown on cell migration and invasion in SGC-7901 and MGC-803 cell lines at 48 h.
A: The figure was obtained from the invasion assay of SGC-7901 cells; B: The figure was obtained from the invasion assay of MGC-803 cell; C: The figure was obtained from the migration assay of SGC-7901 cells; D: The figure was obtained from the invasion assay of MGC-803 cell; E: The data was obtained from the invasion assay; F: The data was obtained from the migration assay. The experiment was done in triplicate. The figure represented one of the 3 experiments performed in duplicate. Cell invasion and migration were evaluated after two days SGC-7901 and MGC-803 cells were transfected in vitro. Representative microscopic images were presented in the upper panel of each assay graph. The number of cells that invaded or migrated through the filter was counted. Data are expressed as average number of migrated or invaded cells. The cells transfected with chloride intracellular channel 1 (CLIC1) specific small interference RNA (siRNA) 3 were significantly less able to invade or migrate than the mock cells or the negative control cells in both SGC-7901 and MGC-803 cells. aP < 0.05, bP < 0.05 vs control (CTRL) and mock.
- Citation: Ma PF, Chen JQ, Wang Z, Liu JL, Li BP. Function of chloride intracellular channel 1 in gastric cancer cells. World J Gastroenterol 2012; 18(24): 3070-3080
- URL: https://www.wjgnet.com/1007-9327/full/v18/i24/3070.htm
- DOI: https://dx.doi.org/10.3748/wjg.v18.i24.3070


