Copyright
©2012 Baishideng Publishing Group Co.
World J Gastroenterol. Jun 28, 2012; 18(24): 3070-3080
Published online Jun 28, 2012. doi: 10.3748/wjg.v18.i24.3070
Published online Jun 28, 2012. doi: 10.3748/wjg.v18.i24.3070
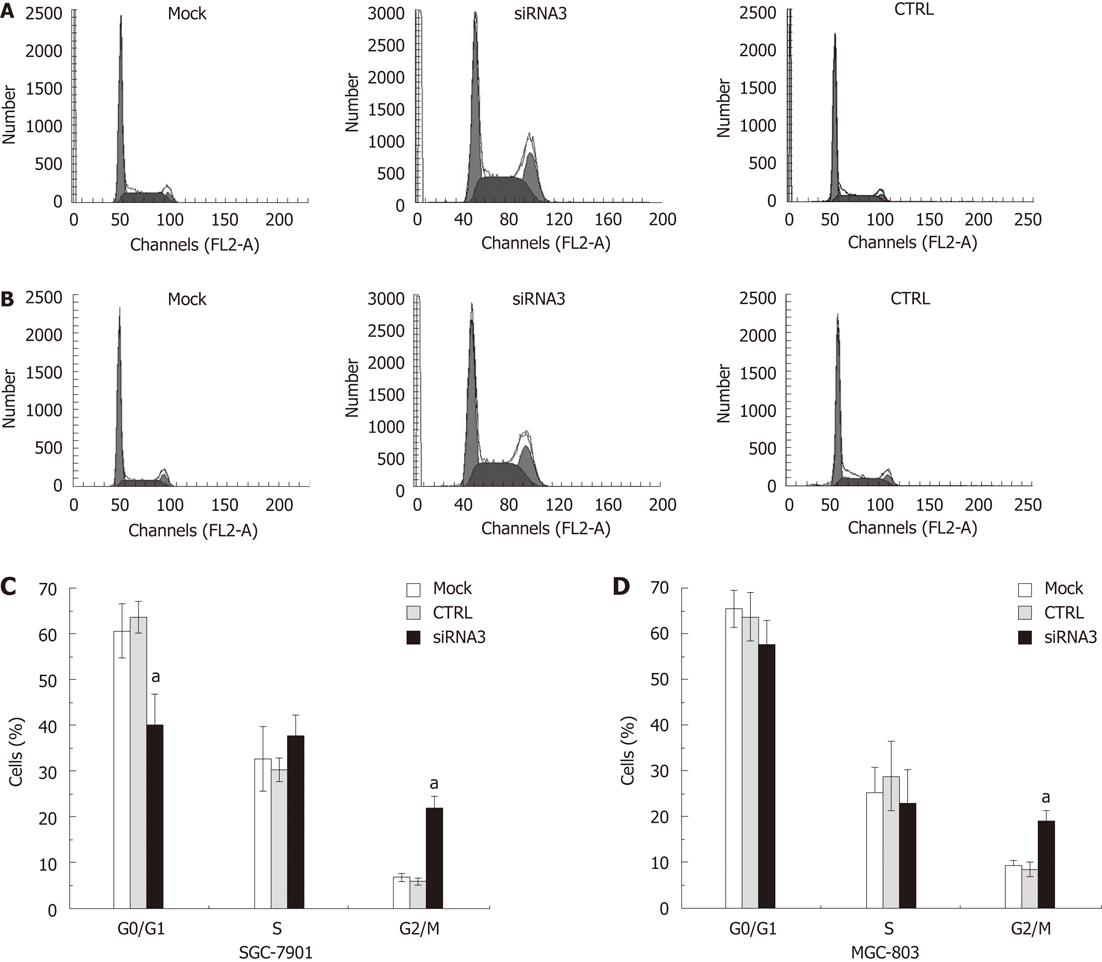
Figure 4 Measurement of the cell-cycle distribution by flow cytometry.
Downregulation of chloride intracellular channel 1 (CLIC1) expression by small interference RNA (siRNA) 3 transfection changed cell cycle distribution in SGC-7901 and MGC-803 cells. At 48 h post-transfection, the cell cycle distribution of these cells was analyzed using propidium iodide staining on flow cytometry. The experiment was done in triplicate. The figure represented one of the 3 experiments performed in duplicate. A: The figure was obtained from SGC-7901 cells; B: The figure was obtained from MGC-803; C: The data was obtained from SGC-7901 cells; D: The data was obtained from MGC-803 cells. aP < 0.05 vs control (CTRL) and mock.
- Citation: Ma PF, Chen JQ, Wang Z, Liu JL, Li BP. Function of chloride intracellular channel 1 in gastric cancer cells. World J Gastroenterol 2012; 18(24): 3070-3080
- URL: https://www.wjgnet.com/1007-9327/full/v18/i24/3070.htm
- DOI: https://dx.doi.org/10.3748/wjg.v18.i24.3070


