Copyright
©2010 Baishideng.
World J Gastroenterol. Jul 21, 2010; 16(27): 3371-3376
Published online Jul 21, 2010. doi: 10.3748/wjg.v16.i27.3371
Published online Jul 21, 2010. doi: 10.3748/wjg.v16.i27.3371
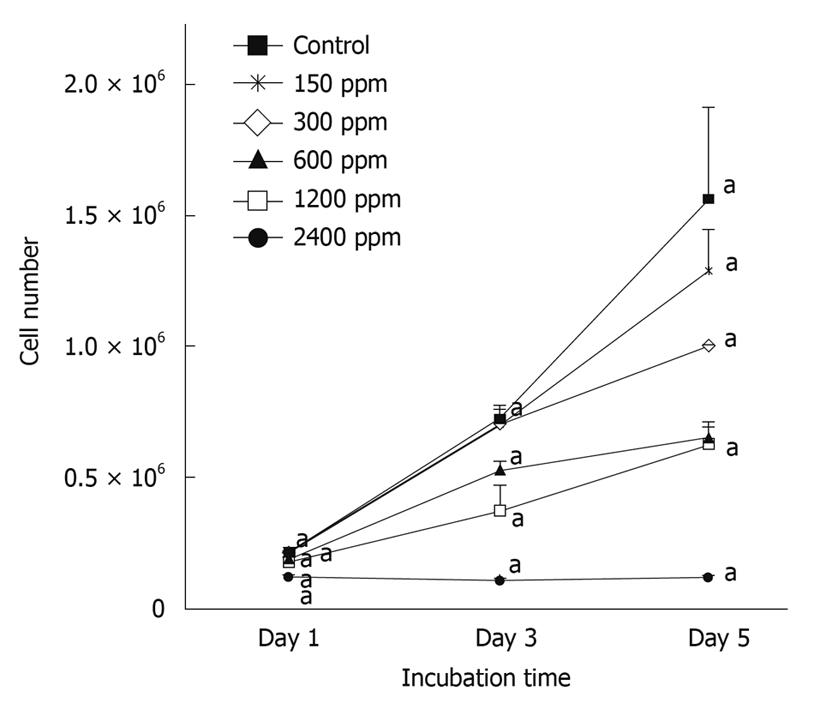
Figure 1 Effect of extracted crude soybean saponins on the growth of WiDr cells.
Different concentrations of saponin at each incubation time were compared using one way analysis of variances with Fisher’s test. Values are mean ± SD. Points with letter “a” represent significant differences at the P < 0.05 level.
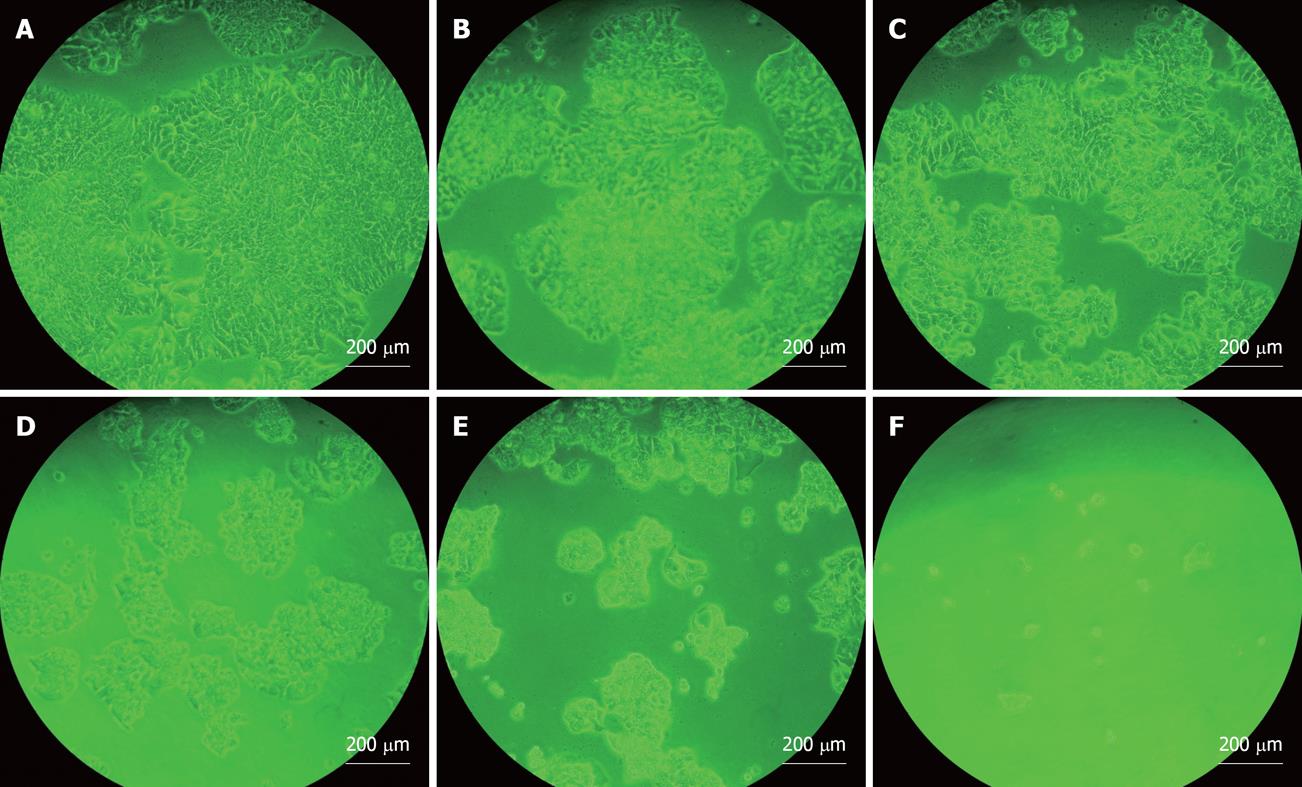
Figure 2 Cell number and morphological effects of extracted crude soybean saponins on WiDr cells.
A: Untreated control culture for 5 d; B: Culture exposed to 150 ppm extracted crude soybean saponins for 5 d; C: 300 ppm; D: 600 ppm; E: 1200 ppm; F: 2400 ppm.
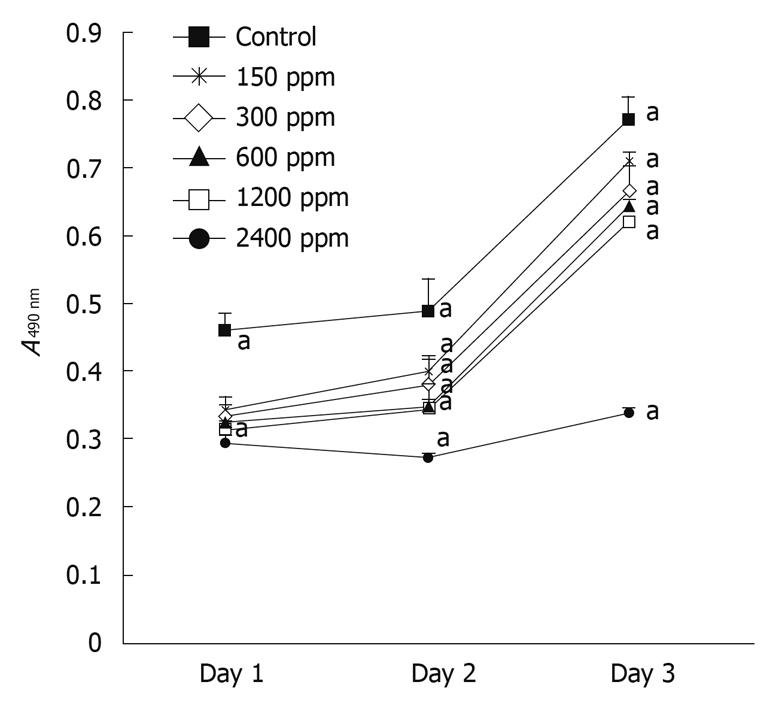
Figure 3 Effect of extracted crude soybean saponins on viability of WiDr cells.
Different concentrations of saponin at each incubation time were compared using one way analysis of variances with Fisher’s test. Values are mean ± SD. Points with letter “a” represent significant differences at the P < 0.05 level.
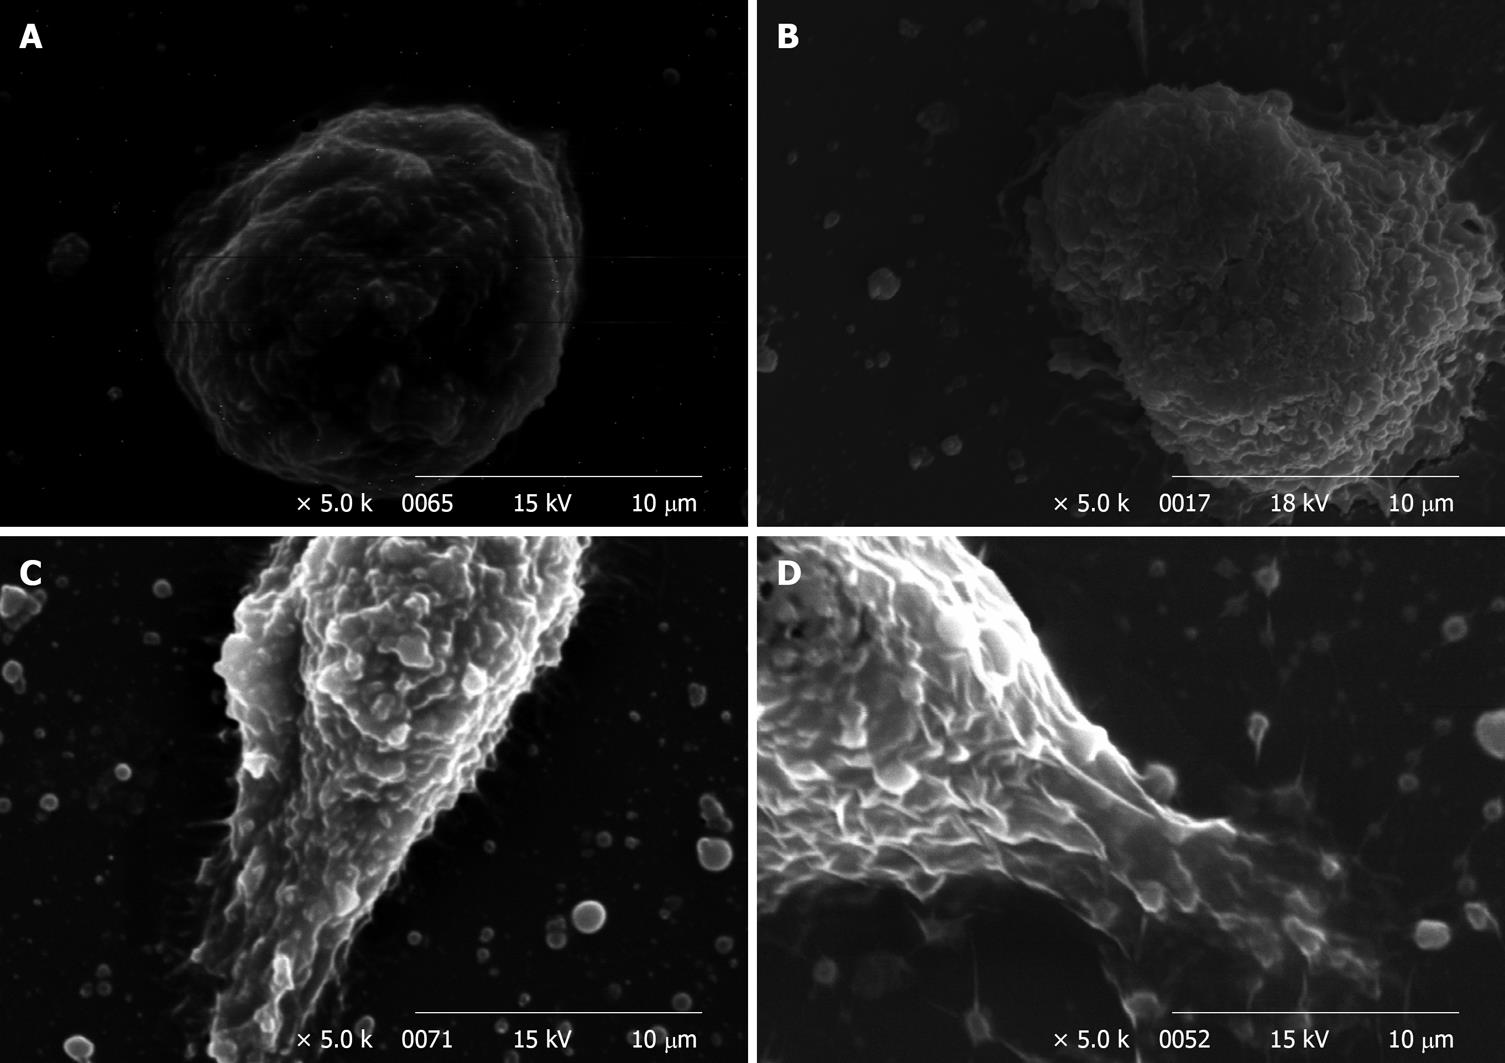
Figure 4 Scanning electron microscopy electron micrographs of WiDr cells.
Cells were treated with 0 (A), 300 (B), 1200 (C) and 2400 ppm (D) soy saponin, for 1 d.
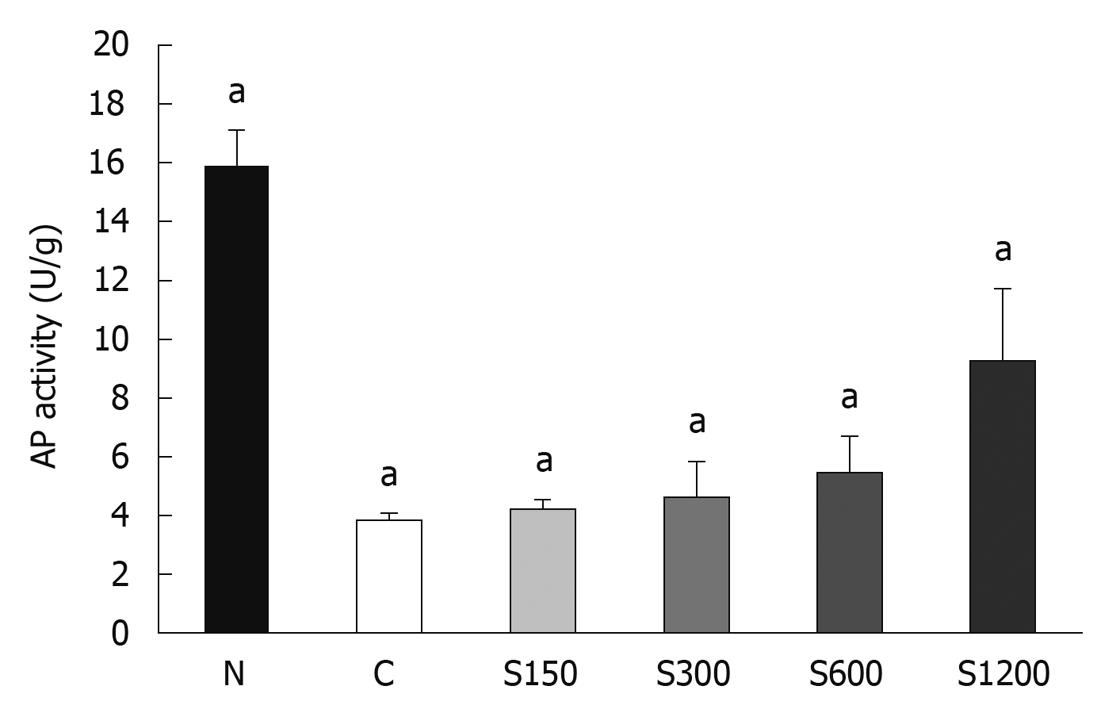
Figure 5 Effect of extracted crude soybean saponins on alkaline phosphatase activity of WiDr cells.
N: Culture exposed to 2.5 mmol/L sodium butyrate for 3 d; C: Untreated control culture for 3 d; S150: Culture exposed to 150 ppm extracted crude soybean saponins for 3 d; S300: 300 ppm; S600: 600 ppm; S1200: 1200 ppm. Different concentrations of saponin at each incubation time were compared using one way analysis of variances and Fisher’s least significant difference test. Values are mean ± SD. Bars with letter “a” represent significant differences at the P < 0.05 level.
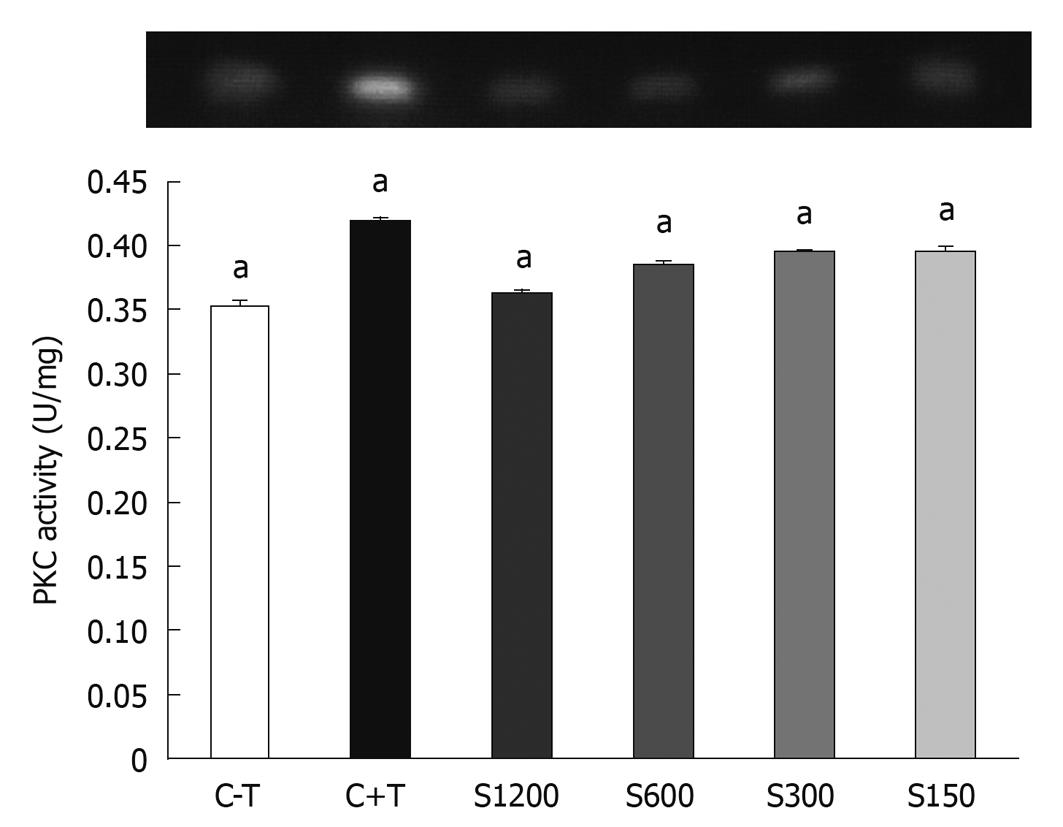
Figure 6 Effect of extracted crude soybean saponins on protein kinase C activity of WiDr cells.
C-T: Untreated control culture for 3 d; C+T: Control culture + 100 ng/mL tetradecanoyl phorbol-13-acetate (TPA); S150: Culture exposed to 150 ppm extracted crude soybean saponins + 100 ng/mL TPA for 3 d; S300: 300 ppm; S600: 600 ppm; S1200: 1200 ppm. Values are mean ± SD. Different concentrations of saponin at each incubation time were compared using one way analysis of variances and Fisher’s least significant difference test. Bars with letter “a” represent significant differences at the P < 0.05 level.
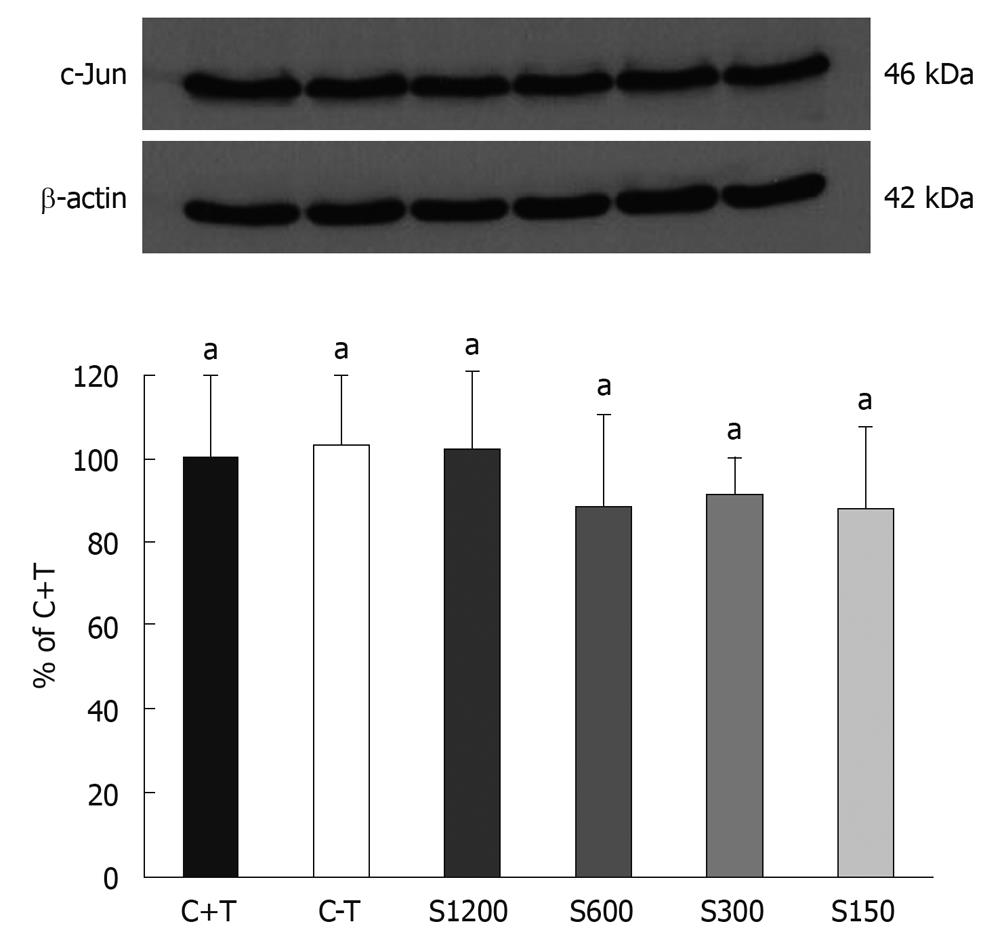
Figure 7 Effect of crude soybean saponins extracted on c-Jun (46 kDa) expression of WiDr cells.
C+T: Control culture + 100 ng/mL tetradecanoyl phorbol-13-acetate (TPA); C-T: Untreated control culture for 3 d; S150: Culture exposed to 150 ppm extracted crude soybean saponins + 100 ng/mL TPA for 3 d; S300: 300 ppm; S600: 600 ppm; S1200: 1200 ppm. Values are mean ± SD. Different concentrations of saponin at each incubation time were compared using one way analysis of variances with Fisher’s test. Bars with letter “a” represent significant differences at the P < 0.05 level.
Figure 8 Transmission electron microscopy electron micrograph of WiDr cells treated with 150 (A), 300 (B), 600 (C), and 1200 (D) ppm of extracted crude soybean saponins for 1 d.
At 600 and 1200 ppm of saponin, vacuoles were observable.
- Citation: Tsai CY, Chen YH, Chien YW, Huang WH, Lin SH. Effect of soy saponin on the growth of human colon cancer cells. World J Gastroenterol 2010; 16(27): 3371-3376
- URL: https://www.wjgnet.com/1007-9327/full/v16/i27/3371.htm
- DOI: https://dx.doi.org/10.3748/wjg.v16.i27.3371


