Copyright
©2010 Baishideng.
World J Gastroenterol. Apr 28, 2010; 16(16): 1970-1978
Published online Apr 28, 2010. doi: 10.3748/wjg.v16.i16.1970
Published online Apr 28, 2010. doi: 10.3748/wjg.v16.i16.1970
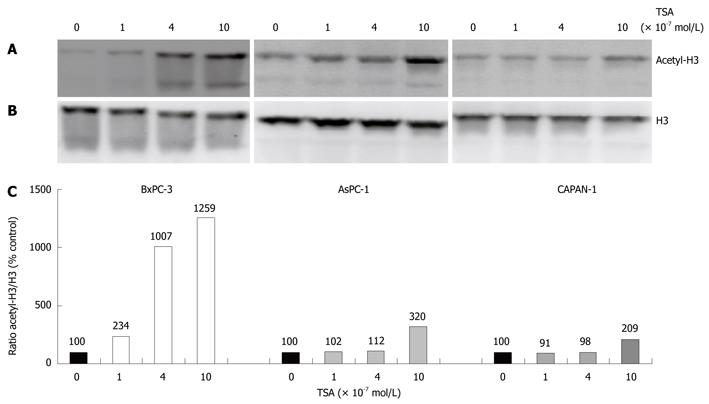
Figure 1 Enhancement of histone H3 acetylation by trichostatin-A (TSA).
The indicated pancreatic cancer (PC) cell lines were treated with various concentrations of TSA for 24 h. A: Histone H3 acetylation was analyzed by immunoblotting; B: Reprobing of the blot with an anti-H3 protein-specific antibody revealed no systematic differences of the histone H3 amount among the samples; C: Acetyl-histone H3 levels were further investigated using image analysis software and related to the histone H3 protein level. Therefore, acetyl-histone H3 and H3 protein signal intensities were determined, and the ratio acetyl-histone H3/H3 protein was calculated. A ratio of 100% corresponds to control cells cultured without TSA. The data shown are representative of three independent experiments.
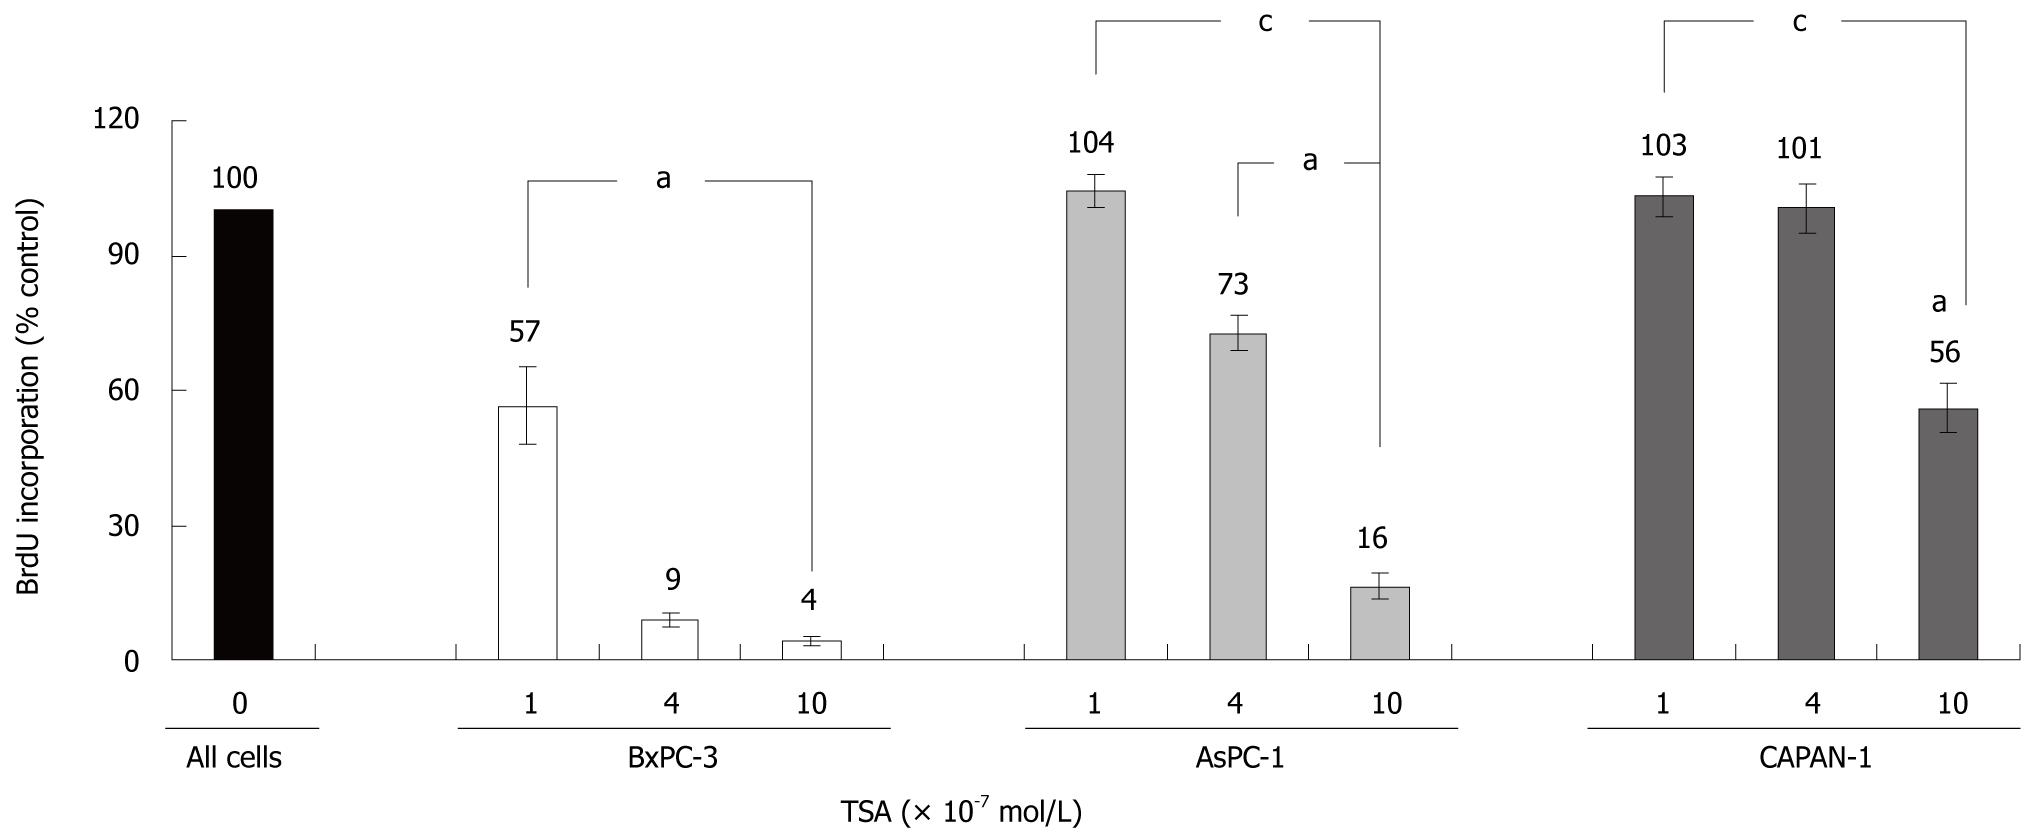
Figure 2 Effects of TSA on the BrdU incorporation of PC cell lines.
BxPC-3, AsPC-1 and CAPAN-1 cells were treated with TSA as indicated for 24 h, before DNA synthesis was assessed with the BrdU incorporation assay. 100% BrdU incorporation corresponds to cells cultured without TSA. Data are presented as mean ± SE (n = 6 separate cultures); aP < 0.05 vs control cultures, cP < 0.05 vs BxPC-3 cells (Wilcoxon’s rank sum test).
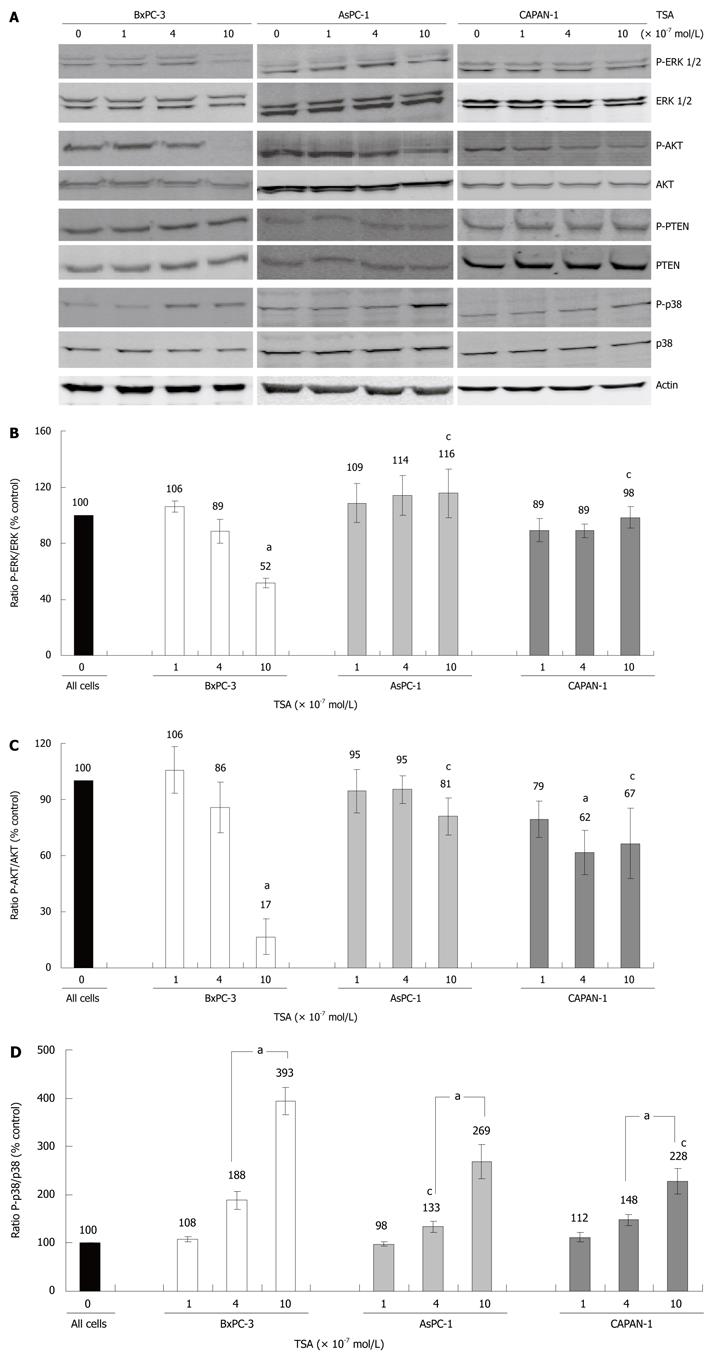
Figure 3 Expression and phosphorylation of signal transduction proteins in TSA-treated PC cell lines.
BxPC-3, AsPC-1 and CAPAN-1 cells were treated with TSA at concentrations up to 10 × 10-7 mol/L for 24 h. A: Expression and phosphorylation of the indicated proteins was analyzed by immunoblotting. Phospho-proteins were detected first, followed by a reprobing of the blots with anti-protein specific antibodies. Actin was used as a housekeeping control protein; B-D: Fluorescence signal intensities of phospho (P) proteins and total proteins were quantified using Odyssey® software version 3.0. Subsequently, the ratios phospho-ERK/ERK protein (B), phospho-AKT/AKT protein (C) and phospho-p38/p38 protein (D) were determined. A ratio of 100% corresponds to control cells cultured without TSA. Data of 8 independent experiments were used to calculate mean values and SE; aP < 0.05 vs control cultures, cP < 0.05 vs BxPC-3 cells (Wilcoxon’s rank sum test).
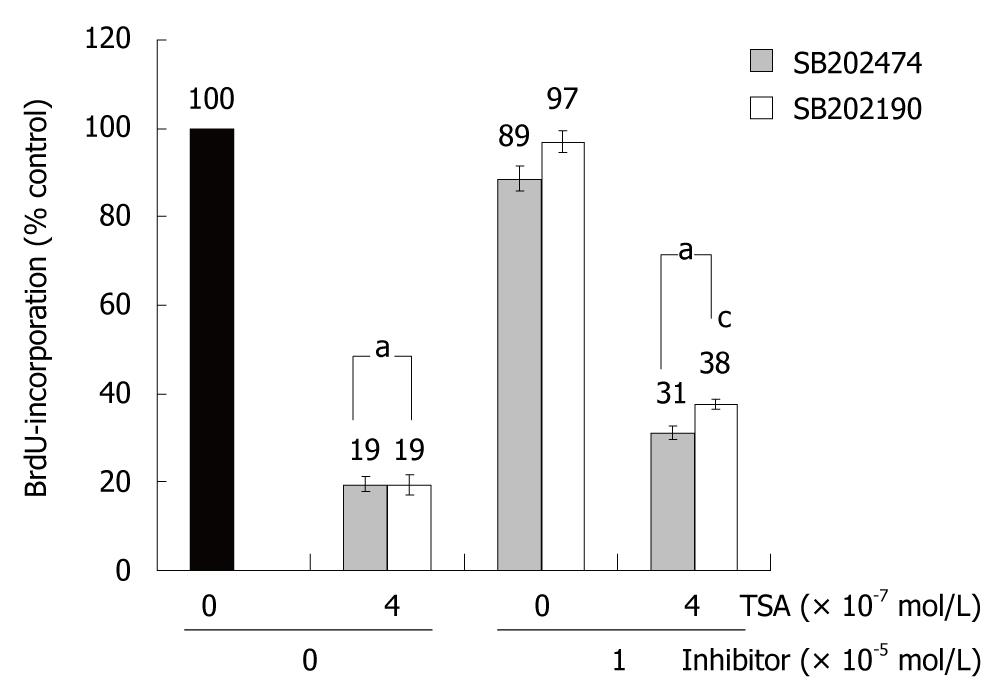
Figure 4 SB202190 diminished inhibition of BrdU incorporation by TSA in BxPC-3 cells.
The cells were treated with TSA, SB202190 and SB202474 at the indicated concentrations for 24 h, before DNA synthesis was assessed with the BrdU incorporation assay. 100% BrdU incorporation corresponds to untreated cells. Data are presented as mean ± SE (n = 16 separate cultures); aP < 0.05 vs control cultures, cP < 0.05 vs SB202474-treated cells (identical concentration of TSA) (Wilcoxon’s rank sum test).
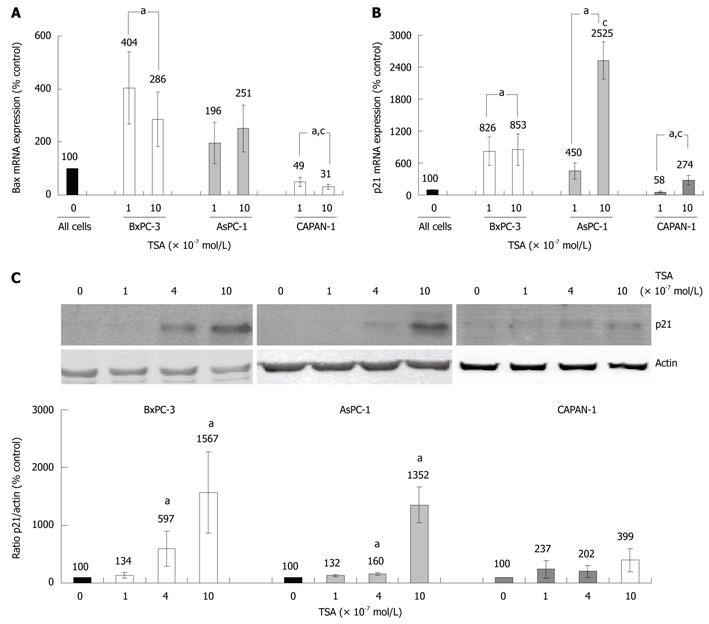
Figure 5 Effects of TSA on BAX and p21Waf1 expression in PC cell lines.
A, B: The cell lines were incubated with TSA for 8 h as indicated. The mRNA expression of Bax (A), p21Waf1 (B) and the housekeeping gene GAPDH (A and B) was analyzed by real time PCR, and relative amounts of target mRNA were determined. 100% mRNA expression of each gene corresponds to cells cultured without TSA. Data of ≥ 6 independent experiments were used to calculate mean values and SE; aP < 0.05 vs control cultures, cP < 0.05 vs BxPC-3 cells (Mann-Whitney test); C: BxPC-3, AsPC-1 and CAPAN-1 cells were treated with TSA at concentrations up to 10 × 10-7 mol/L for 24 h. Expression of the p21Waf1 protein and actin (housekeeping control protein) was analyzed by immunoblotting. Fluorescence signal intensities of p21Waf1 and actin were quantified, and the ratio p21Waf1/actin was determined. A ratio of 100% corresponds to control cells cultured without TSA. Data of 8 independent experiments were used to calculate mean values and SE; aP < 0.05 vs control cultures, cP < 0.05 vs BxPC-3 cells (Wilcoxon’s rank sum test).
- Citation: Emonds E, Fitzner B, Jaster R. Molecular determinants of the antitumor effects of trichostatin A in pancreatic cancer cells. World J Gastroenterol 2010; 16(16): 1970-1978
- URL: https://www.wjgnet.com/1007-9327/full/v16/i16/1970.htm
- DOI: https://dx.doi.org/10.3748/wjg.v16.i16.1970


