Copyright
©2010 Baishideng.
World J Gastroenterol. Apr 28, 2010; 16(16): 1970-1978
Published online Apr 28, 2010. doi: 10.3748/wjg.v16.i16.1970
Published online Apr 28, 2010. doi: 10.3748/wjg.v16.i16.1970
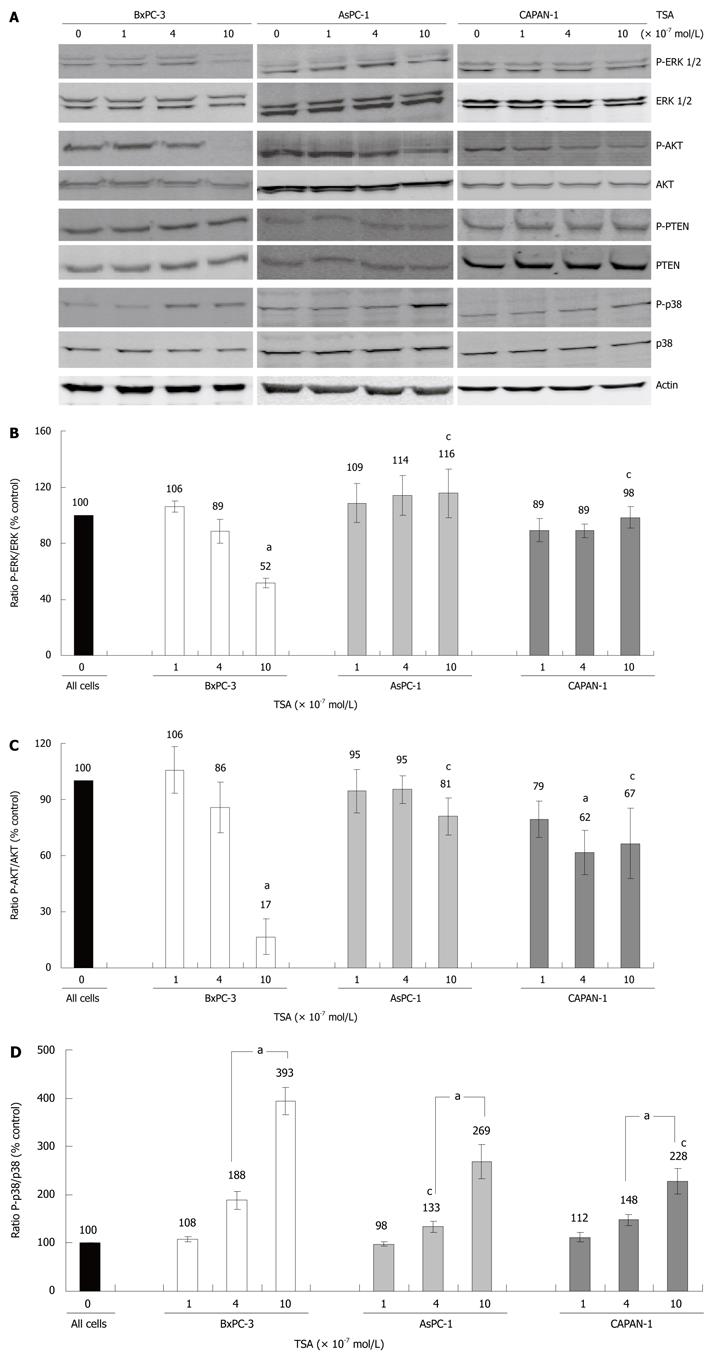
Figure 3 Expression and phosphorylation of signal transduction proteins in TSA-treated PC cell lines.
BxPC-3, AsPC-1 and CAPAN-1 cells were treated with TSA at concentrations up to 10 × 10-7 mol/L for 24 h. A: Expression and phosphorylation of the indicated proteins was analyzed by immunoblotting. Phospho-proteins were detected first, followed by a reprobing of the blots with anti-protein specific antibodies. Actin was used as a housekeeping control protein; B-D: Fluorescence signal intensities of phospho (P) proteins and total proteins were quantified using Odyssey® software version 3.0. Subsequently, the ratios phospho-ERK/ERK protein (B), phospho-AKT/AKT protein (C) and phospho-p38/p38 protein (D) were determined. A ratio of 100% corresponds to control cells cultured without TSA. Data of 8 independent experiments were used to calculate mean values and SE; aP < 0.05 vs control cultures, cP < 0.05 vs BxPC-3 cells (Wilcoxon’s rank sum test).
- Citation: Emonds E, Fitzner B, Jaster R. Molecular determinants of the antitumor effects of trichostatin A in pancreatic cancer cells. World J Gastroenterol 2010; 16(16): 1970-1978
- URL: https://www.wjgnet.com/1007-9327/full/v16/i16/1970.htm
- DOI: https://dx.doi.org/10.3748/wjg.v16.i16.1970


