Copyright
©2009 The WJG Press and Baishideng.
World J Gastroenterol. Aug 14, 2009; 15(30): 3757-3766
Published online Aug 14, 2009. doi: 10.3748/wjg.15.3757
Published online Aug 14, 2009. doi: 10.3748/wjg.15.3757
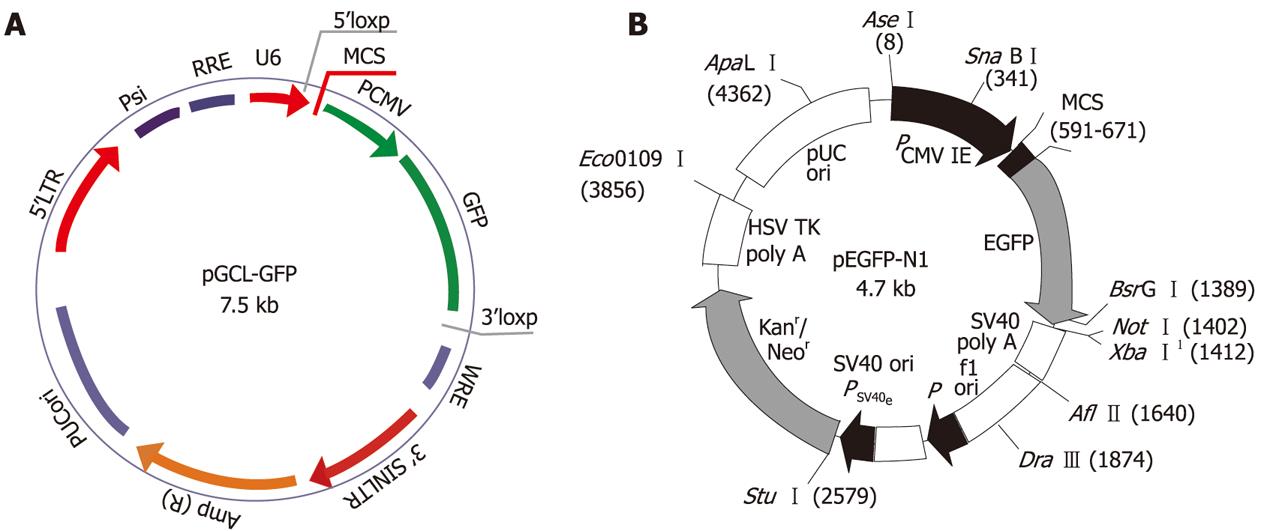
Figure 1 Structure of vectors.
A: Lentivirus vector pGCL-GFP containing a CMV driven GFP reporter and a U6 promoter upstream of cloning restriction sites (HpaI and XhoI) to allow the introduction of oligonucleotides encoding shRNAs. The multiple cloning site (MCS) is located between the U6 promoter and CMV. B: The pEGFP-N1 vector expressed green fluorescent protein following transfection into mammalian cells. MCS is located between the immediate early promoter of CMV and the EGFP. 1Methylated in the DNA provided by CLONTECH.
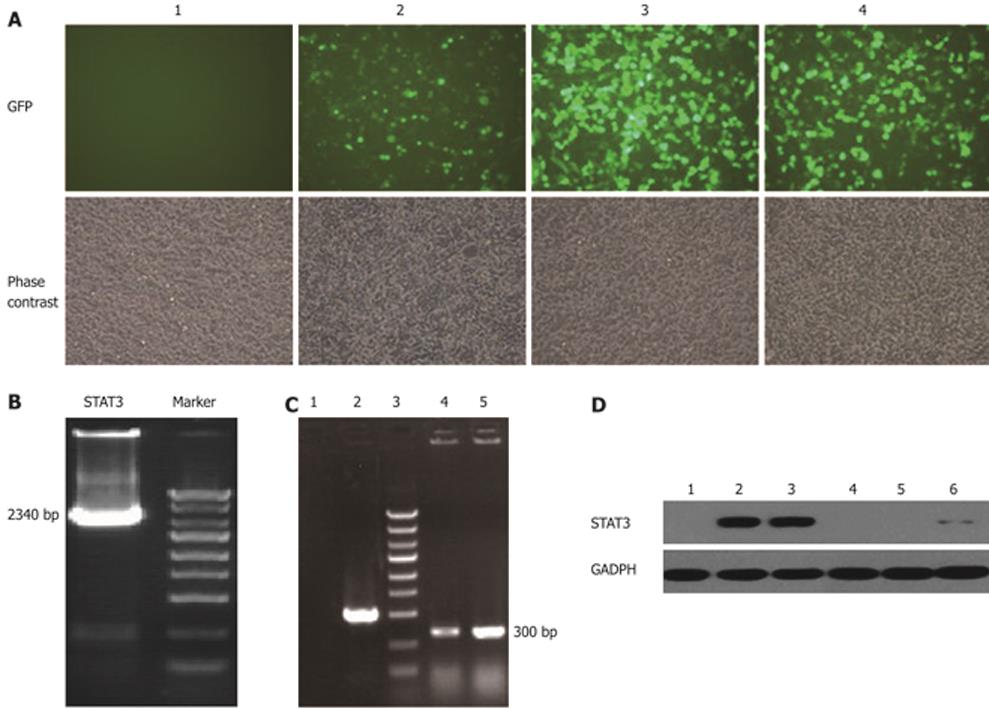
Figure 2 Selection of the most effective STAT3 specific siRNA expression vector in 293T cells.
A: Phase contrast and GFP expression under a fluorescent microscope was taken after 36-48 h in 293T cells, 1: 293T cells; 2: Transfection of pEGFP-N1 vector in 293T cells; 3: Transfection of pEGFP-N1-STAT3; 4: Co-transfected of pEGFP-N1-STAT3 and pGCL-GFP-siRNA vectors in 293T cells (original magnification × 200). B: STAT3 gene was cloned from the cDNA library with production of 2340 bp by PCR. C: pEGFP-N1-STAT3 was constructed after restricted enzyme cutting and connection with production of 300 bp by PCR. 1: pEGFP-N1 vector; 2: A special sequence was inserted in pEGFP-N1 vector; 3: Marker; 4-5: STAT3 gene over-expression vector pEGFP-N1-STAT3. D: Protein level of STAT3 in 293T cells was detected by western blotting. Lanes 1-6: 293T cells, STAT3 gene over-expression vector, non-silence control, LV-STAT3siRNA-1, -2, and-3 respectively. LV-STAT3siRNA-1 and LV-STAT3siRNA-2 can significantly knock down expression of STAT3 at the protein level.
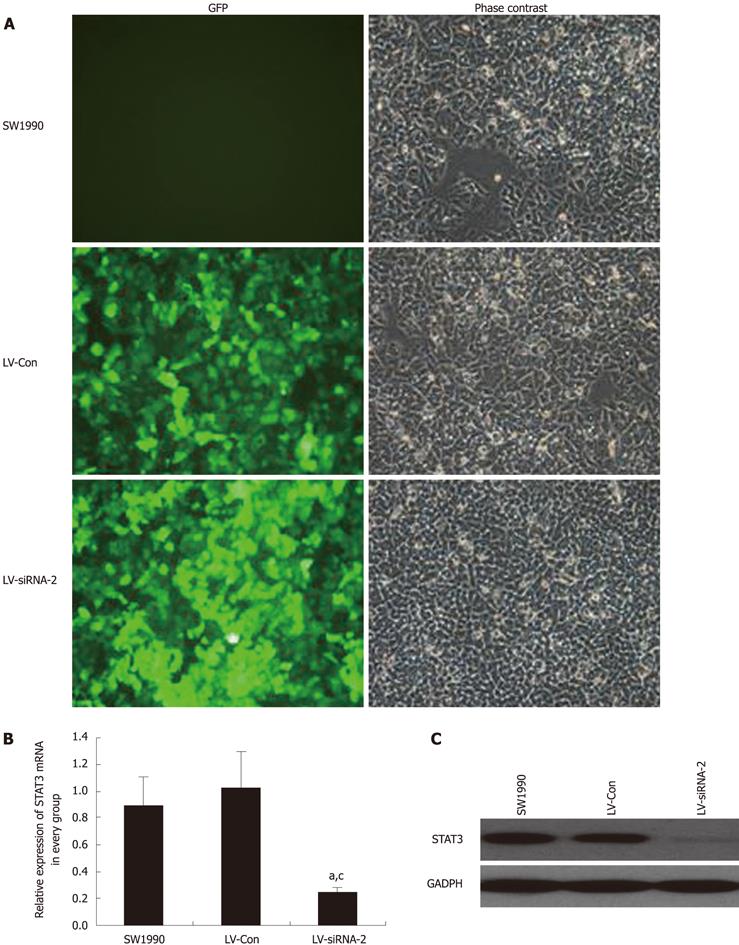
Figure 3 Expression of STAT3 suppressed by LV-siSTAT3-2 in SW1990 cells.
A: SW1990 cells were infected with LV-Con or LV-STAT3siRNA-2; The cells were infected (MOI = 40), GFP expression and the phase contrast images were taken after 72 h (original magnification × 200). B: mRNA level of STAT3 after SW1990 cells were treated with LV-STAT3siRNA-2 and LV-Con detected by real-time PCR. LV-STAT3siRNA-2 significantly inhibited expression of STAT3 mRNA in SW1990 cells, aP < 0.05, compared with SW1990 cells, cP < 0.05, compared with LV-Con group. C: Western blotting analysis showed that STAT3 protein was markedly inhabited by LV-STAT3siRNA-2 in SW1990 cells.
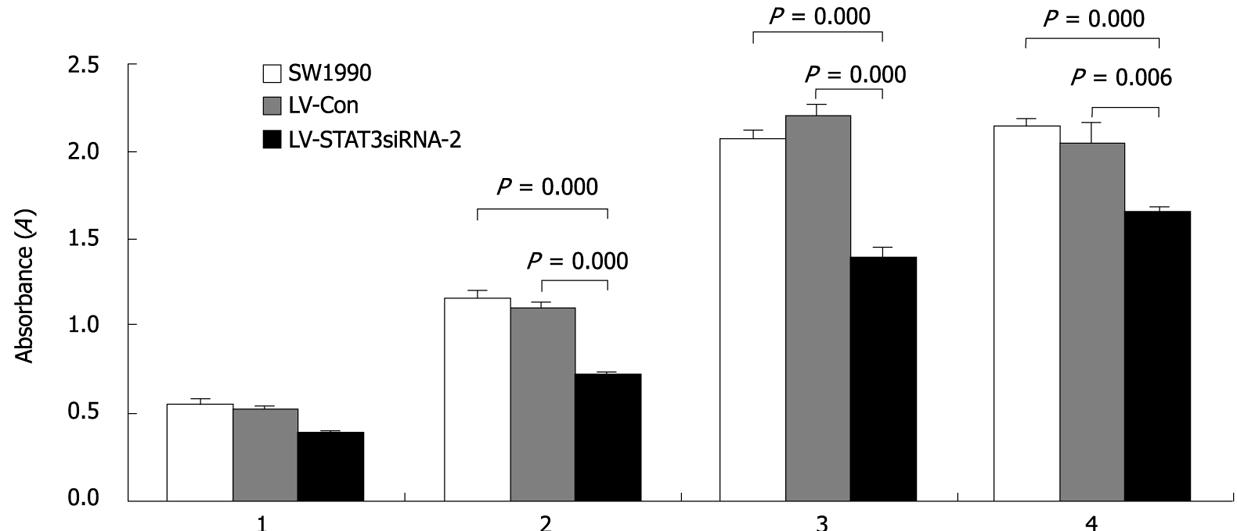
Figure 4 Pancreatic cancer cells growth was detected by MTT assay.
SW1990 cells growing in 96-well plates were infected with LV-STAT3siRNA-2 and LV-Con 1, 2, 3, 4 d respectively, and the MTT assay revealed that the cell growth was significantly suppressed by LV-STAT3siRNA-2 in SW1990 cells compared with LV-Con group and parental SW1990 group. Data are mean ± SD.
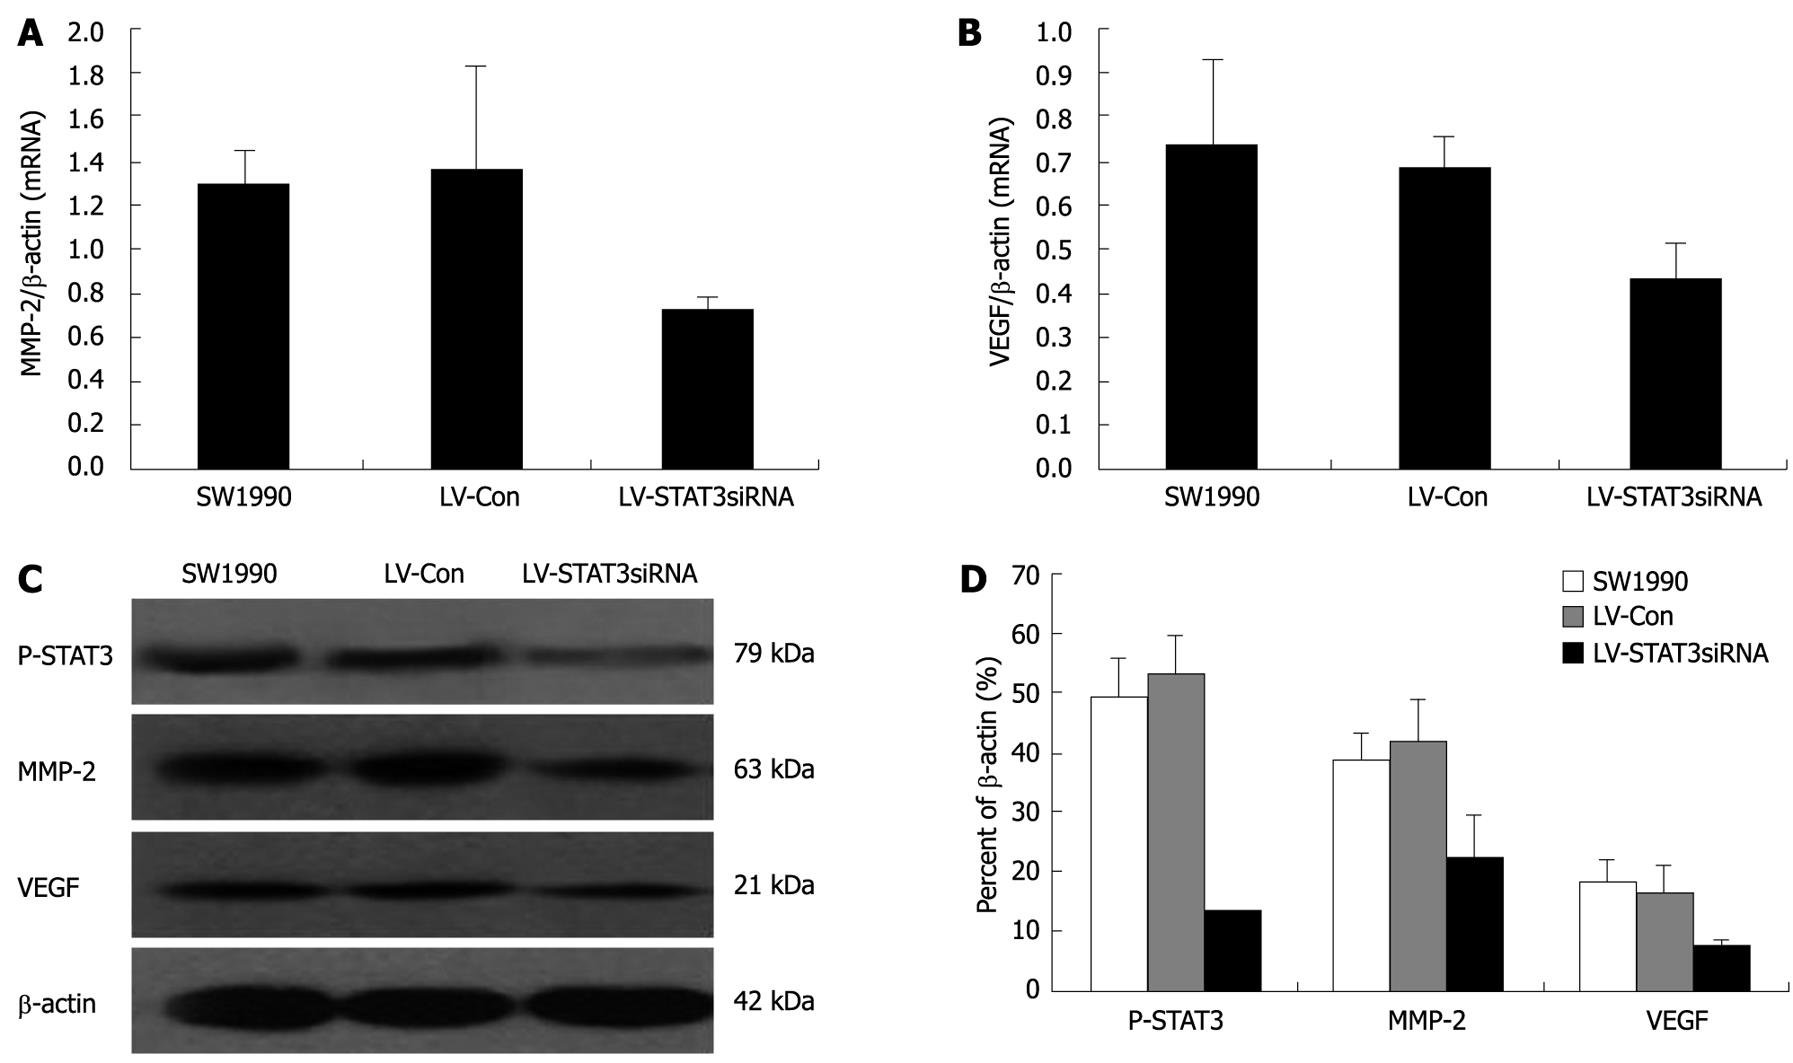
Figure 5 The expression of MMP-2 and VEGF was analyzed by real-time PCR and Western blotting in the human pancreatic cancer cell lines.
LV-STAT3siRNA-2 significantly inhibited mRNA and protein expression of MMP-2 and VEGF in SW1990 cell. A: MMP-2 mRNA expression in every group. B: VEGF mRNA expression in every group. C: P-STAT3, MMP-2 and VEGF protein expression in every group.
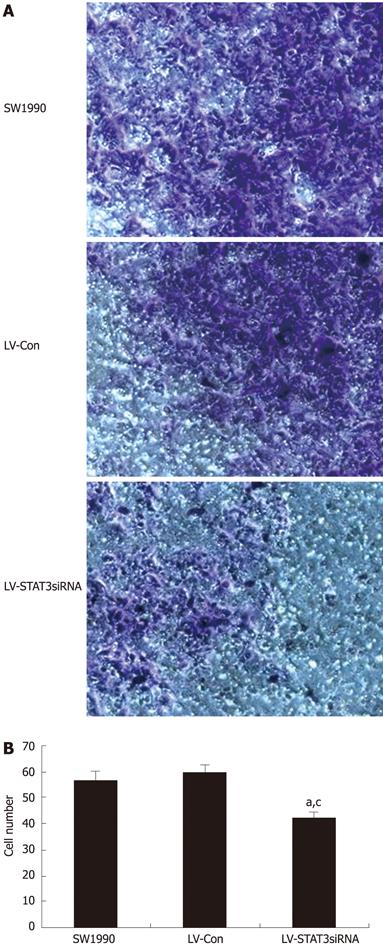
Figure 6 Invasion assay was performed using a specialized invasion chamber.
A: The blue-stained cells are those that invaded the ECMatrix and migrated through the polycarbonate membrane to the lower surface of the membrane (original magnification × 200). B: Invasion assay indicated LV-STAT3siRNA significantly decreased the invasion ability of SW1990 cells. Bars indicate mean ± SD. aP < 0.05 vs SW1990 group, cP < 0.05 vs LV-Con group.
- Citation: Yang G, Huang C, Cao J, Huang KJ, Jiang T, Qiu ZJ. Lentivirus-mediated shRNA interference targeting STAT3 inhibits human pancreatic cancer cell invasion. World J Gastroenterol 2009; 15(30): 3757-3766
- URL: https://www.wjgnet.com/1007-9327/full/v15/i30/3757.htm
- DOI: https://dx.doi.org/10.3748/wjg.15.3757


