Copyright
©2006 Baishideng Publishing Group Co.
World J Gastroenterol. Apr 14, 2006; 12(14): 2187-2194
Published online Apr 14, 2006. doi: 10.3748/wjg.v12.i14.2187
Published online Apr 14, 2006. doi: 10.3748/wjg.v12.i14.2187
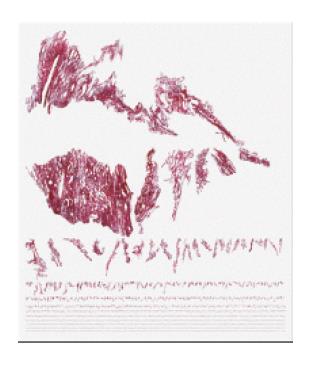
Figure 1 Prototypical catalogues of the Sirius-red stained collagen islets forming liver fibrosis, which consists of a set of irregularly shaped (wrinkled) objects.
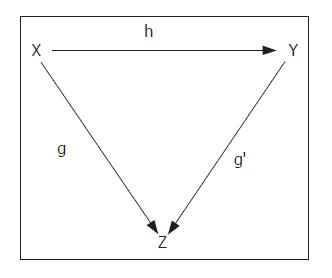
Figure 2 Categorial model of the harmonic state of liver tissue, in which z denotes the harmony of the natural architecture of liver tissue, x the metric space covered by fibrosis, and y the metric space covered by the parenchyma.
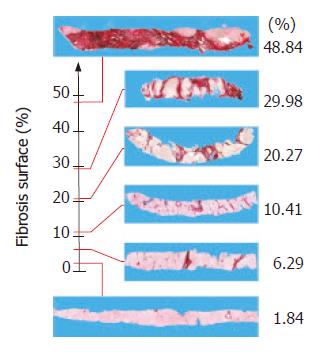
Figure 3 Trajectory of the dynamics of the fibrotic process considered as a continuous straight line going from 0% to 48.
84% (the highest empirically observed percentage), without any jumps or abrupt swervings. The interaction of every experimental scalar expressing the state of the propositus fibrosis and the points of the geometric model gives the staging of fibrogenesis.
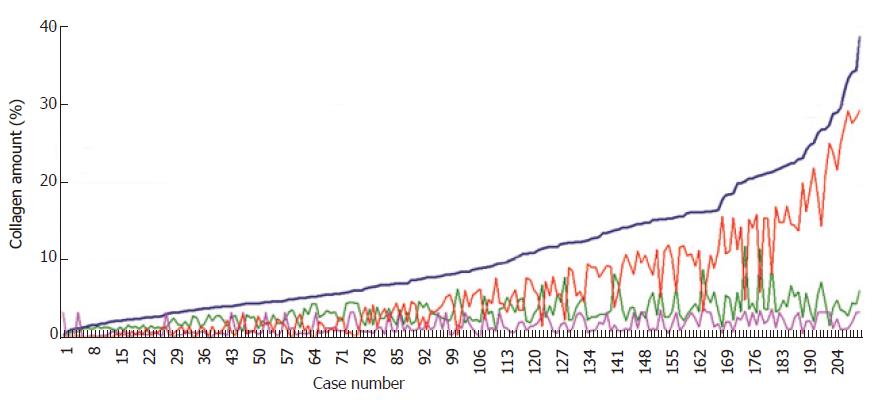
Figure 4 Comparative analysis of Markovian sequence of the amount of fibrosis, and the three sequences expressing the classes of magnitude of the collagen islets identified in 209 needle biopsy specimens.
(1). Markovian sequence of the total amount of fibrosis in a histological biopsy section (blue line); (2). Percentage of collagen islets with a magnitude of 104-106μm2 (red line); (3). Percentage of collagen islets with a magnitude of 103-104μm2 (fuchsia line); (4). Percentage of collagen islets with a magnitude of 101-103μm2 (green line).
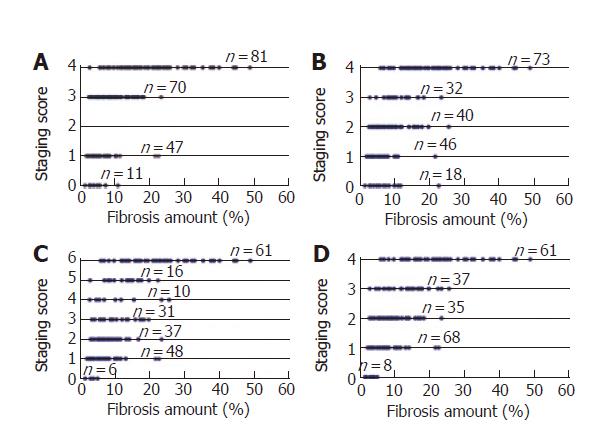
Figure 5 Comparison of the phase portraits obtained using the scalar values of the rectified areas of fibrosis projected onto the state spaces of each Knodell HAI (A), Sheuer (B), Ishak (C), and METAVIR category (D).
All the graphs highlight the considerable overlapping of the data referring to different categories.
- Citation: Dioguardi N, Grizzi F, Franceschini B, Bossi P, Russo C. Liver fibrosis and tissue architectural change measurement using fractal-rectified metrics and Hurst’s exponent. World J Gastroenterol 2006; 12(14): 2187-2194
- URL: https://www.wjgnet.com/1007-9327/full/v12/i14/2187.htm
- DOI: https://dx.doi.org/10.3748/wjg.v12.i14.2187


