Copyright
©2006 Baishideng Publishing Group Co.
World J Gastroenterol. Apr 14, 2006; 12(14): 2187-2194
Published online Apr 14, 2006. doi: 10.3748/wjg.v12.i14.2187
Published online Apr 14, 2006. doi: 10.3748/wjg.v12.i14.2187
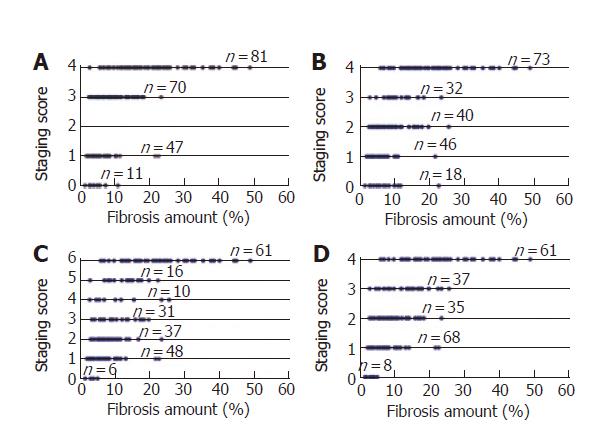
Figure 5 Comparison of the phase portraits obtained using the scalar values of the rectified areas of fibrosis projected onto the state spaces of each Knodell HAI (A), Sheuer (B), Ishak (C), and METAVIR category (D).
All the graphs highlight the considerable overlapping of the data referring to different categories.
- Citation: Dioguardi N, Grizzi F, Franceschini B, Bossi P, Russo C. Liver fibrosis and tissue architectural change measurement using fractal-rectified metrics and Hurst’s exponent. World J Gastroenterol 2006; 12(14): 2187-2194
- URL: https://www.wjgnet.com/1007-9327/full/v12/i14/2187.htm
- DOI: https://dx.doi.org/10.3748/wjg.v12.i14.2187


