Copyright
©2006 Baishideng Publishing Group Co.
World J Gastroenterol. Apr 14, 2006; 12(14): 2187-2194
Published online Apr 14, 2006. doi: 10.3748/wjg.v12.i14.2187
Published online Apr 14, 2006. doi: 10.3748/wjg.v12.i14.2187
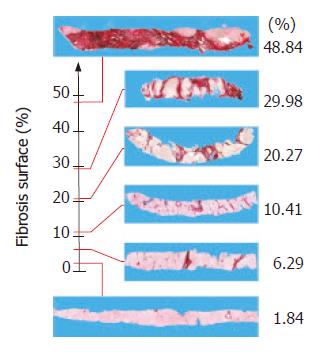
Figure 3 Trajectory of the dynamics of the fibrotic process considered as a continuous straight line going from 0% to 48.
84% (the highest empirically observed percentage), without any jumps or abrupt swervings. The interaction of every experimental scalar expressing the state of the propositus fibrosis and the points of the geometric model gives the staging of fibrogenesis.
- Citation: Dioguardi N, Grizzi F, Franceschini B, Bossi P, Russo C. Liver fibrosis and tissue architectural change measurement using fractal-rectified metrics and Hurst’s exponent. World J Gastroenterol 2006; 12(14): 2187-2194
- URL: https://www.wjgnet.com/1007-9327/full/v12/i14/2187.htm
- DOI: https://dx.doi.org/10.3748/wjg.v12.i14.2187


