Copyright
©2005 Baishideng Publishing Group Inc.
World J Gastroenterol. Oct 28, 2005; 11(40): 6243-6248
Published online Oct 28, 2005. doi: 10.3748/wjg.v11.i40.6243
Published online Oct 28, 2005. doi: 10.3748/wjg.v11.i40.6243
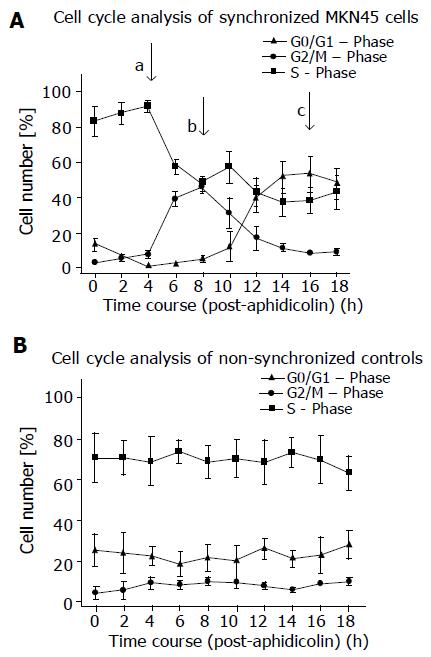
Figure 1 Facs analysis of synchronized MKN45 cells.
Cell number is given in %. Non-synchronized control cells reside in the S-phase of the cell cycle. When MKN45 cells were blocked with aphidicolin and then replated in fresh medium to allow cell cycle progression, MKN45 entered S phase after 4 h (arrow a), G2/M after 8 h (arrow b) and G0/G1 after 16 h (arrow c). Mean±SD of n = 3 experiments (A,B).
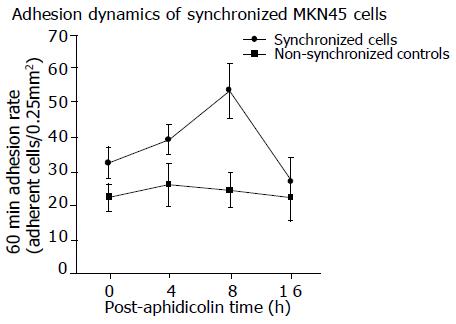
Figure 2 Adhesion capacity of synchronized MKN45 cells to HUVEC.
MKN45 cells were treated for 24 h with aphidicolin. Cells were then washed and replated in fresh medium to allow cell cycle progression. Cells were sampled after 0, 4, 8 and 16 h following aphidicolin treatment (n = 6). A 60-min adhesion to HUVEC was determined at each time point and compared with non-synchronous cells. Mean±SD of n = 6 experiments.
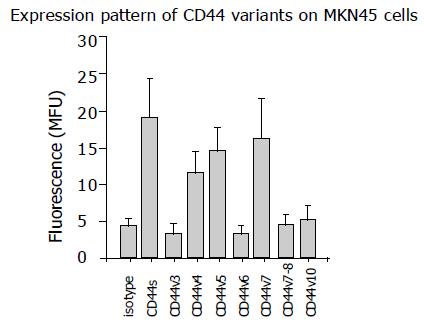
Figure 3 Facs analysis of CD44 and CD44 splice variant expression of MKN45 cells.
Primary antibodies, indicated in methods, were conjugated with fluorescein isothiocyanate (FITC). CD44 surface expression of MKN45 cells was then measured using a FACscan (FL-1H (log) channel histogram analysis; 1 x10⁴ cells/scan) and expressed as mean fluorescence units (MFU). Mouse IgG1-FITC was used as an isotype control. Mean±SD of n = 3 experiments.
Figure 4 Expression of CD44v4(A), CD44v5(B) and CD44v7(C) on MKN45 cells during cell cycle transit.
Synchronized MKN45 cells were labeled with anti-CD44v4, anti-CD44v5 or anti-CD44v7 at indicated time points. Non-synchronized cells served as controls. Fluorescence intensity was measured using a FACscan (FL-1H (log) channel histogram analysis; 1 x10⁴ cells/scan) and expressed as mean fluorescence units (MFU). Mean±SD of n = 6 experiments.
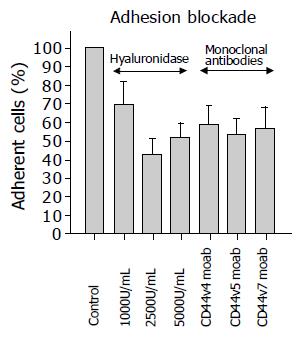
Figure 5 MKN45 cells were preincubated for 60 min with anti CD44v4, anti CD44v5 or anti CD44v7 monoclonal antibodies at 1:80 dilution.
MKN45 cells were then added to HUVEC monolayer to evaluate the adhesion capacity (right part of Figure 5). In a second set of experiments, HUVEC were treated with hyaluronidase for 60 min (1 000, 2 500, or 5 000 U/mL), before MKN45 cells were added (left part of Figure 5). Non treated HUVEC served as the 100% control. Mean±SD of n = 6 experiments.
- Citation: Oertl A, Castein J, Engl T, Beecken WD, Jonas D, Melamed R, Blaheta RA. Endothelial adhesion of synchronized gastric tumor cells changes during cell cycle transit and correlates with the expression level of CD44 splice variants. World J Gastroenterol 2005; 11(40): 6243-6248
- URL: https://www.wjgnet.com/1007-9327/full/v11/i40/6243.htm
- DOI: https://dx.doi.org/10.3748/wjg.v11.i40.6243


