Copyright
©The Author(s) 2015.
World J Diabetes. Feb 15, 2015; 6(1): 125-135
Published online Feb 15, 2015. doi: 10.4239/wjd.v6.i1.125
Published online Feb 15, 2015. doi: 10.4239/wjd.v6.i1.125
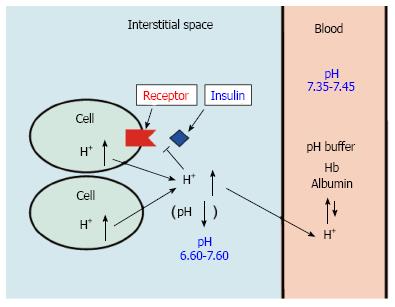
Figure 1 pH of interstitial fluid and blood, and binding affinity of insulin to its receptor.
Interstitial fluids have little pH-buffering molecules, while blood has very strong, powerful pH buffering molecules such as hemoglobin and albumin. Thus, even under mild but not severe metabolic disorder conditions, blood pH is kept constant within a normal range (7.35-7.45), but interstitial fluid pH would be lower than a normal level.
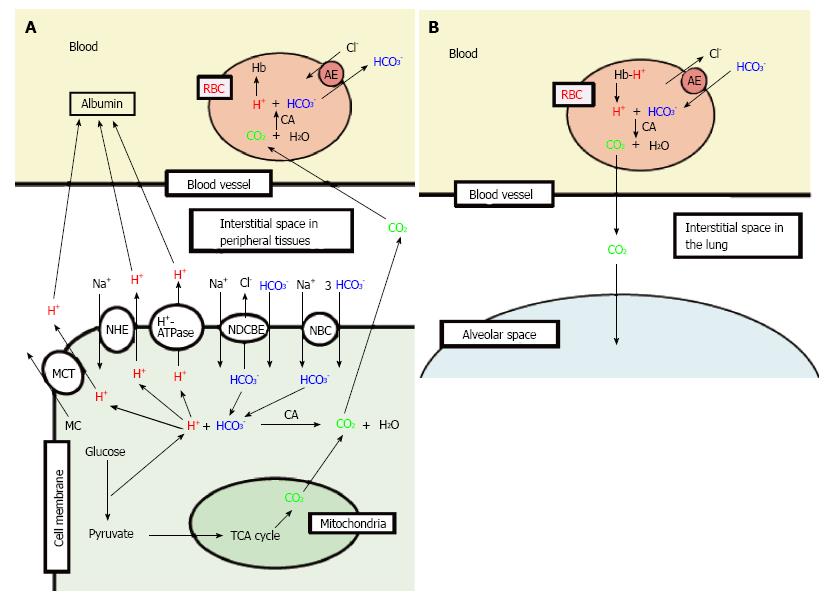
Figure 2 Production of H+, and H+ transporting systems in peripheral tissues (A) and the lung (B).
A: In cells of peripheral tissues, H+ is produced from organic acids generated as metabolites via glycolysis such as lactic acid. H+ is directly extruded via Na+/H+ exchanger (NHE), H+-ATPase and H+-coupled monocarboxylate (MC) transporter (MCT) from intracellular to extracellular (interstitial) spaces, and moves into blood, and binds to albumin. Further, a part of H+ produced from metabolites is converted to CO2 and H2O consuming HCO3-via carbonic anhydrase (CA)-mediated facilitation process. To supply HCO3- consumed for conversion of H+ to CO2 and H2O in cells, Na+-driven Cl-/HCO3- exchanger (NDCBE) and Na+-HCO3- cotransporter (NBC) participate in uptake of HCO3- into intracellular from extracellular (interstitial) spaces. CO2 moves into red blood cell (RBC, erythrocyte) in blood via permeation across the plasma membrane of RBC due to high CO2 permeability of the plasma membrane, and is converted to H+ and HCO3- consuming H2O via CA-mediated facilitation process. H+ produced from CO2 and H2O via CA-mediated facilitation process in RBC binds to hemoglobin. HCO3- produced from CO2 and H2O via CA-mediated facilitation process in RBC is extruded from intracellular to extracellular (interstitial) spaces via exchange of Cl- existing in the extracellular space by anion exchanger (AE): this exchanging step of HCO3- extrusion and Cl- uptake is so called as Cl- shift; B: In the lung, the reversible process occurs due to low CO2 circumstances.
Figure 3 Insulin binding to insulin receptor under various pH conditions.
After serum starved for 4 h, L6 myotubes were treated with 100 nmol/L insulin for 15 min in the HEPES buffer with different values of pH. Proteins expressed on the plasma membrane were biotinylated and precipitated. Differentiated L6 myotubes were treated with [125I]-labeled insulin for 15 min in the indicated pH buffers, and the radioactivities were measured after cells were washed and suspended. The values of radioactivity from at least 6 experiments are shown. The values are shown as the mean ± SEM. aP < 0.05, bP < 0.01 vs pH 7.4. Modified from ref.[46] with allowance of non-profit use of figures.
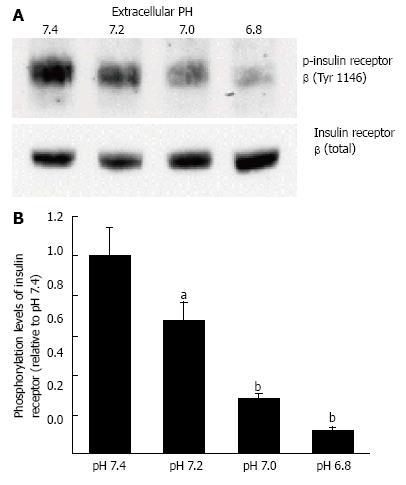
Figure 4 Phosphorylation levels of insulin receptor.
After serum starvation for 4 h, L6 myotubes were treated with 100 nmol/L insulin for 15 min in the buffer with different pH. Total cell lysates were isolated and analyzed by Western blotting with indicated antibodies. A: Representative blots are shown; B: The quantative values of expression of insulin receptor using densitometry from 6 independent experiments using anti-phosphorylated-insulin receptor-β (Tyr 1146) antibody normalized to the level of total insulin receptor compared with that in pH 7.4 buffer. The values are shown as the mean ± SEM (n = 6). aP < 0.05, bP < 0.01 vs pH 7.4. Modified from ref.[46] with allowance of non-profit use of figures.
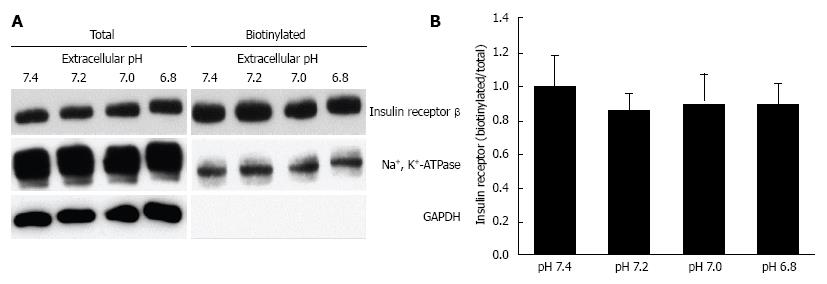
Figure 5 Effects of extracellular pH on the expression of insulin receptor on the plasma membrane.
After serum starved for 4 h, L6 myotubes were treated with 100 nmol/L insulin for 15 min in the HEPES buffer with different pH. Proteins expressed on the plasma membrane were biotinylated and precipitated. A: Representative blots of total expression of insulin receptor on the plasma membrane, the Na+, K+-ATPase, and GAPDH; B: Quantative data of expression of insulin receptor on the plasma membrane at different pH normalized to that at pH 7.4. The results are presented as the mean ± SEM (n = 8). pH had no significant effects on the expression of insulin receptor on the plasma membrane. Modified from ref.[46] with allowance of non-profit use of figures.
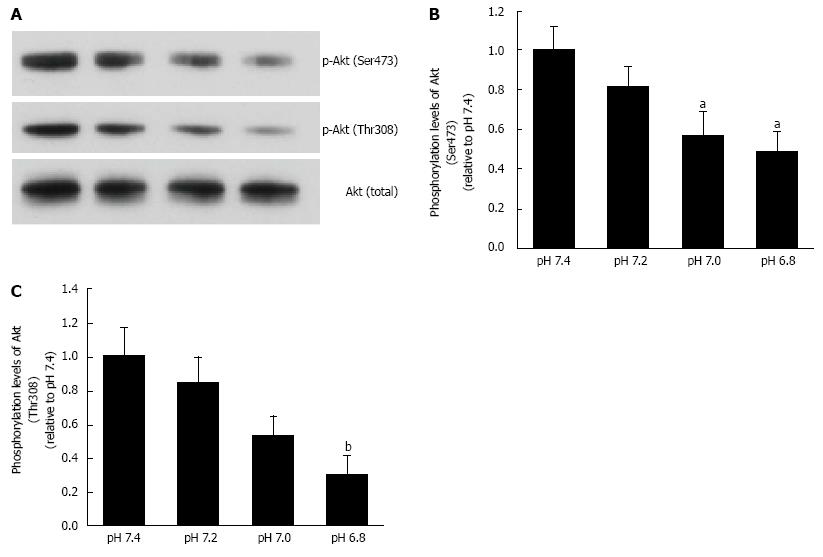
Figure 6 Phosphorylation levels of Akt.
L6 myotubes were treated with 100 nmol/L insulin for 15 min in the buffer with different pH after serum starvation for 4 h. Total cell lysates were isolated, and were analyzed by Western blot with the indicated antibodies. A: Representative blots are shown using anti-phosphorylated (Ser473)-Akt, anti-phosphorylated (Thr308)-Akt, and anti-Akt antibodies. Phosphorylation levels of Ser473 (B) and Thr308 (C) are expressed as normalized values to the level of total Akt compared with those in pH 7.4. The values are shown as the mean ± SEM (n = 6). aP < 0.05, bP < 0.01 vs pH 7.4. Modified from ref.[46] with allowance of non-profit use of figures.
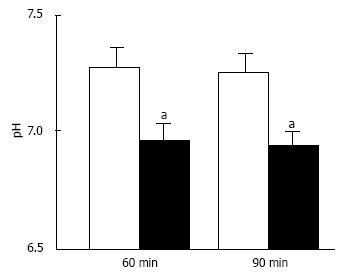
Figure 7 pH of interstitial (extracellular) fluid around the hippocampus of Otsuka Long-Evans Tokushima Fatty and normal (Wistar) rats.
The pH value is shown as the mean ± SEM (n = 4). The pH values shown in Figure 7 were measured at 60 and 90 min after antimony pH electrodes reached interstitial (extracellular) fluids around the hippocampus of the Otsuka Long-Evans Tokushima Fatty rats (closed columns) and normal (Wistar) rats (open columns). aP < 0.05 compared with that in normal (Wistar) rats at each measured time. Modified from ref.[17] with allowance of free use of figures.
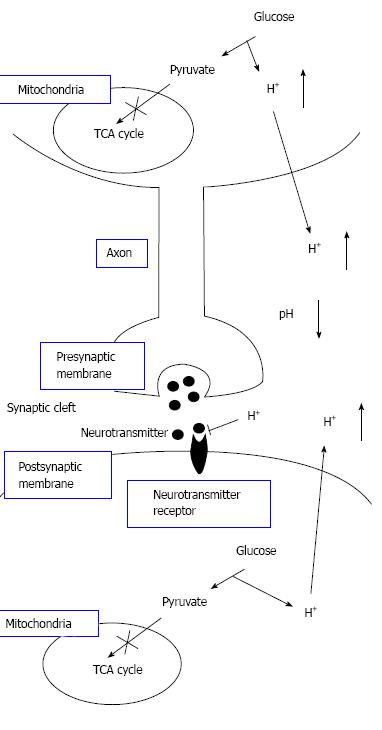
Figure 8 The pH-dependent mechanism of neural cell function in diabetes mellitus with dysfunction of mitochondria.
Neural cells with dysfunction of mitochondria synthesize ATP required for maintenance of neural cell function only or mainly via glycolysis. Thus, neural cells with dysfunction of mitochondria produces much larger amounts of H+ than neural cells with normal function of mitochondria. H+ produced by glycolysis in neural cells with dysfunction of mitochondria[11,18-20] is released to the extracellular space, lowering pH of interstitial fluids[15-17] including the fluids in synaptic clefts. Lowered pH of synaptic cleft fluid diminishes the binding affinity of neurotransmitters to their receptors[67]. Thus, activity of neural cells is diminished at lowered pH of synaptic cleft fluid. Namely, the amount of neurotransmitters released into the synaptic cleft is large enough for generation of action potential under conditions with normal function of mitochondria. However, the amount of neurotransmitters released into the synaptic cleft is insufficient for generation of action potential under conditions with dysfunction of mitochondria, since lowered pH of synaptic cleft diminishes the binding affinity of neurotransmitters to receptors. Modified from ref.[17] with allowance of free use of figures.
- Citation: Marunaka Y. Roles of interstitial fluid pH in diabetes mellitus: Glycolysis and mitochondrial function. World J Diabetes 2015; 6(1): 125-135
- URL: https://www.wjgnet.com/1948-9358/full/v6/i1/125.htm
- DOI: https://dx.doi.org/10.4239/wjd.v6.i1.125


