Copyright
©The Author(s) 2015.
World J Diabetes. Feb 15, 2015; 6(1): 125-135
Published online Feb 15, 2015. doi: 10.4239/wjd.v6.i1.125
Published online Feb 15, 2015. doi: 10.4239/wjd.v6.i1.125
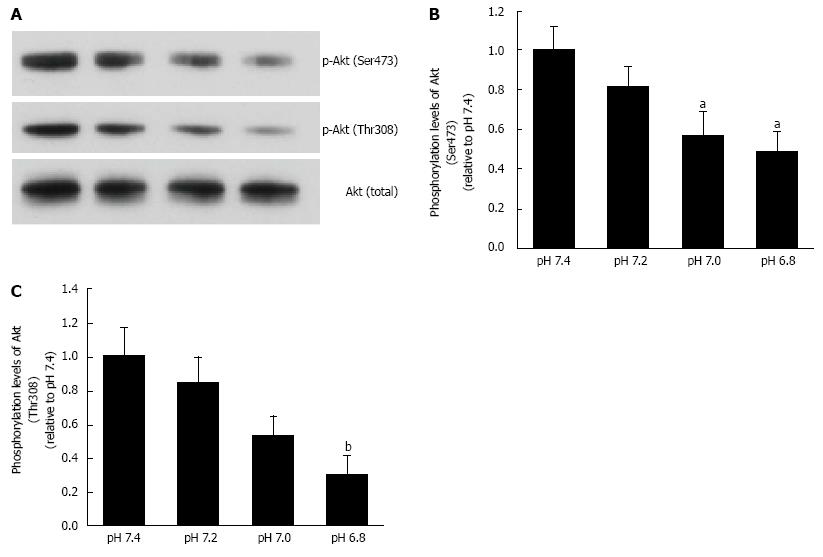
Figure 6 Phosphorylation levels of Akt.
L6 myotubes were treated with 100 nmol/L insulin for 15 min in the buffer with different pH after serum starvation for 4 h. Total cell lysates were isolated, and were analyzed by Western blot with the indicated antibodies. A: Representative blots are shown using anti-phosphorylated (Ser473)-Akt, anti-phosphorylated (Thr308)-Akt, and anti-Akt antibodies. Phosphorylation levels of Ser473 (B) and Thr308 (C) are expressed as normalized values to the level of total Akt compared with those in pH 7.4. The values are shown as the mean ± SEM (n = 6). aP < 0.05, bP < 0.01 vs pH 7.4. Modified from ref.[46] with allowance of non-profit use of figures.
- Citation: Marunaka Y. Roles of interstitial fluid pH in diabetes mellitus: Glycolysis and mitochondrial function. World J Diabetes 2015; 6(1): 125-135
- URL: https://www.wjgnet.com/1948-9358/full/v6/i1/125.htm
- DOI: https://dx.doi.org/10.4239/wjd.v6.i1.125


