Copyright
©The Author(s) 2015.
World J Diabetes. Feb 15, 2015; 6(1): 125-135
Published online Feb 15, 2015. doi: 10.4239/wjd.v6.i1.125
Published online Feb 15, 2015. doi: 10.4239/wjd.v6.i1.125
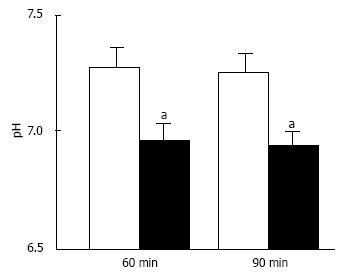
Figure 7 pH of interstitial (extracellular) fluid around the hippocampus of Otsuka Long-Evans Tokushima Fatty and normal (Wistar) rats.
The pH value is shown as the mean ± SEM (n = 4). The pH values shown in Figure 7 were measured at 60 and 90 min after antimony pH electrodes reached interstitial (extracellular) fluids around the hippocampus of the Otsuka Long-Evans Tokushima Fatty rats (closed columns) and normal (Wistar) rats (open columns). aP < 0.05 compared with that in normal (Wistar) rats at each measured time. Modified from ref.[17] with allowance of free use of figures.
- Citation: Marunaka Y. Roles of interstitial fluid pH in diabetes mellitus: Glycolysis and mitochondrial function. World J Diabetes 2015; 6(1): 125-135
- URL: https://www.wjgnet.com/1948-9358/full/v6/i1/125.htm
- DOI: https://dx.doi.org/10.4239/wjd.v6.i1.125


