Copyright
©The Author(s) 2018.
World J Stem Cells. Dec 26, 2018; 10(12): 196-211
Published online Dec 26, 2018. doi: 10.4252/wjsc.v10.i12.196
Published online Dec 26, 2018. doi: 10.4252/wjsc.v10.i12.196
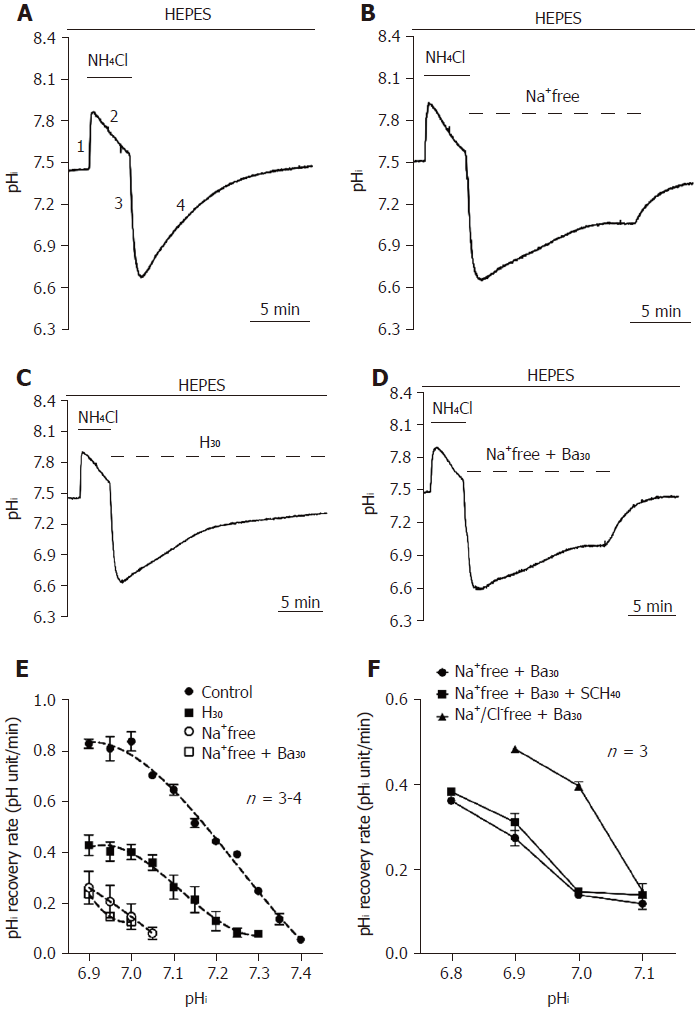
Figure 1 Functional characterization of acid extruders in the HEPES-buffered system.
A-D: The top bar shows the buffer system used in perfusion experiments. The application of NH4Cl and different conditions were respectively shown with the solid and dotted lines above the trace. The trace shown in A showed a typical pHi recovery slope after NH4Cl prepulse-induced intracellular acidosis in HEPES-buffered solution as a control. The traces shown in B-D showed the effect of the removal of extracellular Na+ (Na+-free), addition of 30 μmol/L HOE 694 (H30) and Na+-free + 30 μmol/L bafilomycin A1 (Ba30) on the pHi recovery slope. E: The curve of the pHi recovery rates for Na+-free, H30 and Na+-free with Ba30 were collected from 3-6 similar experiments shown in A-D. F: After pre-treatment with NH4Cl for 5 min, HPS0077 cells were treated with Na+-free + Ba30, Na+-free + Ba30 + 40 μmol/L SCH-28080 (SCH40) and Na+/Cl--free + Na+-free + Ba30 in HEPES-buffered solution, and the change in pHi was detected by a multimode reader. Error bars represent the mean ± SE.
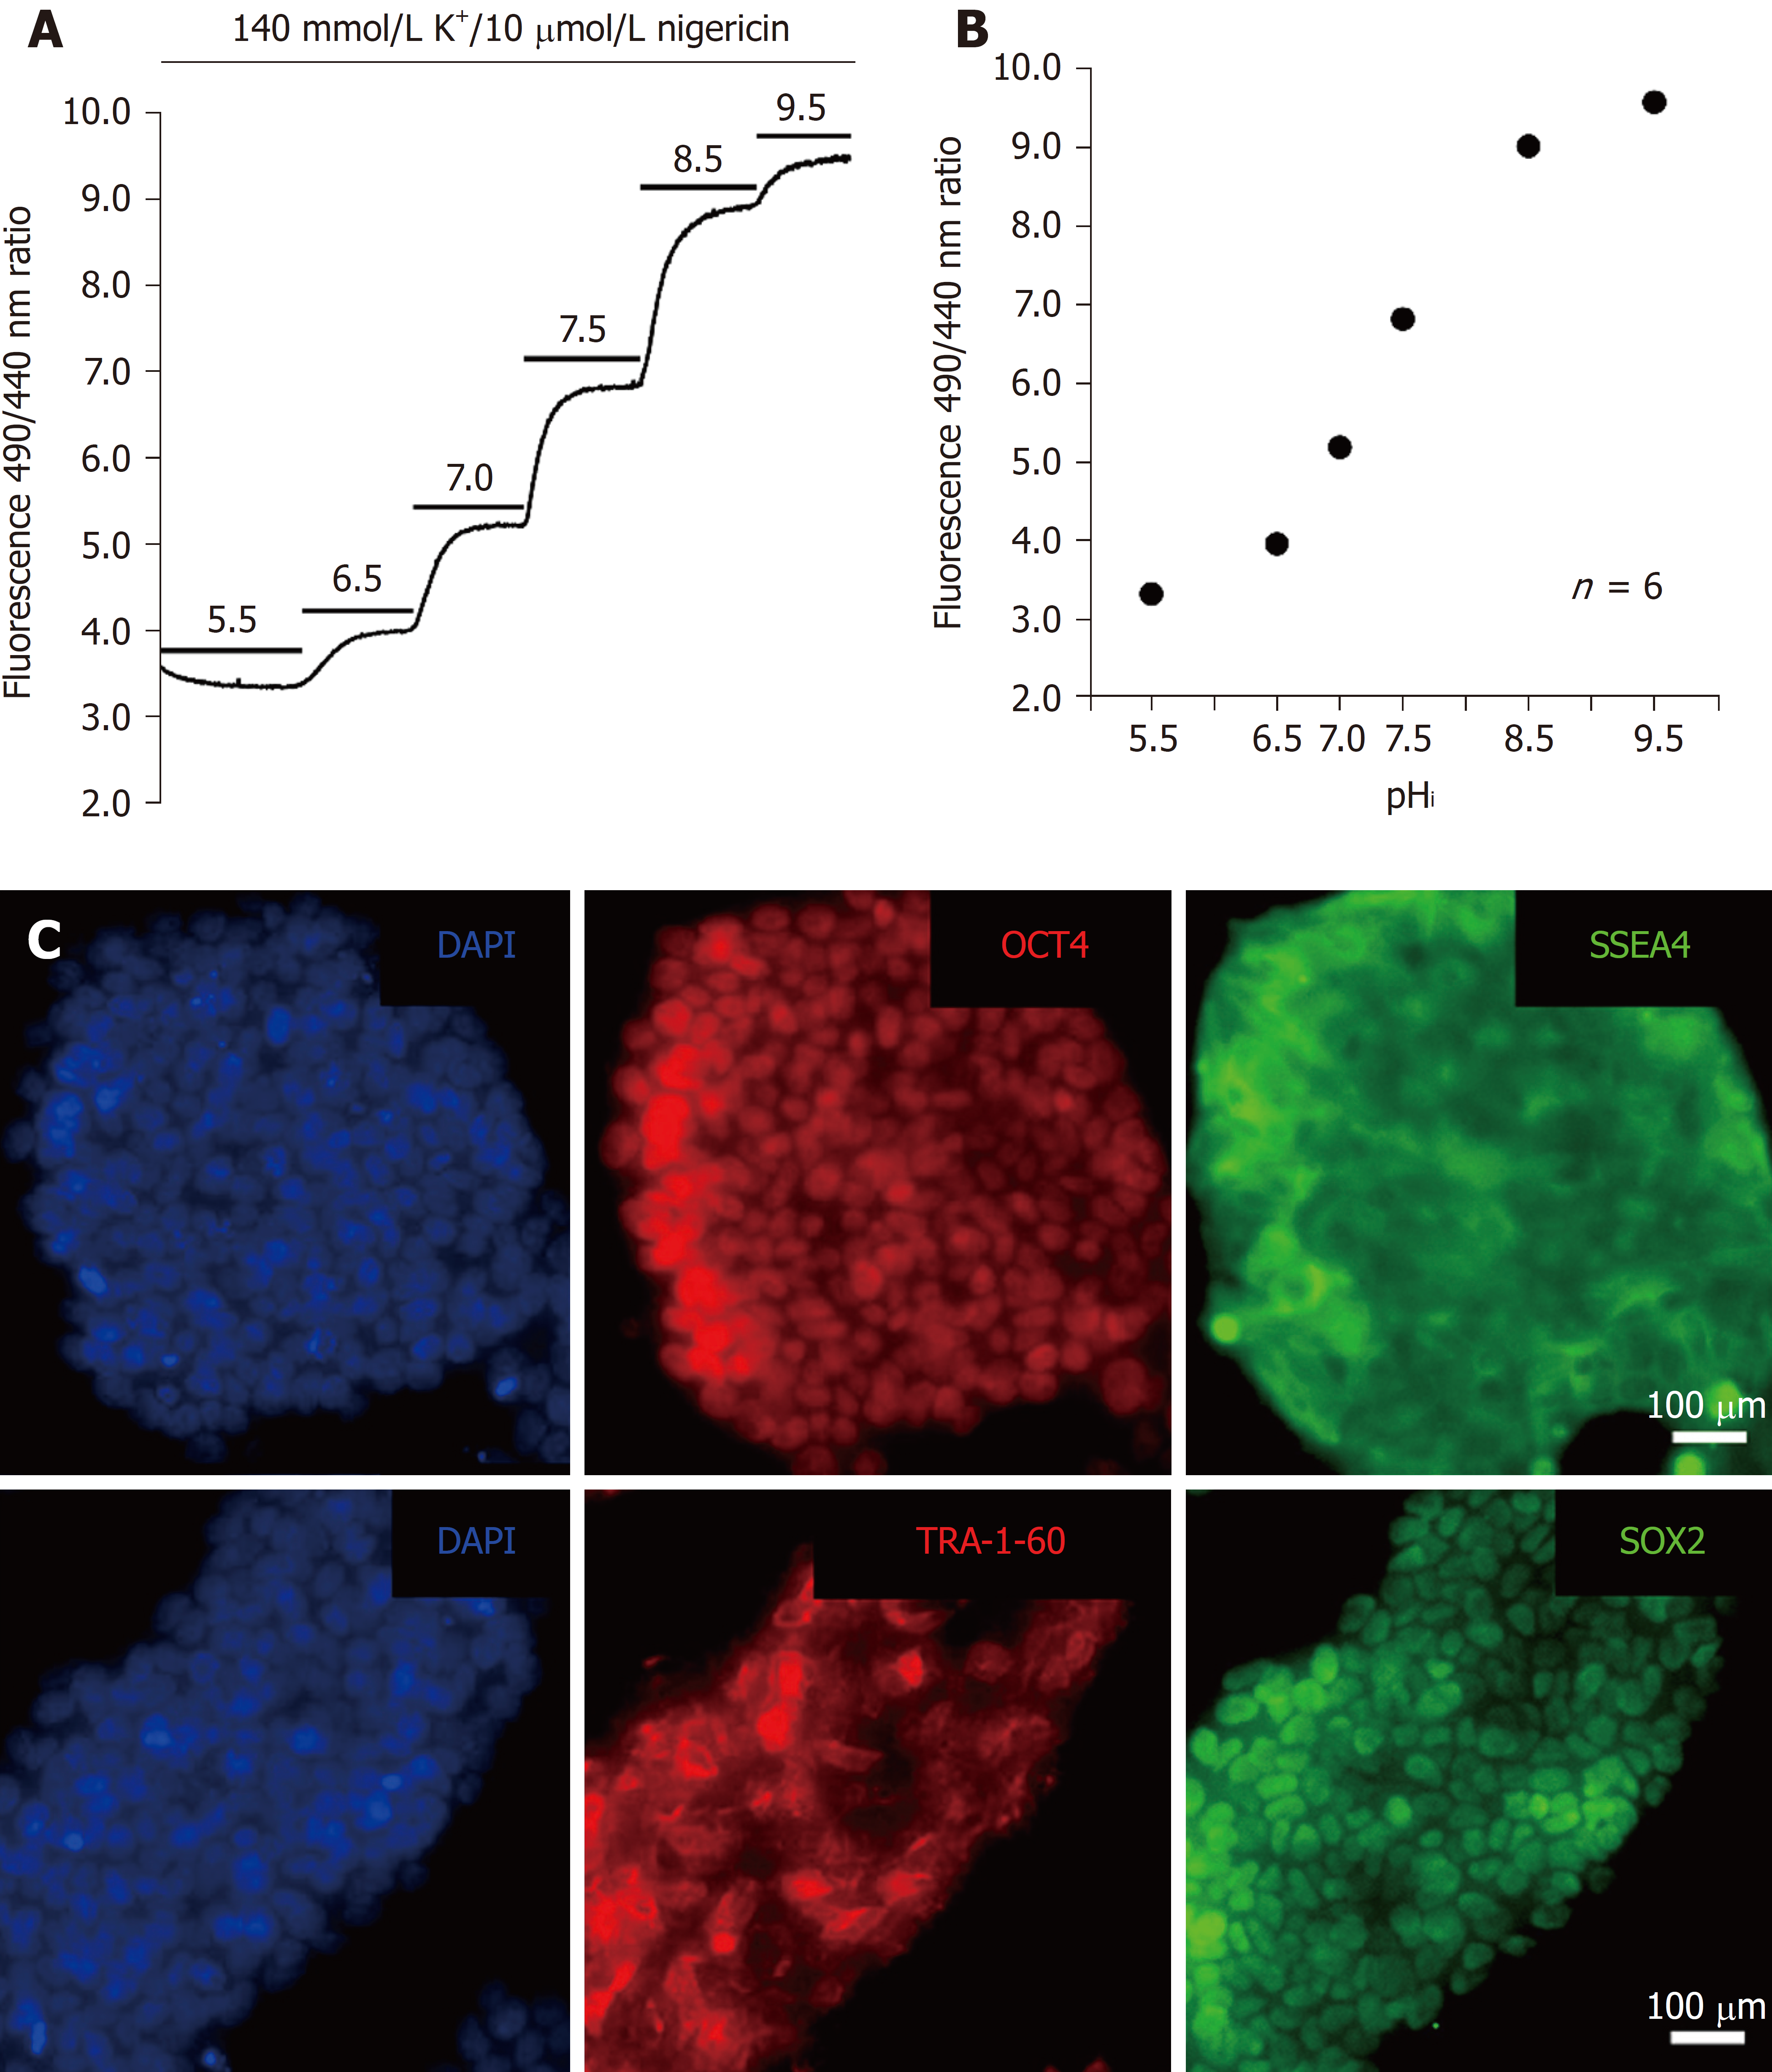
Figure 2 Calibration of the BCECF fluorescence ratio and pluripotency characterization.
A: The trace showed the protocol of BCECF fluorescence ratio (510 nm emission at 490 nm and 440 nm excitations) calibration in HPS0077 cells. The top bars represent the application of different conditions; B: The plots of pHivs the BCECF fluorescence ratio were collected from 6 similar experiments shown in A; C: Immunofluorescence analysis showed the expression of pluripotency markers, OCT4, SSEA4, TRA-1-60 and SOX2, in HPS0077 cells.
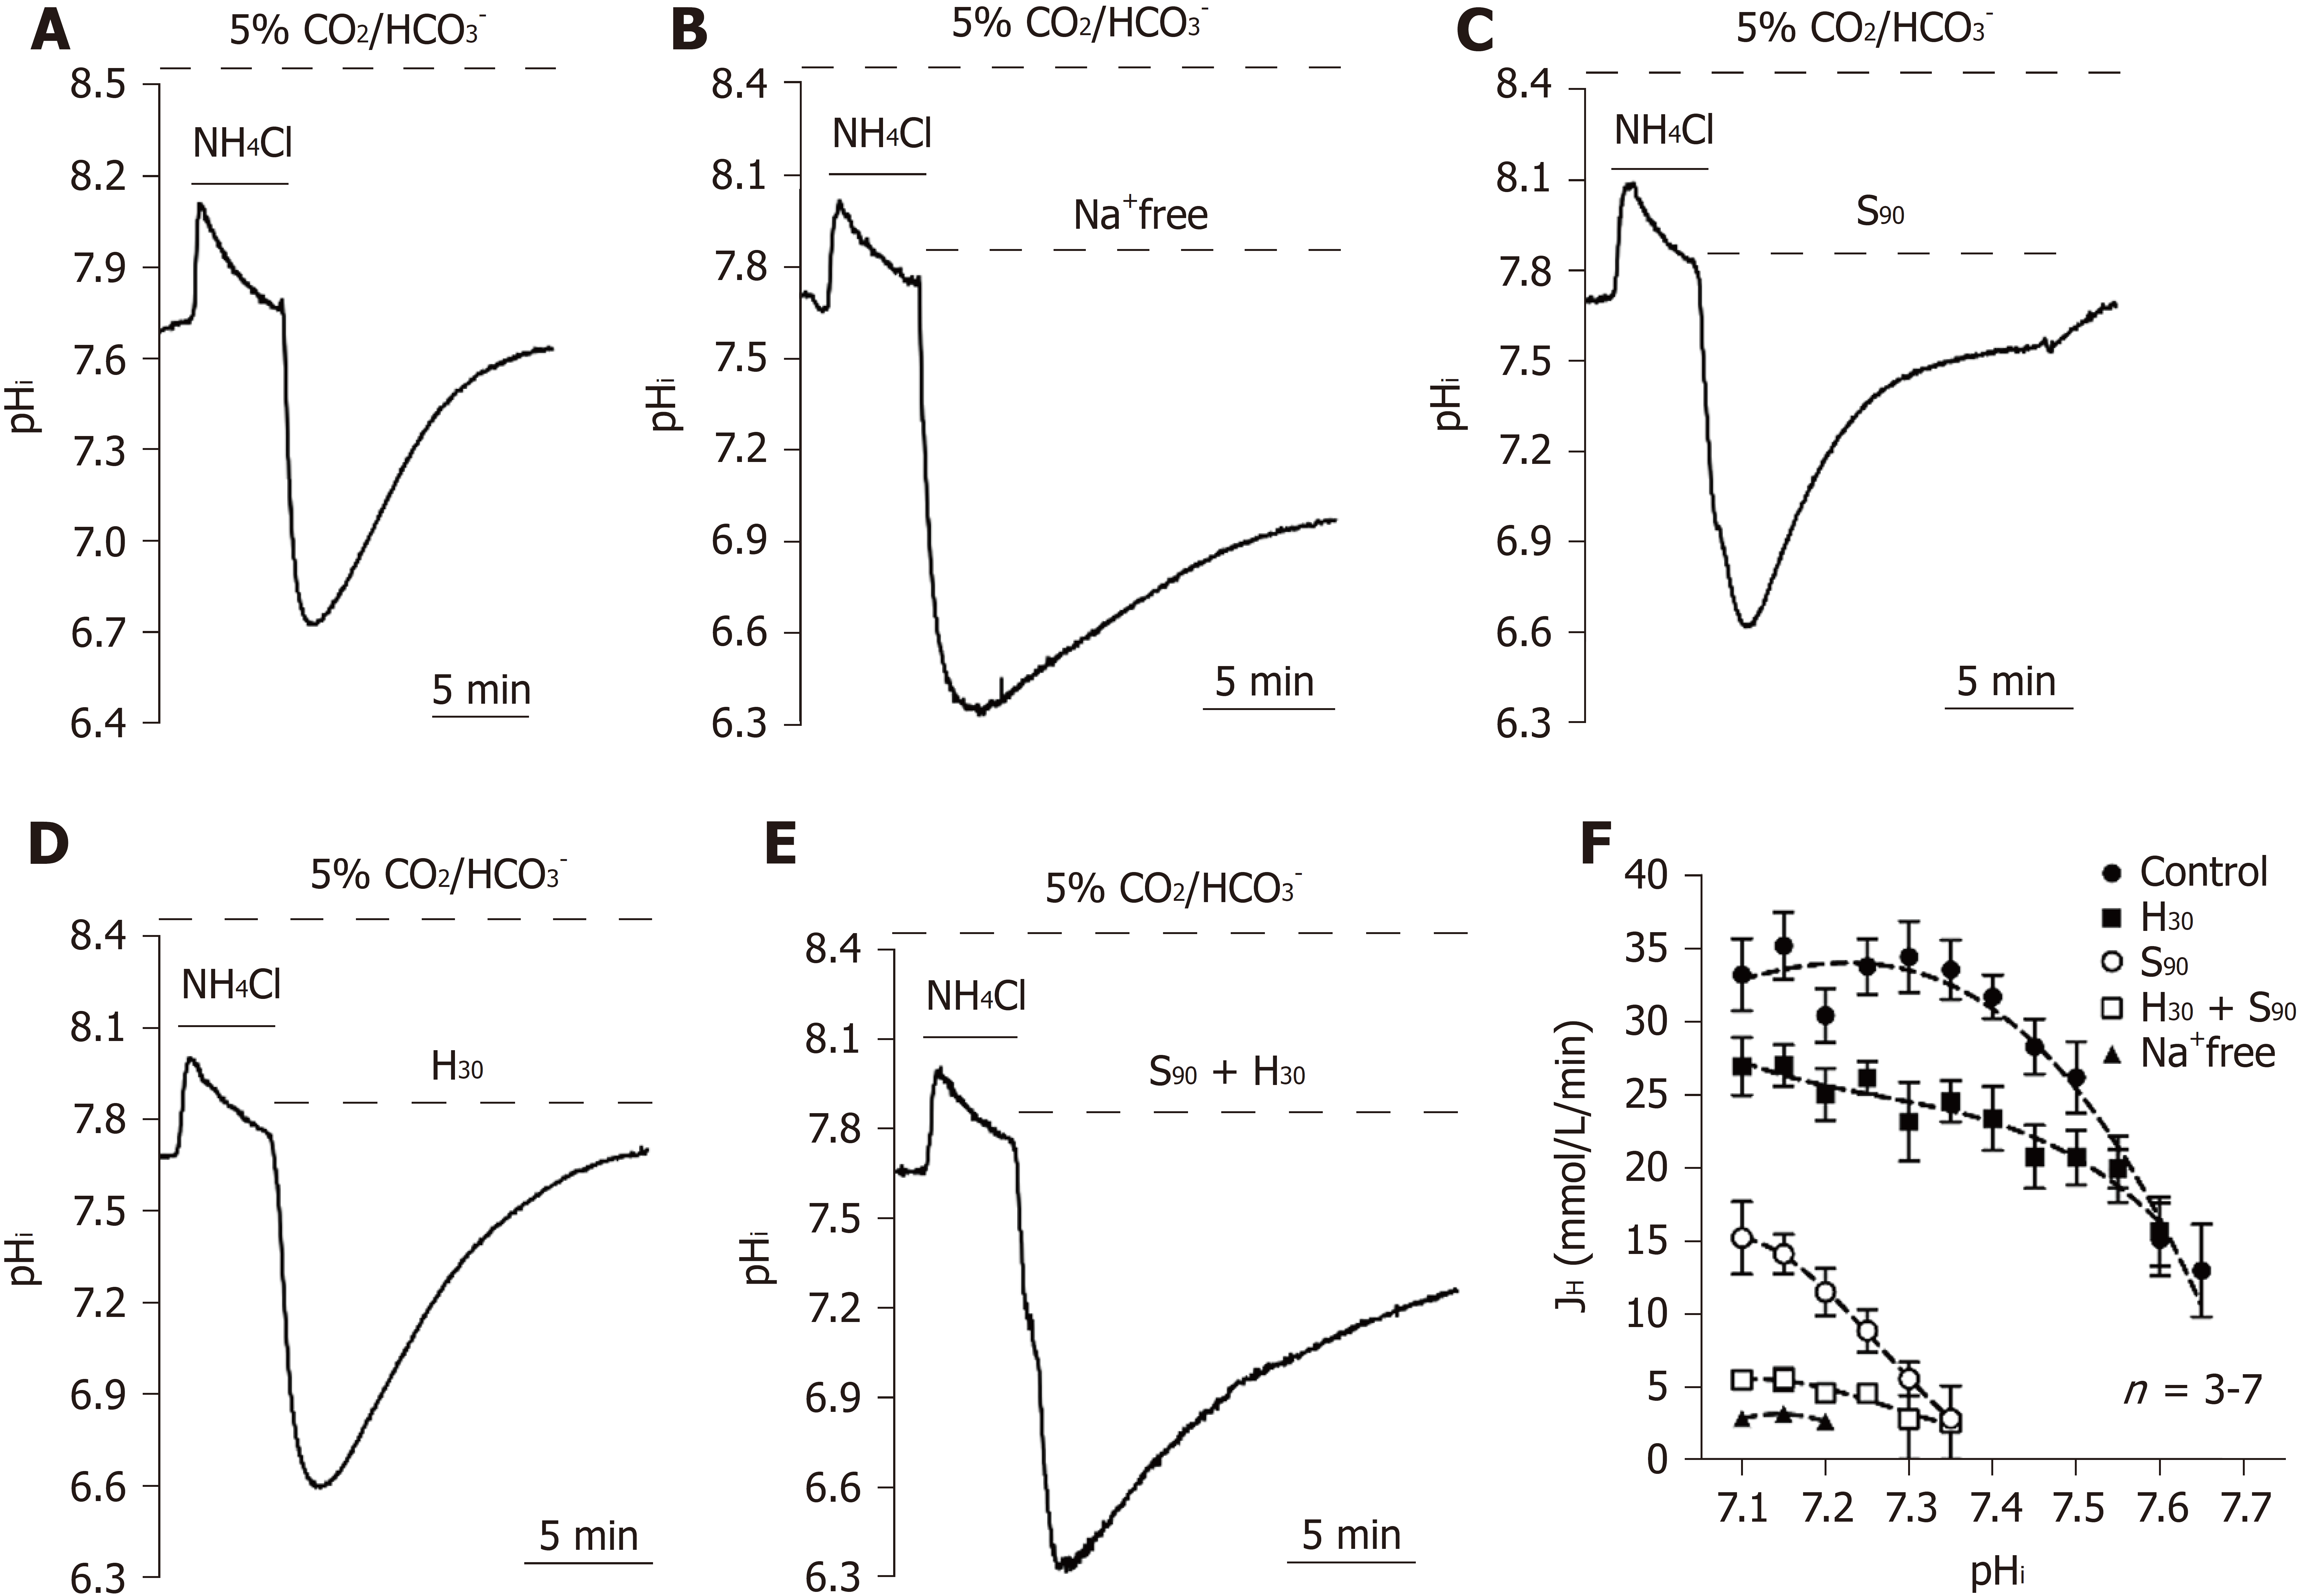
Figure 3 Functional characterization of acid extruders in the 5% CO2/HCO3--buffered system.
A-E: The trace shown in A showed a typical pHi recovery slope after NH4Cl prepulse-induced intracellular acidosis in HEPES-buffered solution as a control. The traces shown in B-E showed the effect of the removal of extracellular Na+ (Na+-free), addition of 90 μmol/L S0859 (S90), addition of 30 μmol/L HOE 694 (H30) and addition of S90 + H30 on the pHi recovery slope; F: The curve of the pHi recovery rates after the addition of Na+-free, S90, H30 and S90 + H30 were collected from 2-10 similar experiments shown in A-E. Error bars represent the mean ± SE.
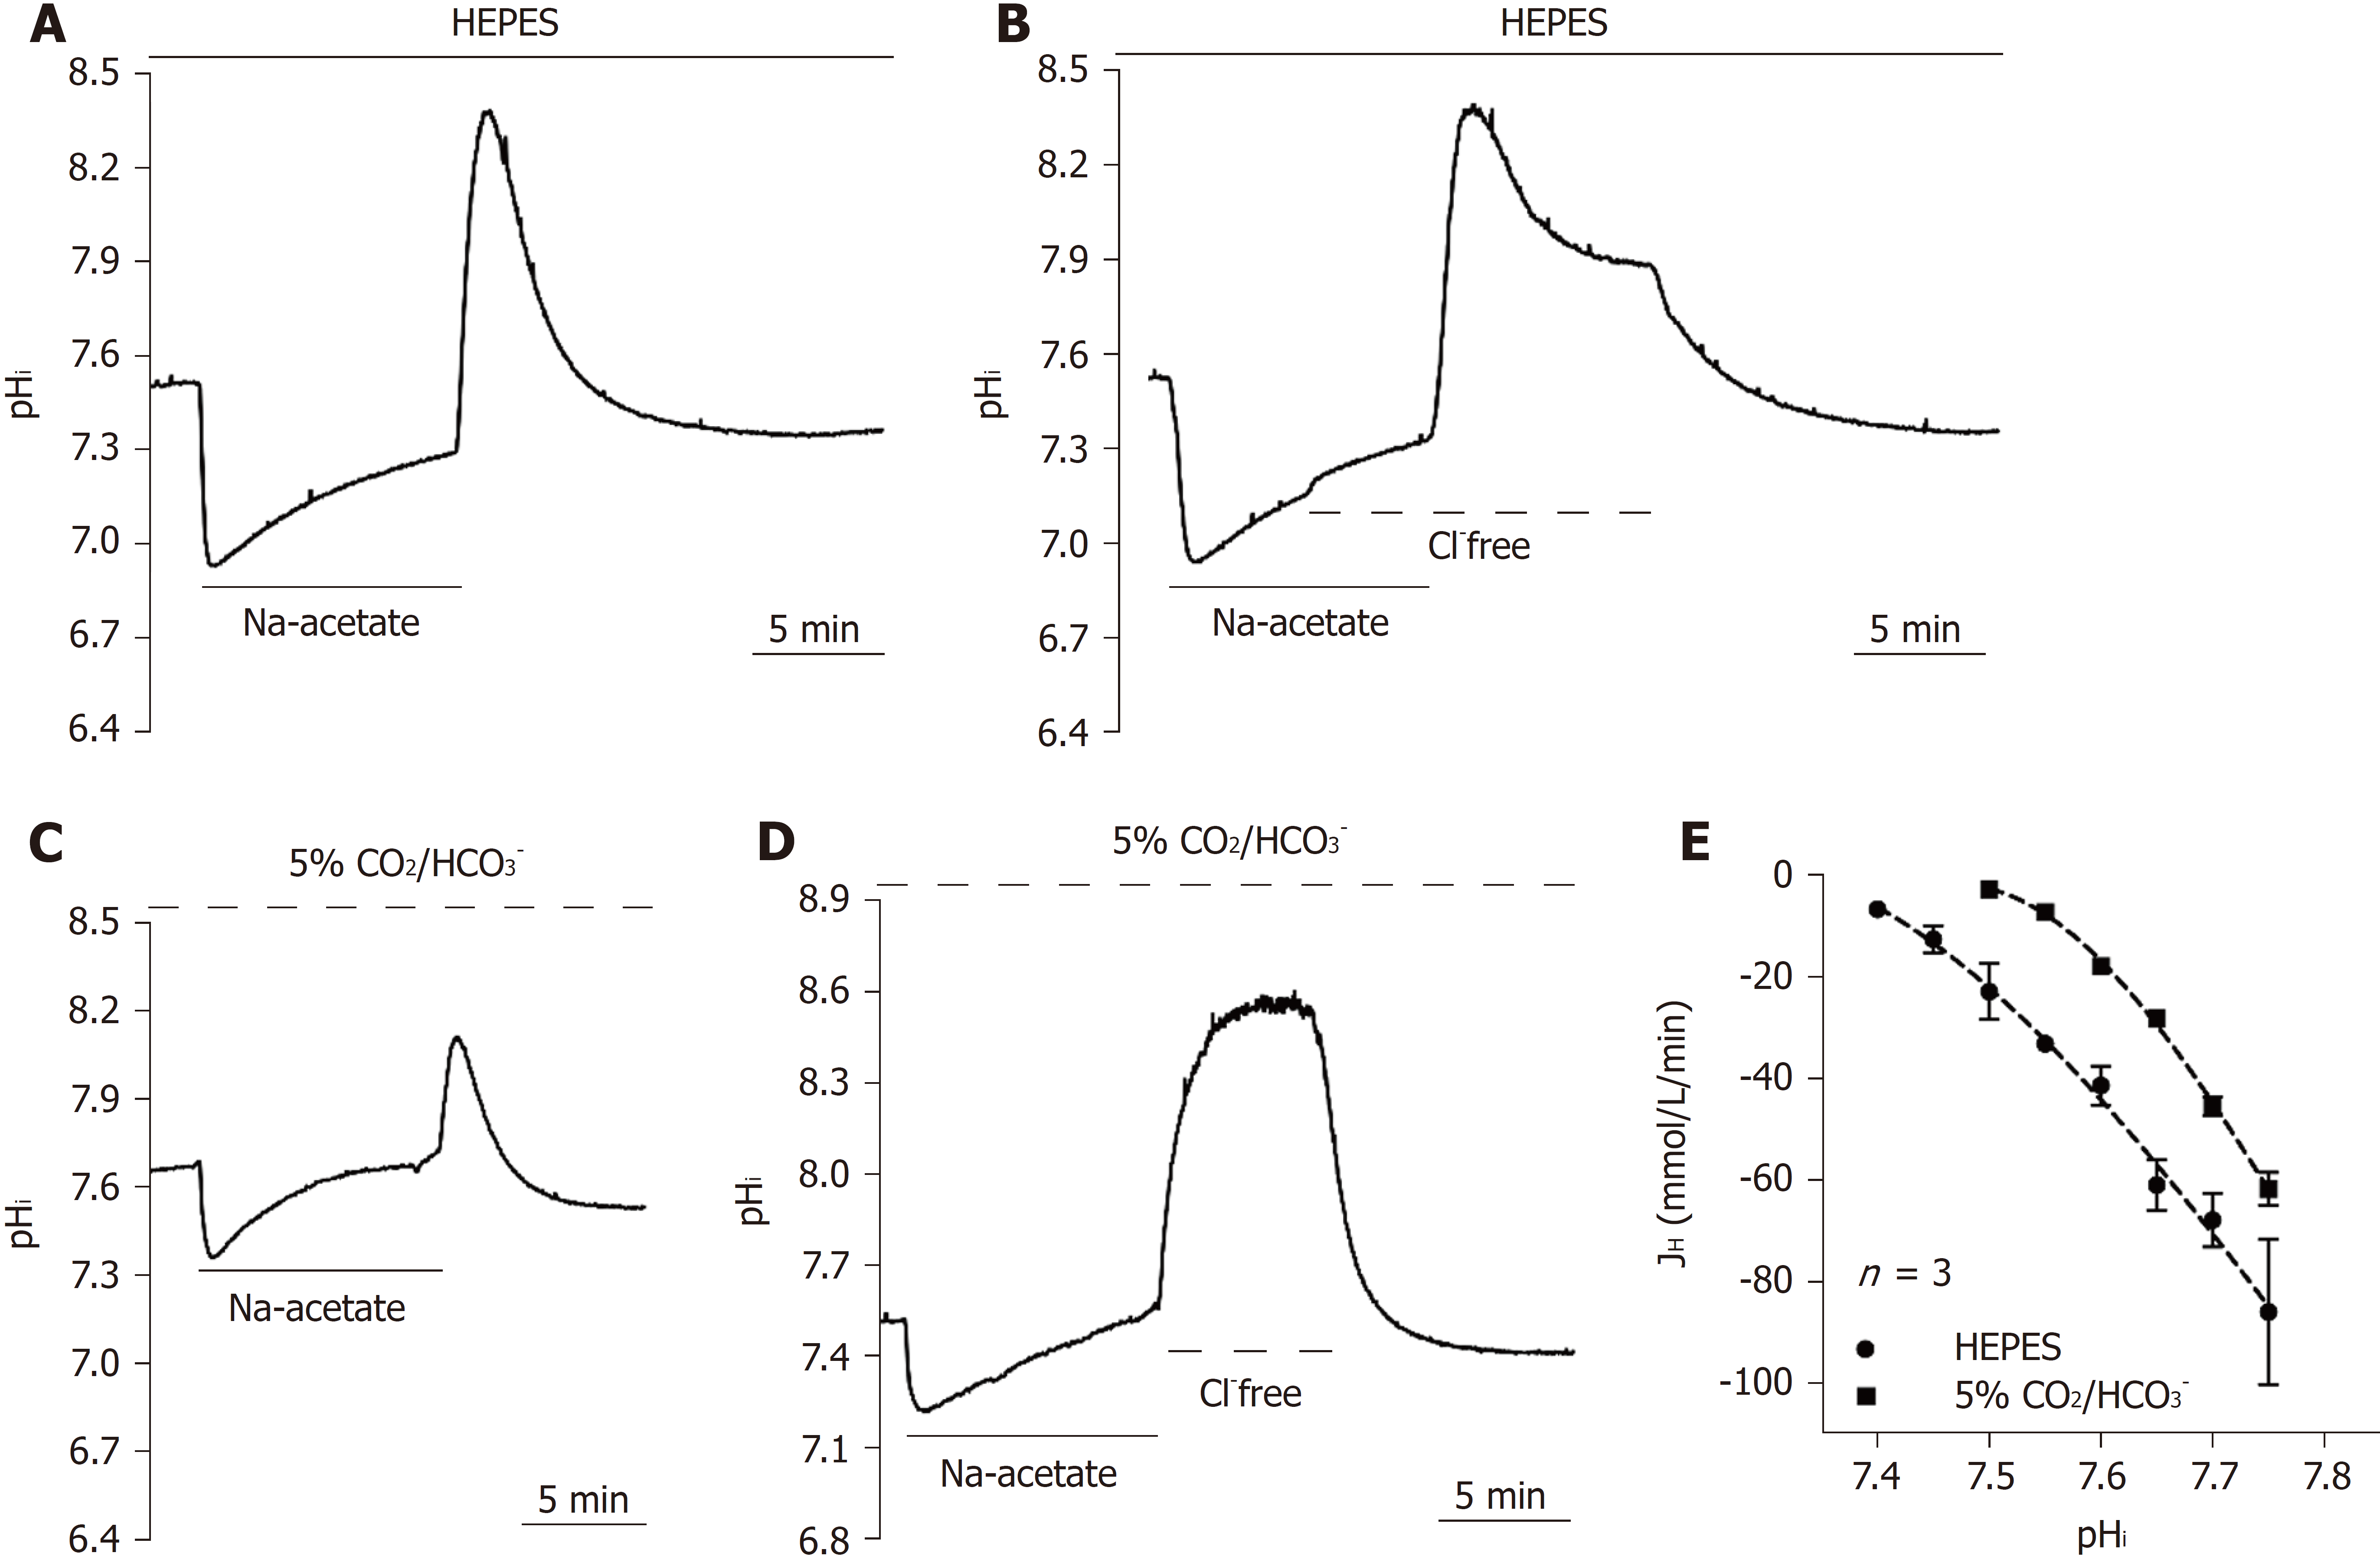
Figure 4 Functional characterization of the acid loader.
A-D: The traces shown in A and C showed typical pHi recovery slopes after Na-acetate prepulse-induced intracellular alkalization in HEPES and 5% CO2/HCO3--buffered solution as a control. The traces shown in B and D showed the effect of the removal of extracellular Cl- (Cl--free) on the pHi recovery slope in HEPES and 5% CO2/HCO3--buffered solution; E: The curve of the pHi recovery rates in HEPES and 5% CO2/HCO3--buffered solution were collected from 3-4 similar experiments shown in A and C. Error bars represent the mean ± SE.
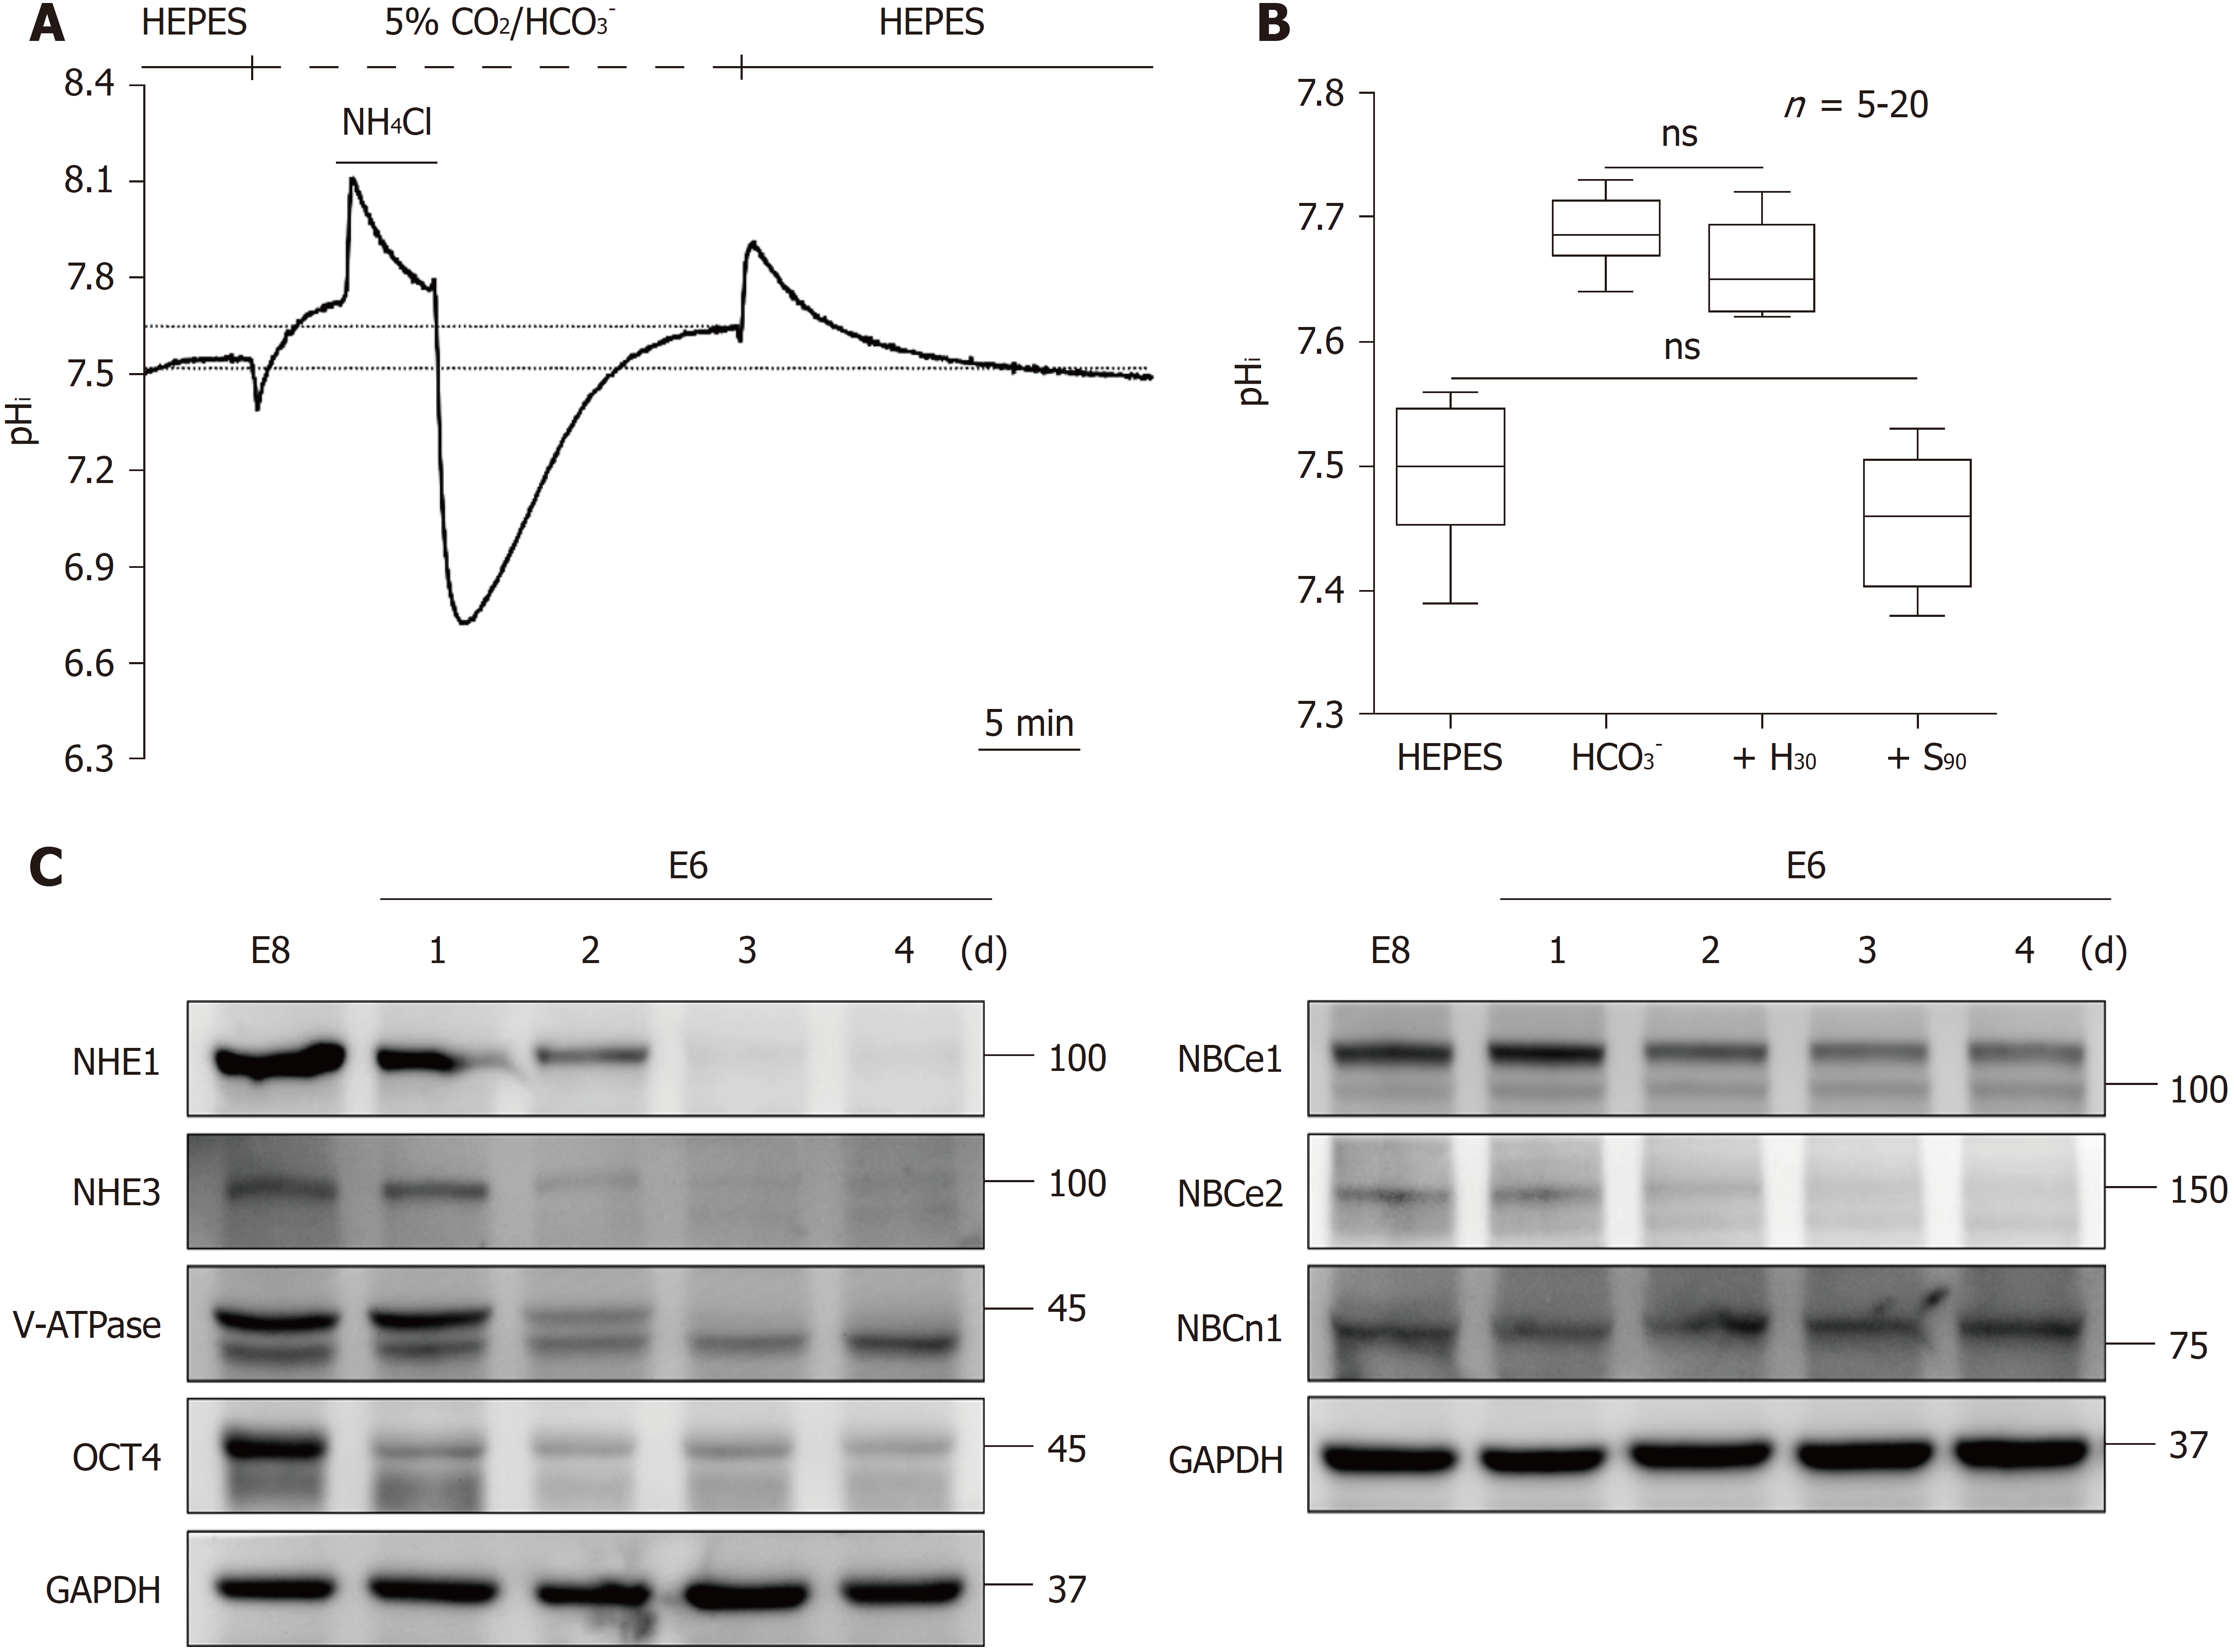
Figure 5 Steady-state pHi in HEPES and 5% CO2/HCO3--buffered solution and the change in the expression of pHi regulators during the loss of pluripotency in human induced pluripotent stem cells.
A: The resting pHi was a steady-state taken from the completely recovered pHi after intracellular acidification or alkalization. The dotted line indicates the value of the resting pHi; B: The max/min chart of the resting pHi in hiPSCs was collected from A (n = 20) and Figures 4C and D (n = 5). The means of the resting pHi in HEPES and 5% CO2/HCO3--buffered solution were found to be 7.50 ± 0.01 and 7.68 ± 0.01, respectively. After treatment with H30 and S90 in 5% CO2/HCO3--buffered solution, the resting pHi shifted to 7.66 ± 0.02 and 7.46 ± 0.02, respectively; C: Immunoblot analysis of the expression of NHE1, NHE3, V-ATPase, NBCe1, NBCe2, NBCn1 and OCT4 in hiPSCs in different culture media for different days (E8 and E6-1d to E6-4d). The histograms in B display the mean and the min to max values. hiPSCs: Human induced pluripotent stem cells; NHE: The Na+/H+ exchanger; NBC: The Na+/HCO3- cotransporter; V-ATPase: Vacuolar-ATPase.
Figure 6 The change in the activity of the Na+/H+ exchanger and the Na+/HCO3- cotransporter and the resting pHi during the loss of pluripotency in human induced pluripotent stem cells.
A: The traces showed the changes in pHi recovery after NH4Cl prepulse-induced intracellular acidification in E8 medium (containing fibroblast growth factor 2, FGF2, and transforming growth factor β1, TGFβ1) and E6 medium (without FGF2 and TGFβ1) for 1 to 4 d (E6-1d to E6-4d) in HEPES-buffered solution; B: The charts showed the pHi recovery rate in E6-1d to -4d normalized to the rate in E8 (% of E8) in HEPES-buffered solution, which was estimated at pHi = 6.9 and 7.2, respectively, and averaged for 3 experiments similar to that shown in A; C: The max/min plots showed the resting pHi in E8, E6-1d, E6-2d, E6-3d and E6-4d media that were averaged from similar experiments shown in A (n = 5-20); D: The traces showed the changes in pHi recovery after NH4Cl prepulse-induced intracellular acidification in E8 and E6-1d to E6-4d media in 5% CO2/HCO3--buffered solution; E: The graphs show the pHi recovery rate in E6-1d to E6-4d normalized to the rate in E8 (control) in 5% CO2/HCO3--buffered solution, which was estimated at pHi = 6.9, 7.2 and 7.5, respectively, and averaged for 3 experiments similar to that shown in D; F: The max/min plots showed the resting pHi in E8 E6-1d, E6-2d, E6-3d and E6-4d media, averaged from similar experiments shown in D (n = 5-20). Error bars represent the mean ± SE. The histograms in C and F show the mean and min to max values. NS: No significant difference; hiPSCs: Human induced pluripotent stem cells.
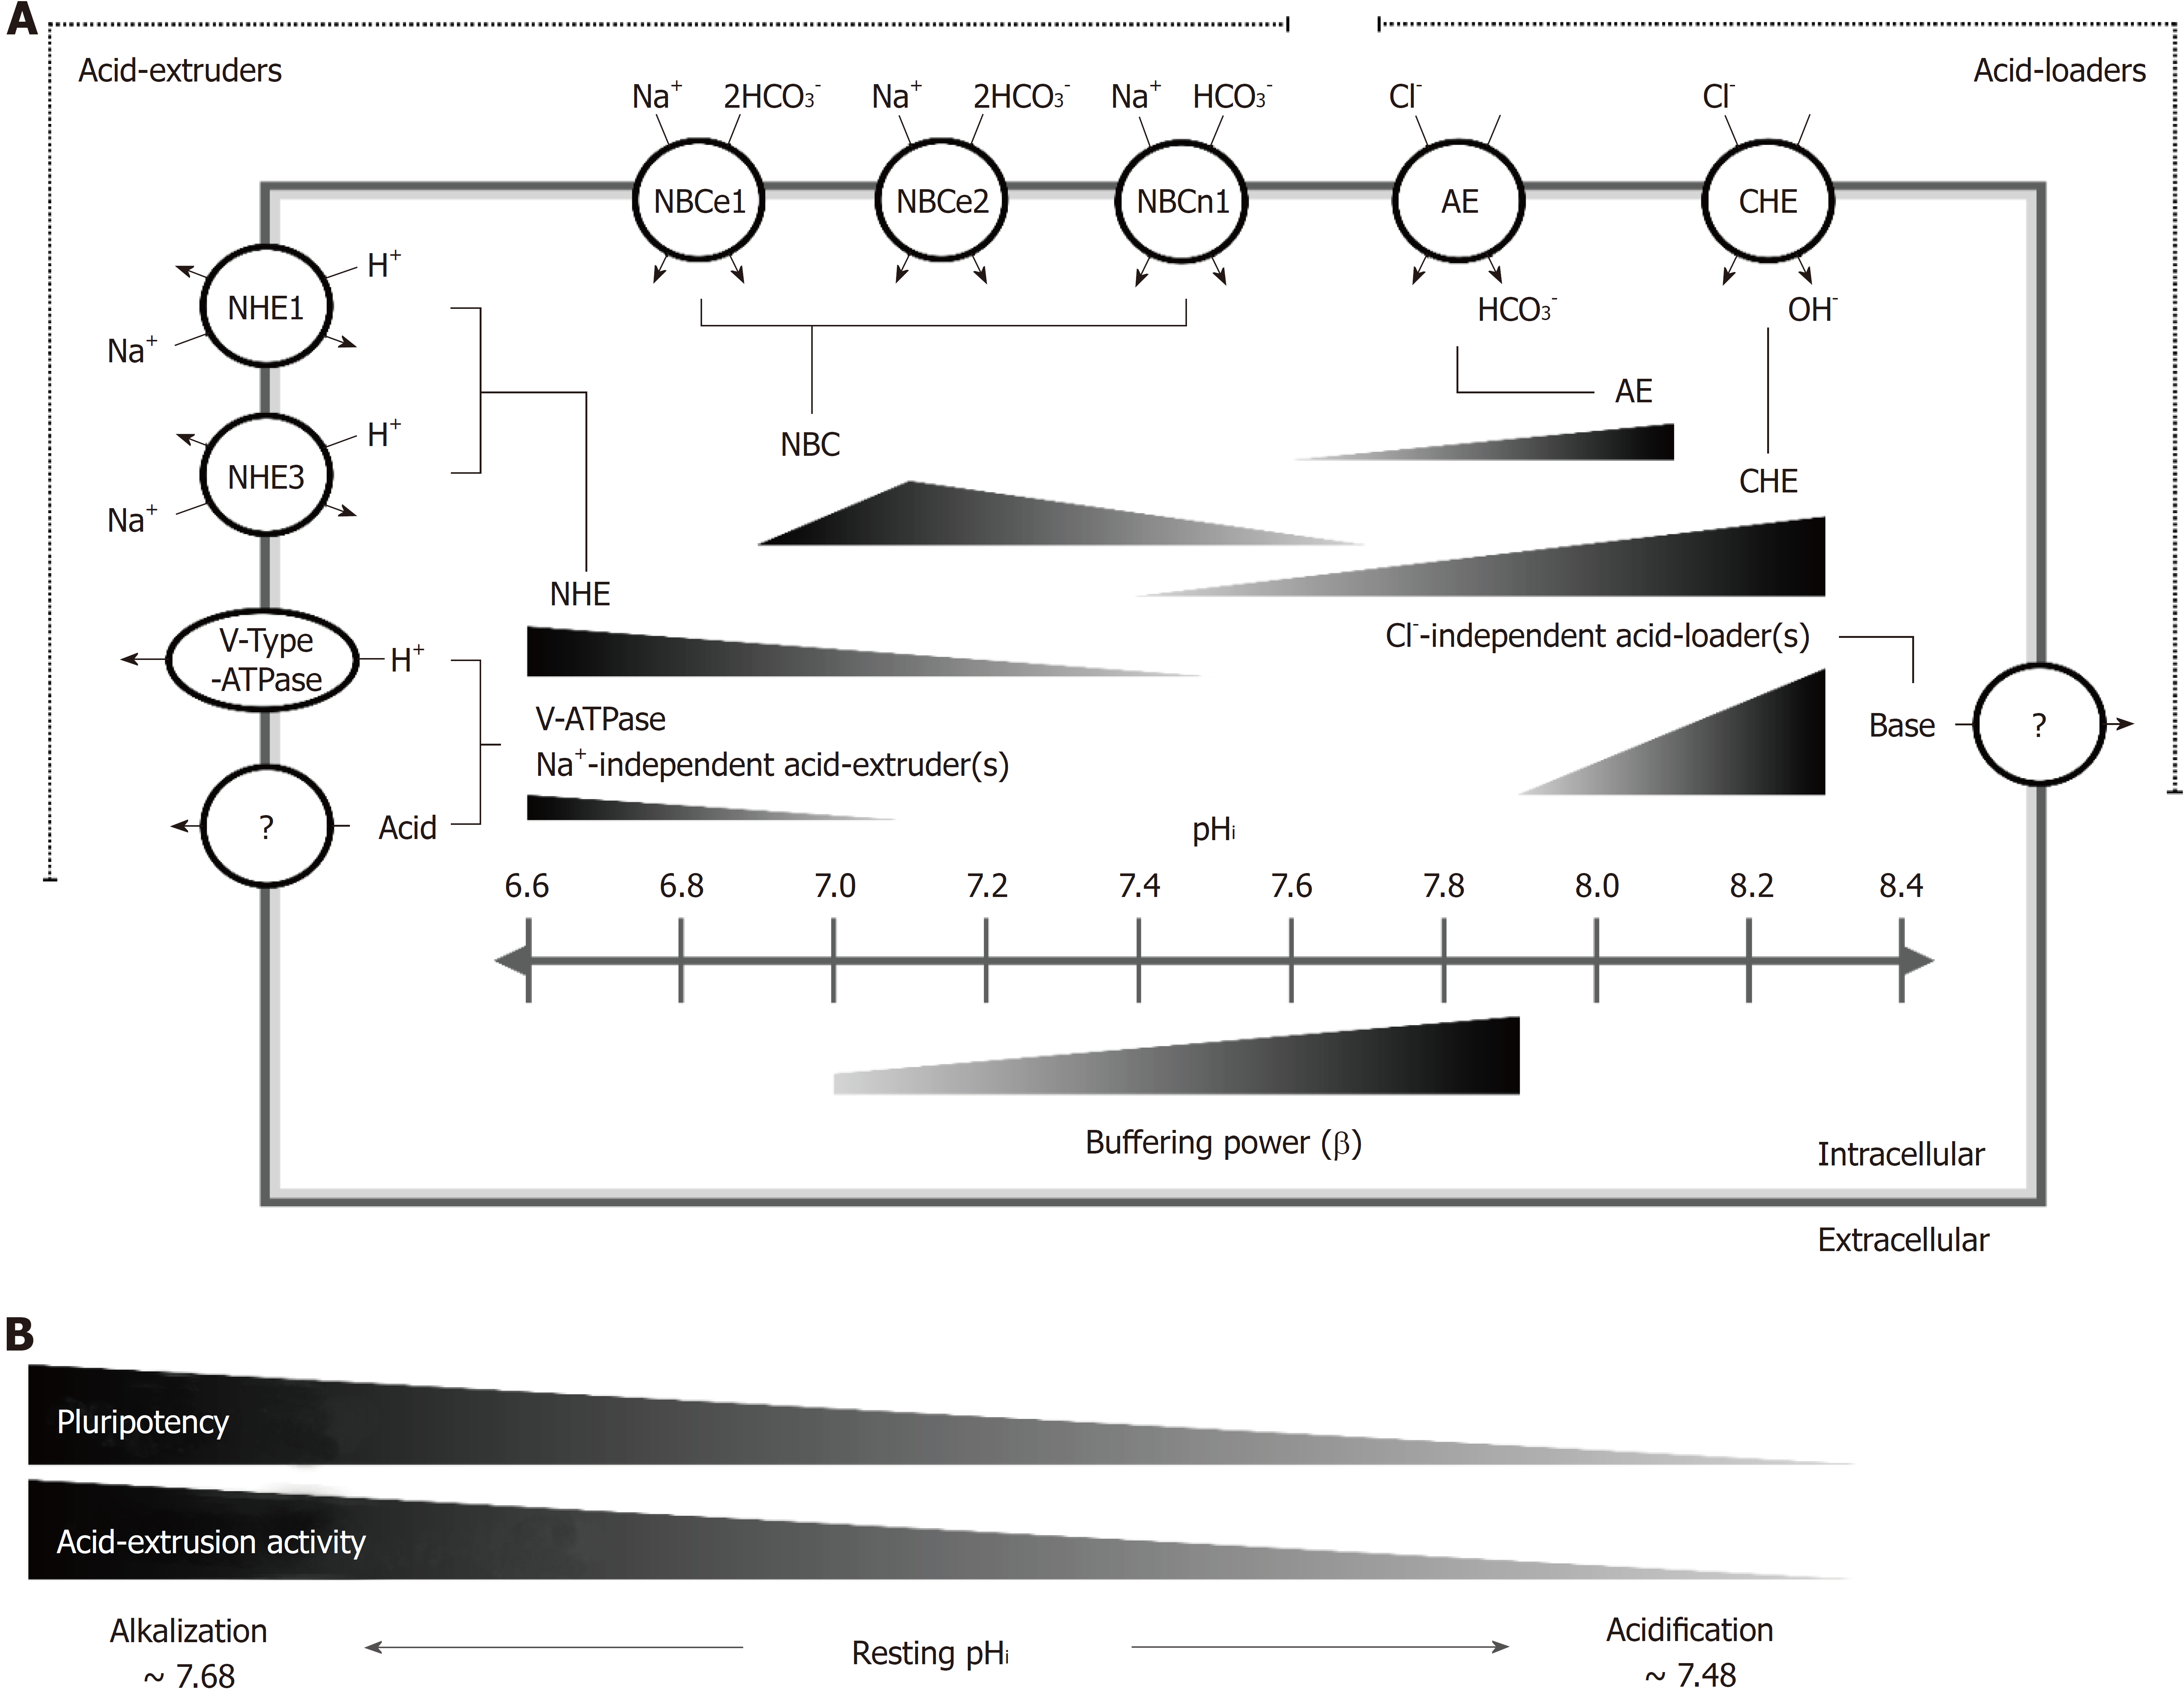
Figure 7 Kinetic model of the pHi regulatory mechanism in human induced pluripotent stem cells.
A: A kinetic model illustrating the pHi regulatory mechanism in HPS0077 cell, including acid extrusion, acid loading and passive buffering power. For the first time, we demonstrated that the active membrane pHi regulators NHE1, NHE3, V-ATPase, NBCe1, NBCe2, NBCn1, AE and CHE functionally coexisted in hiPSCs, and in addition, unknown Na+-independent acid extruder(s) and Cl--independent acid loader(s) were also observed. The length of the triangle indicates the pHi range of pHi regulator activation, and the height indicates the magnitude of the pHi regulatory activity. For example, the NHE, NBC, AE and CHE were activated at pHi ≤ 7.5, between 6.9 and 7.68, ≥ 7.4 and between 7.6 and 8.1, respectively. The non-NHE acid extruders [V-ATPase, unknown Na+-independent acid extruder(s)] and unknown Cl--independent acid loader(s) were activated during extreme intracellular acidification, i.e., pHi < 7.1, and alkalization, i.e., pHi > 7.9, respectively. Moreover, the intracellular passive buffering capacity (β) increased as the pHi shifted to the alkalization direction; B: In the process of the loss of pluripotency, the activity of the acid extrusion mechanism gradually decreased, including the participation of at least the NHE, the NBC and V-ATPase, and resulted in the resting pHi shifting from 7.68 to 7.48. hiPSCs: Human induced pluripotent stem cells; NHE: The Na+/H+ exchanger; NBC: The Na+/HCO3- cotransporter; V-ATPase: Vacuolar-ATPase; AE: Anion exchanger; CHE: Cl--OH- exchanger.
- Citation: Chao SC, Wu GJ, Huang SF, Dai NT, Huang HK, Chou MF, Tsai YT, Lee SP, Loh SH. Functional and molecular mechanism of intracellular pH regulation in human inducible pluripotent stem cells. World J Stem Cells 2018; 10(12): 196-211
- URL: https://www.wjgnet.com/1948-0210/full/v10/i12/196.htm
- DOI: https://dx.doi.org/10.4252/wjsc.v10.i12.196


