Copyright
©The Author(s) 2019.
World J Gastroenterol. Jul 14, 2019; 25(26): 3408-3425
Published online Jul 14, 2019. doi: 10.3748/wjg.v25.i26.3408
Published online Jul 14, 2019. doi: 10.3748/wjg.v25.i26.3408
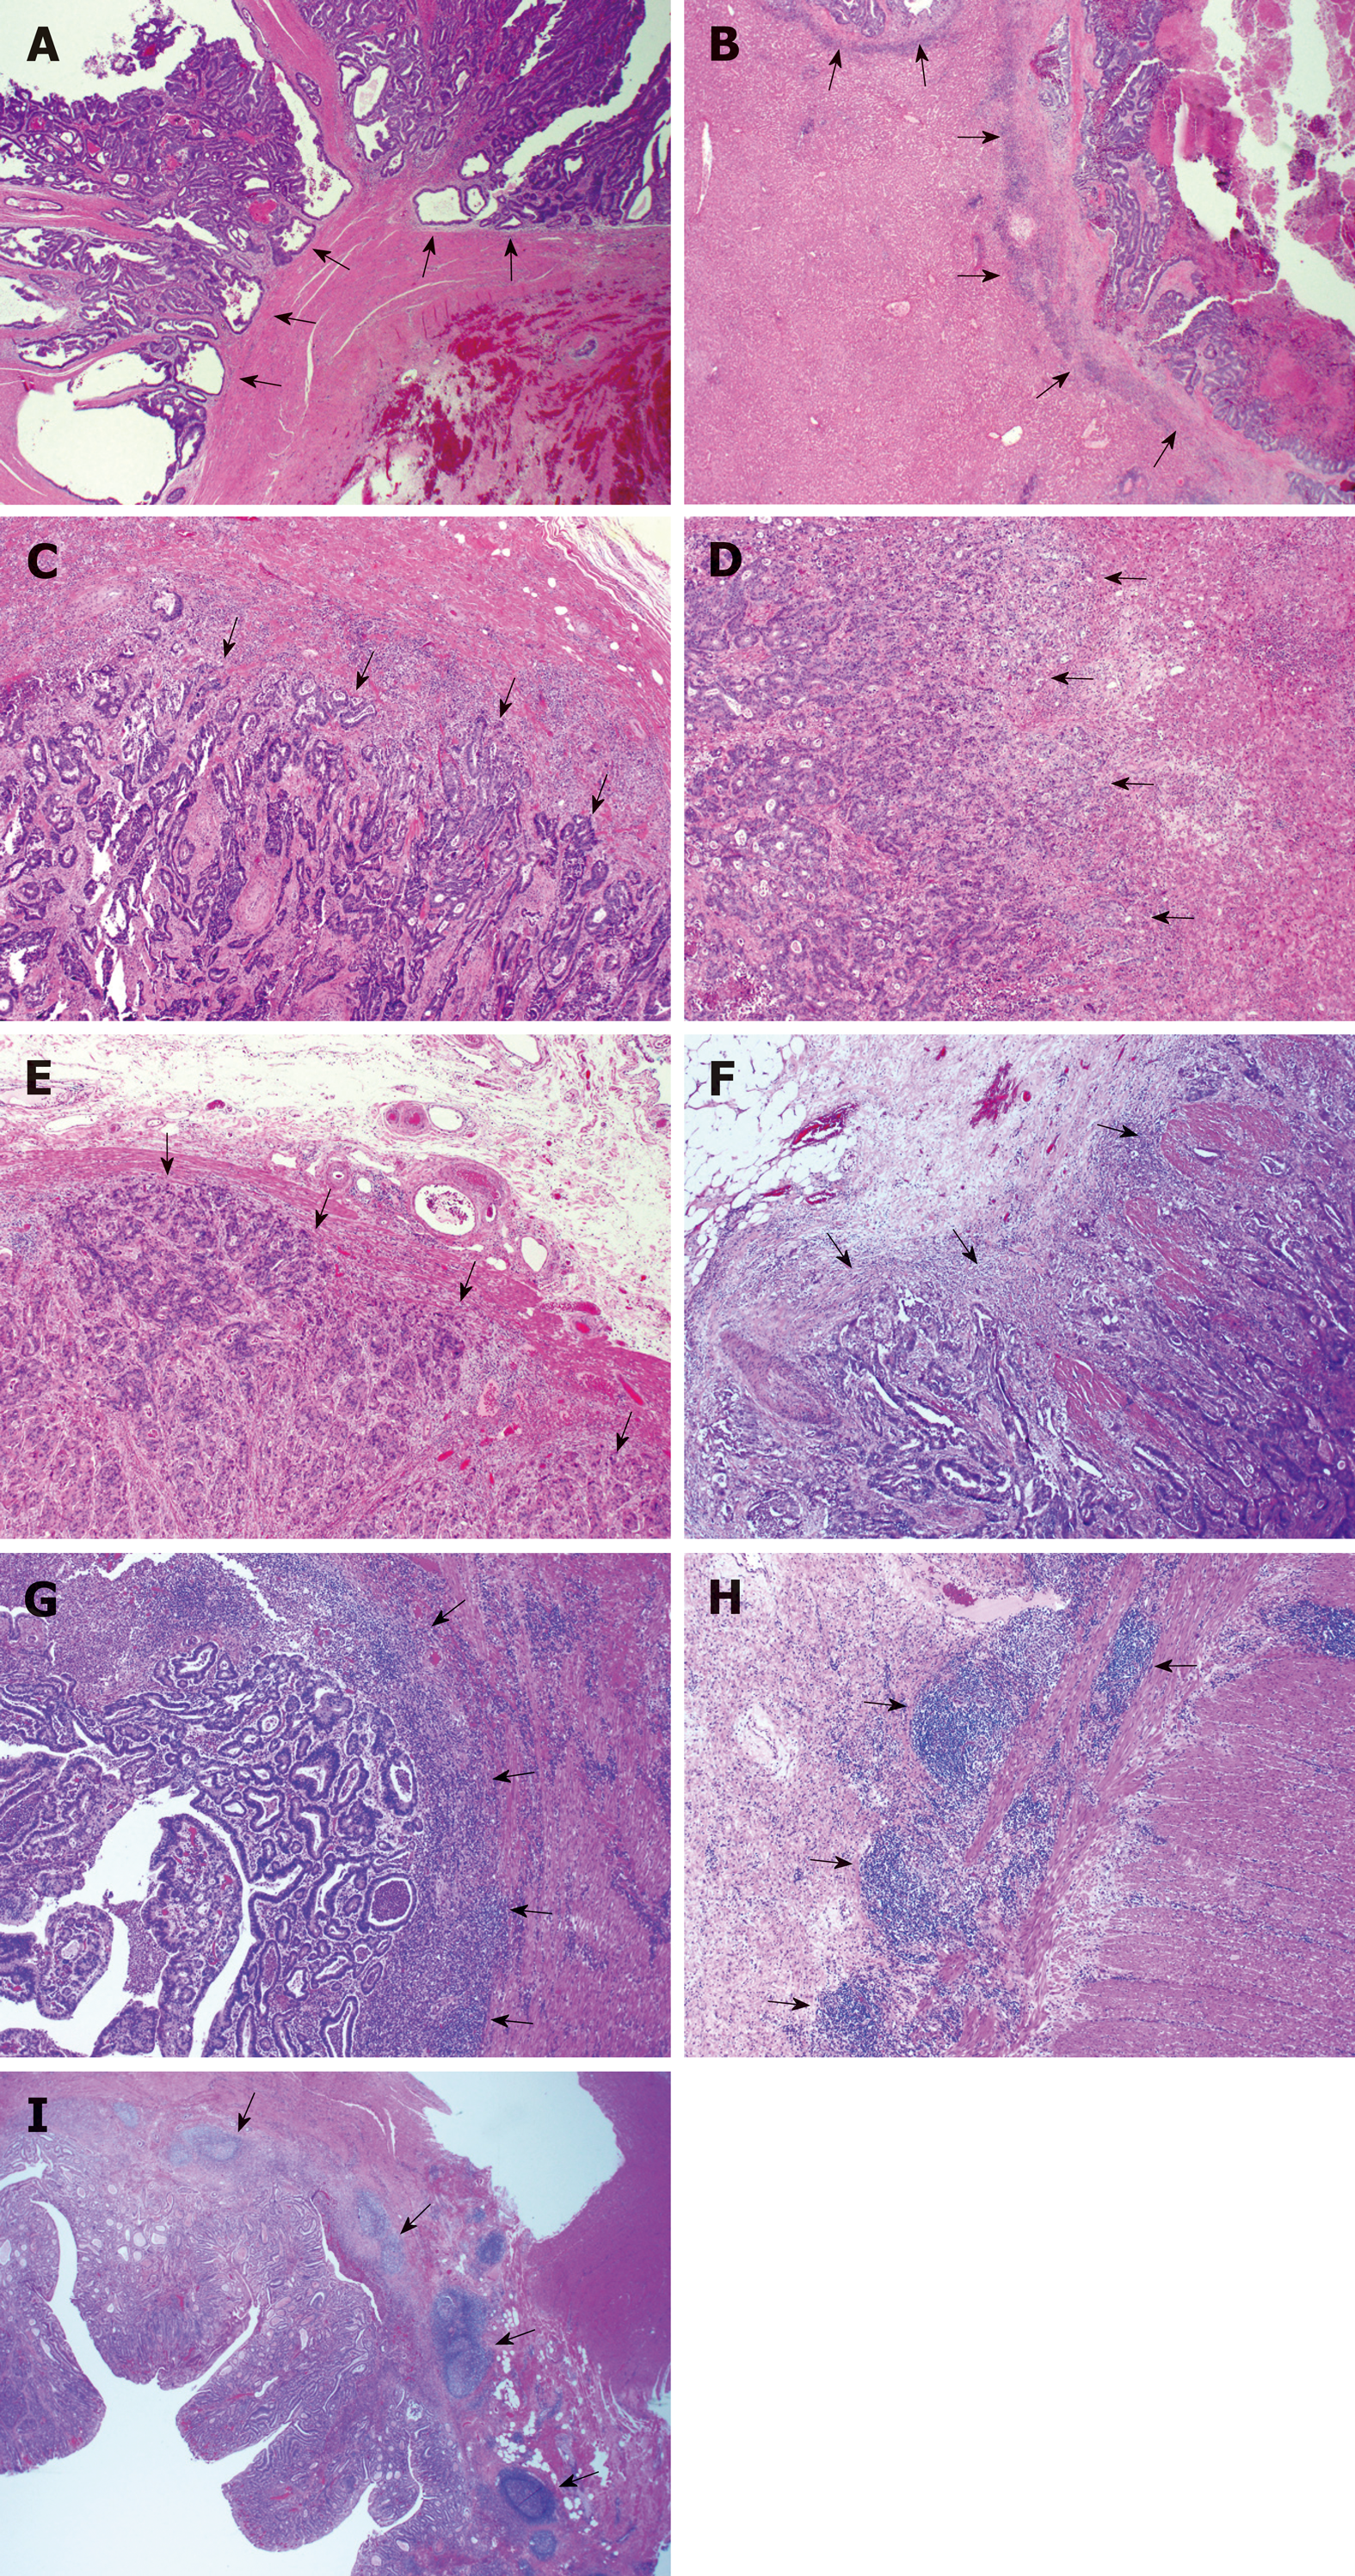
Figure 1 Representative histological images of the growth pattern of primary colorectal carcinoma and liver metastasis.
A: Primary colorectal carcinoma (CRC) with an expanding growth pattern where the tumor gland pushes the surrounding stroma with a sharper dividing interface (arrows show expanding growth pattern); B: Liver metastasis with a desmoplastic growth pattern showing a stroma band separating the tumor with the surrounding liver parenchyma (arrows show desmoplastic growth pattern), the same case as A; C: Primary CRC with an infiltrating growth pattern where streams of tumor cells permeate into the stroma with an irregular interface (arrows show infiltrating growth pattern); D: Liver metastasis with a replacement growth pattern showing tumors cells in direct contact with hepatocytes and grow into the liver cell plate (arrows show replacement growth pattern), the same case as C; E: Negative inflammatory cell band (ICB) negative. There is no lymphocyte infiltration at the tumor-normal tissue interface, as arrows show; F: Low grade ICB. Lymphocyte infiltration is present in less than 50% tumor-normal tissue interface, as arrows show; G: High grade ICB. Lymphocyte infiltration is present in more than 50% tumor-normal tissue interface, as arrows show; H: Positive Crohn’s disease-like response (CDR) showing lymphoid aggregates at the deeper aspects of the bowl wall (arrows show aggregated lymphoid tissue); I: Positive CDR showing lymphoid aggregates at the mucosal-submucosal junction (arrows show aggregated lymphoid tissue).
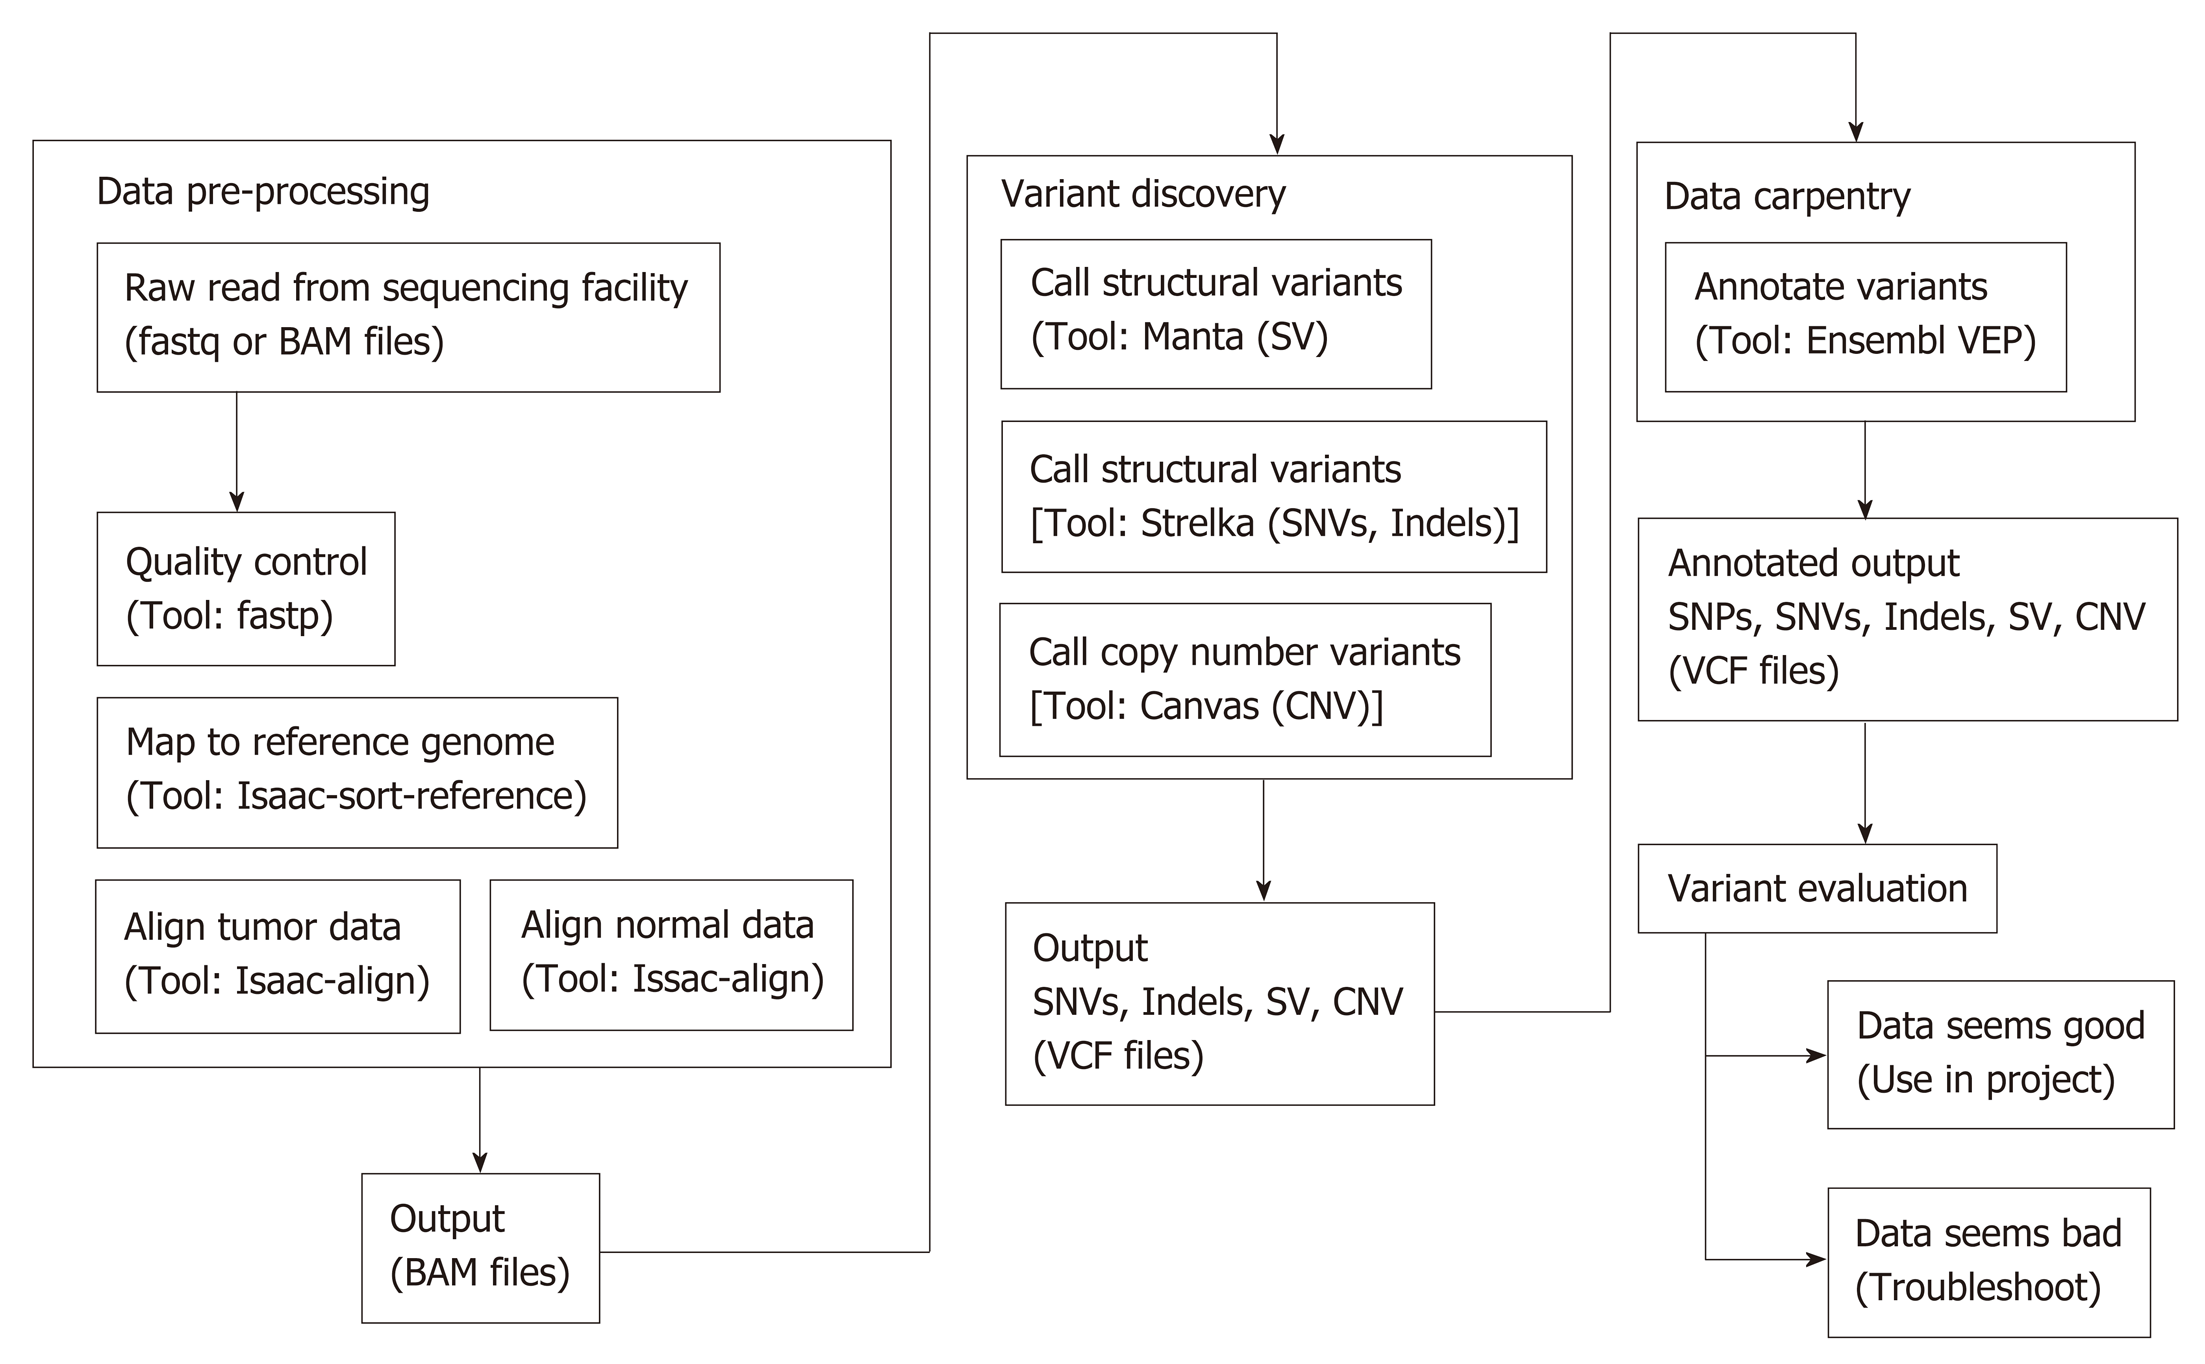
Figure 2 Work flow of whole exome sequencing bioinformatics analysis.
SV: Structural variant; CNV: Copy number variant.
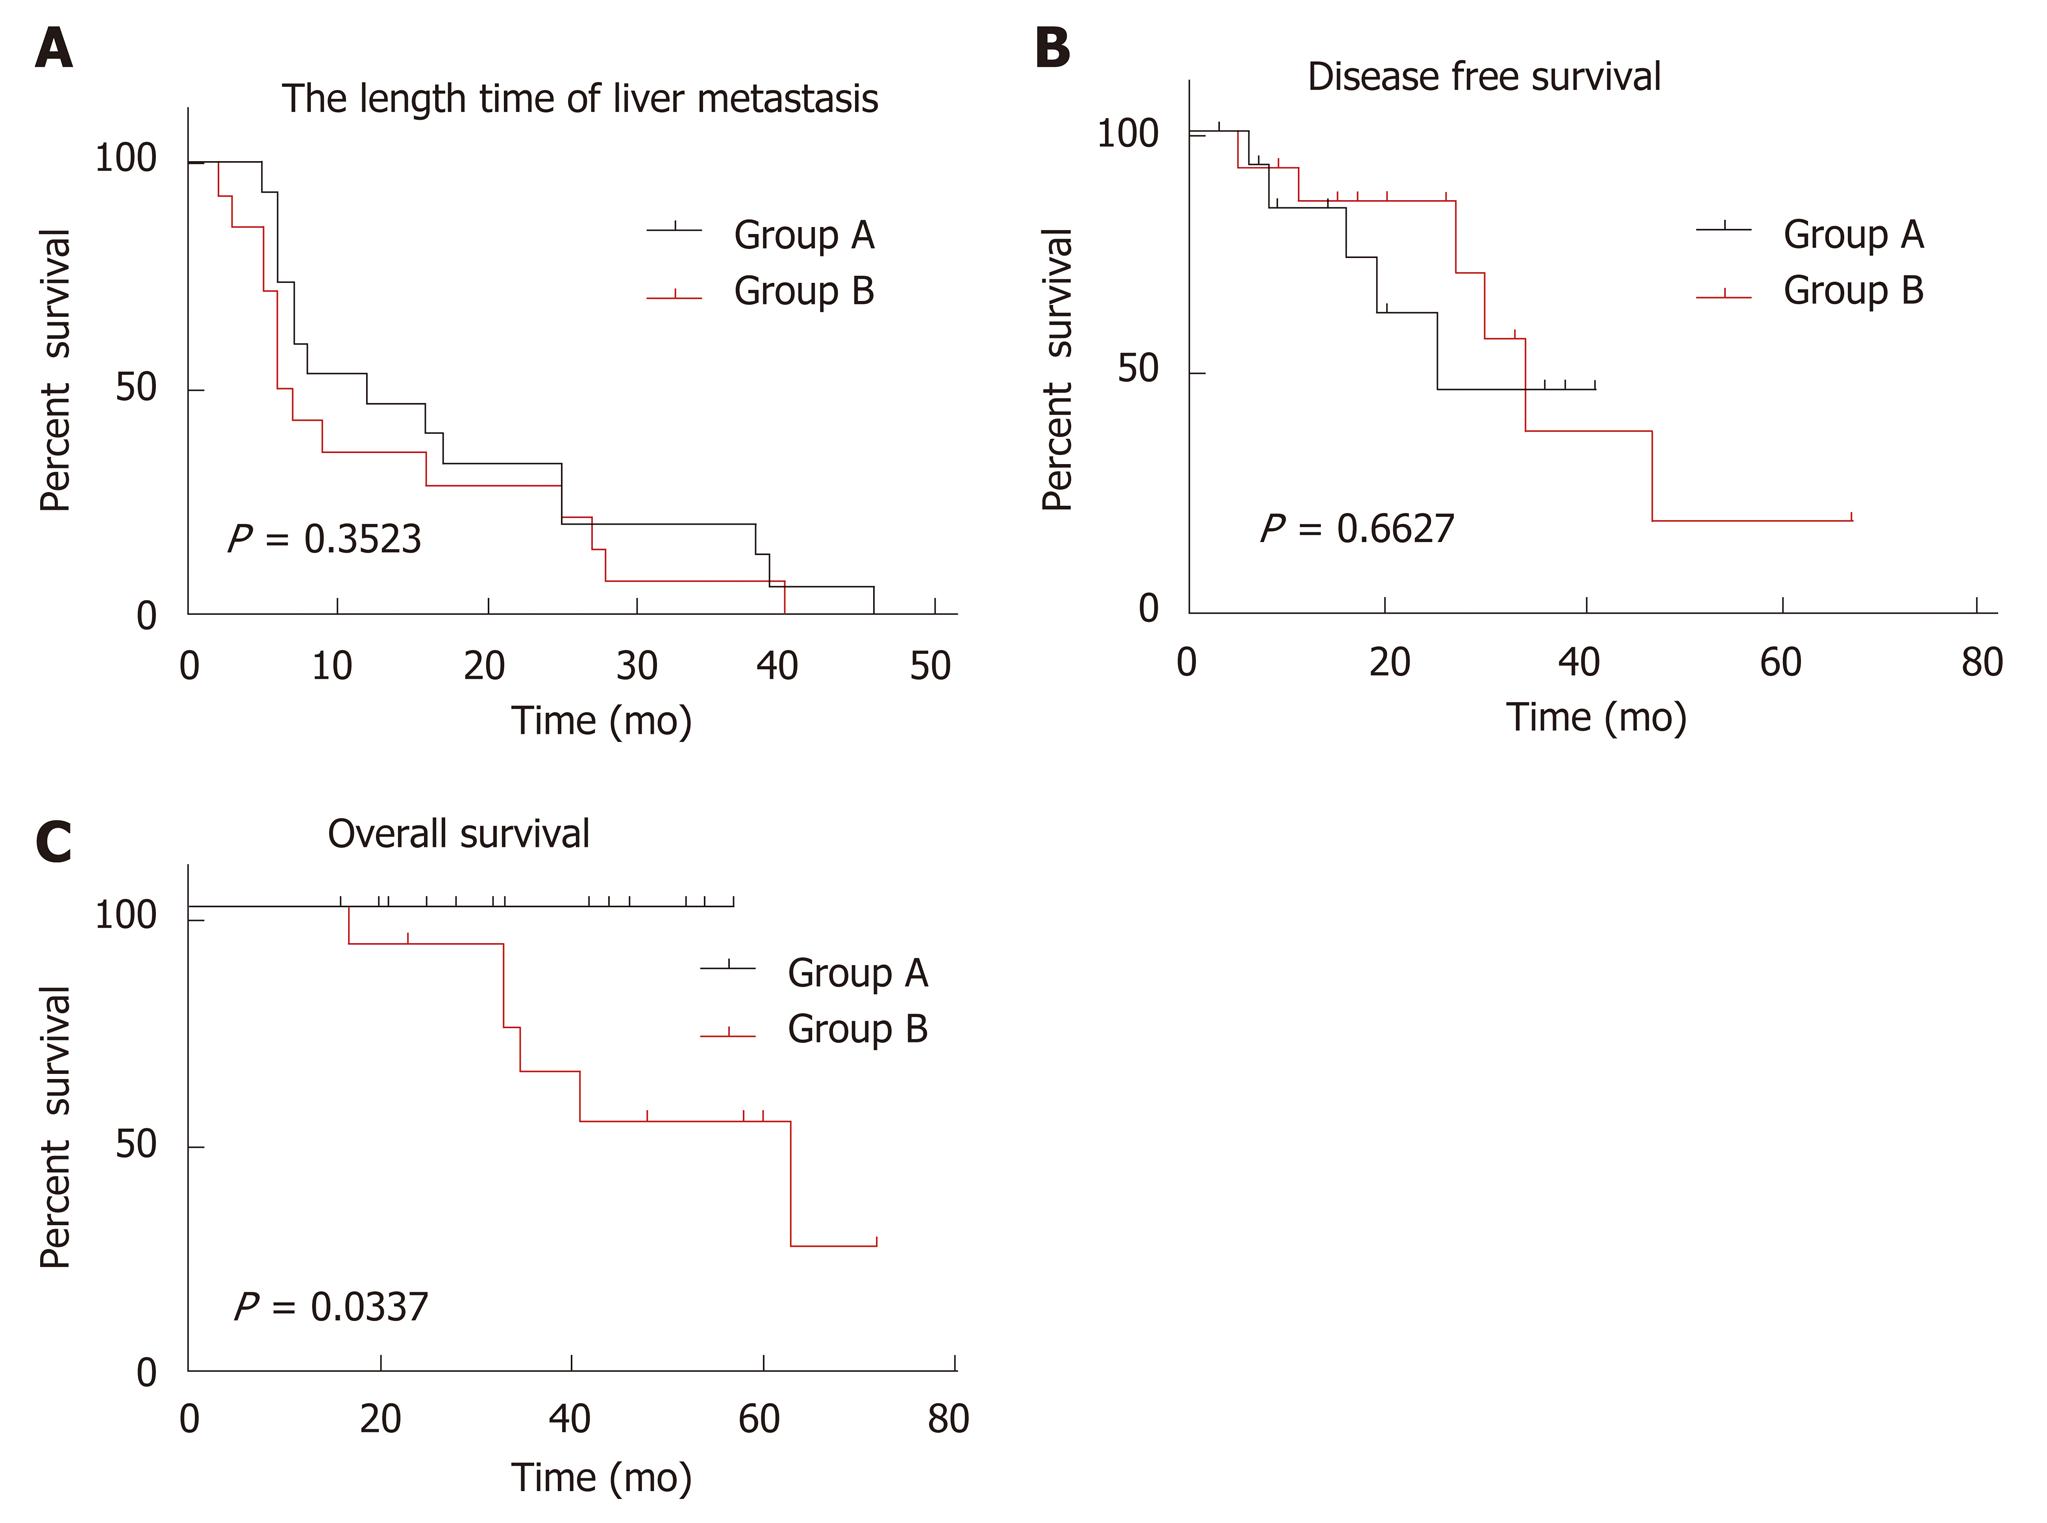
Figure 3 Kaplan-Meier curves for colorectal cancer liver metastasis between two groups.
A: Comparison of length time of liver metastasis, showing no significant difference; B: Comparison of disease-free survival, showing no significant difference; C: Comparison of overall survival, showing a statistically significant difference (P = 0.0337).
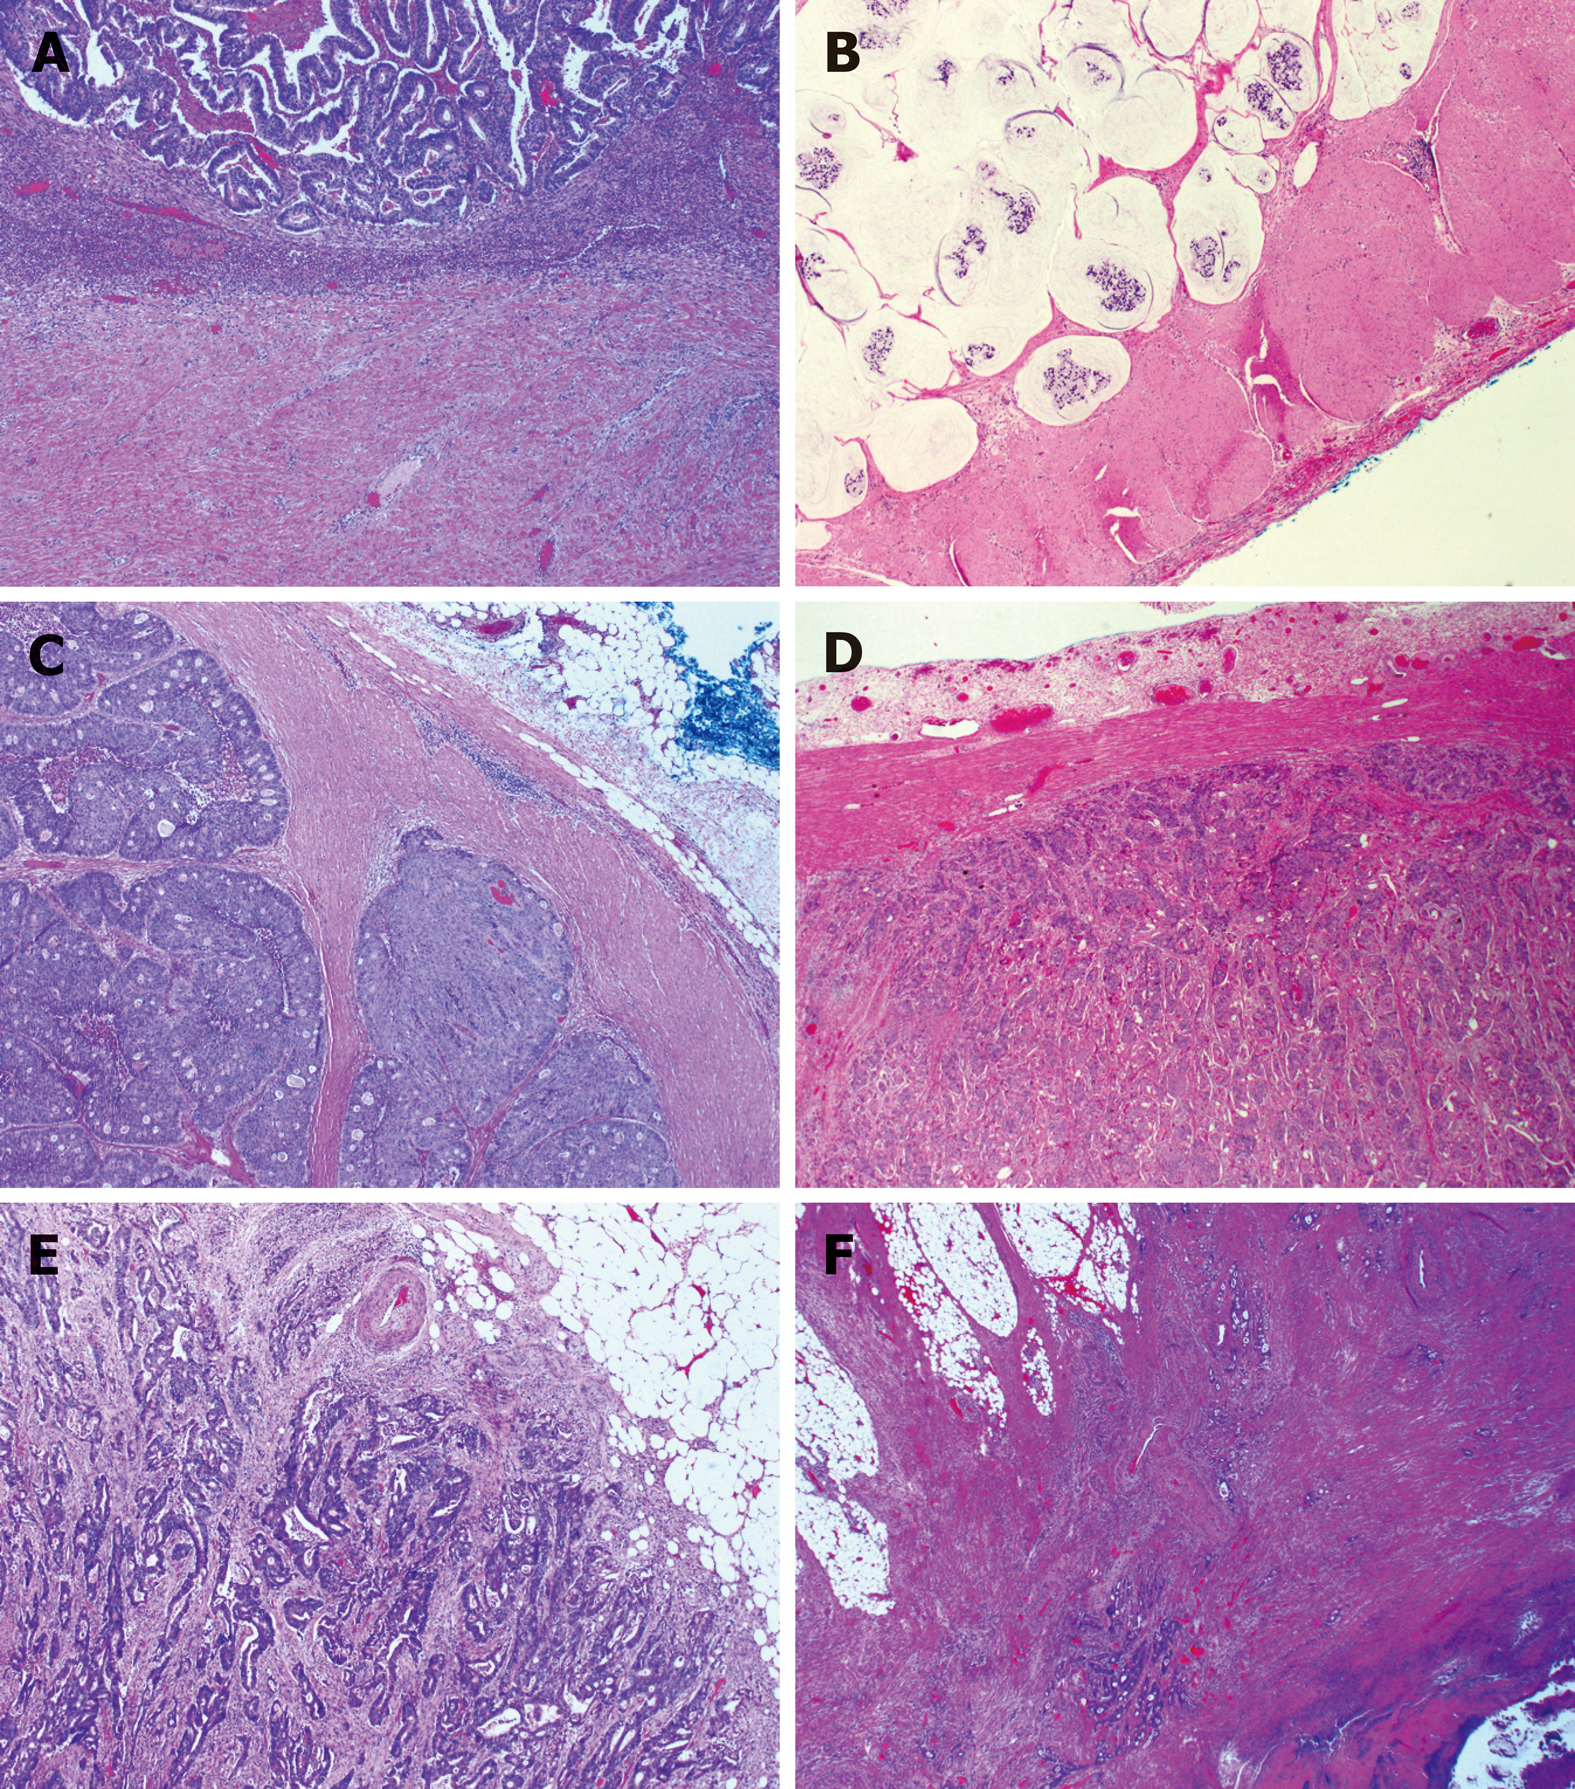
Figure 4 Subtypes of histologic growth pattern of primary colorectal carcinoma.
A: Ordinary expanding, where the tumor gland pushes the stroma and forms a sharp dividing line at the interface; B: Mucinous expanding, where pools of tumor epithelium containing mucin pushes the stroma and forms a sharp dividing line at the interface; C: Cribriform expanding, where the tumor gland at the invasive front forms a round cribriform structure and there is a clear dividing line between the tumor and the surrounding stroma; D: Micropapillary expanding, where the tumor cells at the invasive front forms micropapillary architecture and there is a clear dividing line between the tumor and the surrounding stroma; E: Ordinary infiltrating, where tumor cells infiltrate to the stroma and connect to the original tumor mass; F: Skip infiltrating, where there is a gap (>0.5 cm) of non-neoplastic tissue between the main tumor bulk and the invasive front.
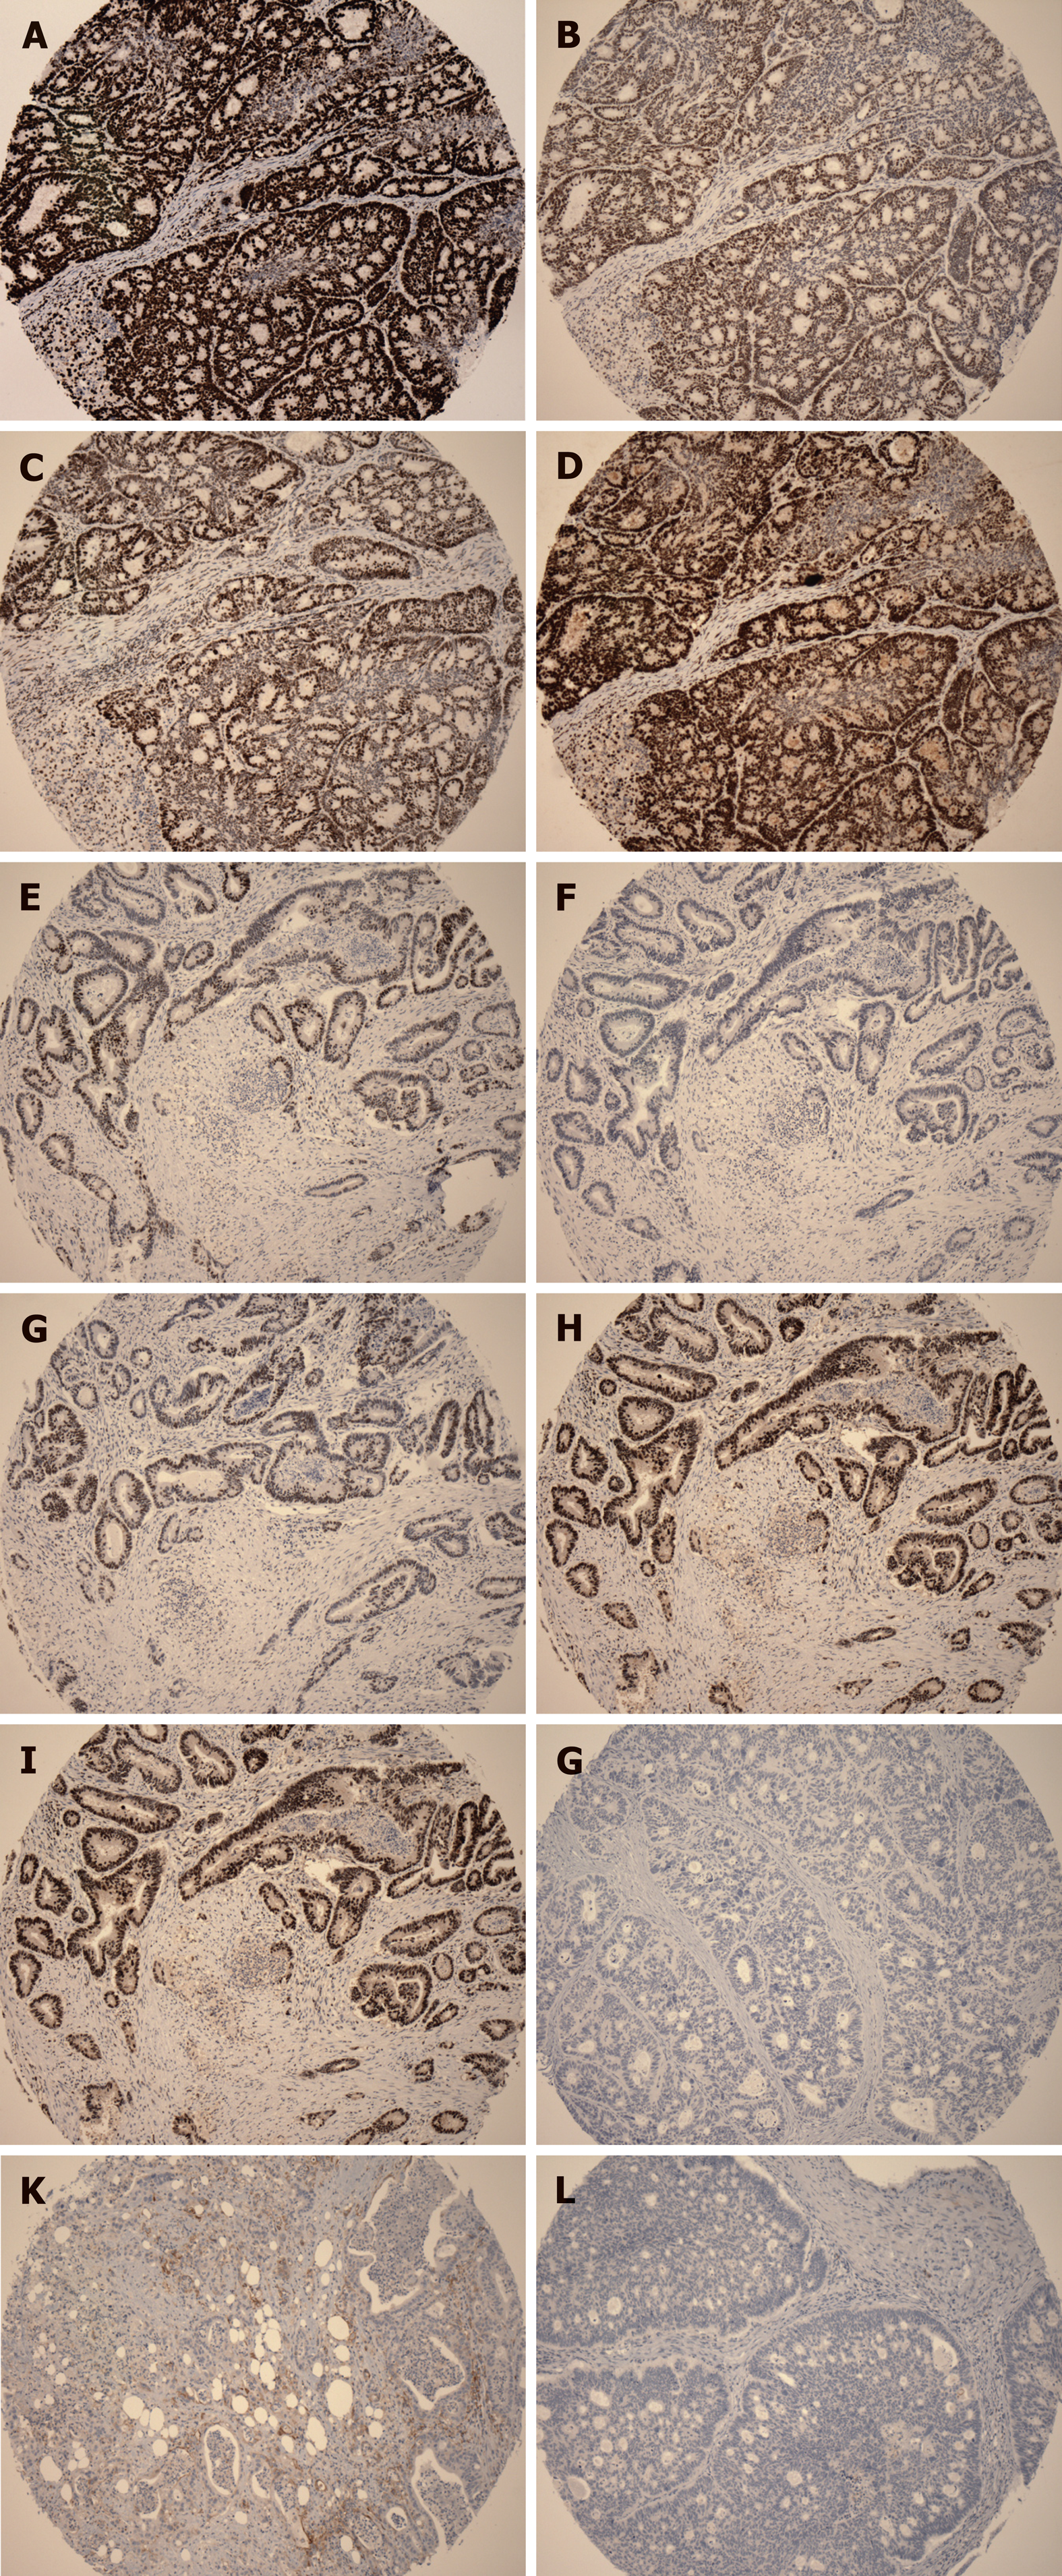
Figure 5 Representative immunohistochemical images.
A: Positive staining for MLH1; B: Positive staining for MSH2; C: Positive staining for MSH6; D: Positive staining for PMS2; E: Positive staining for MLH2; F: Negative staining for MSH2; G: Positive staining for MSH6; H: Positive staining for PMS2; I: Positive staining for BRAF V600E; J: Negative staining for BRAF V600E; K: Positive staining for PD-L1; L: Negative staining for PD-L1. A-D is the same case; E-H is the same case.
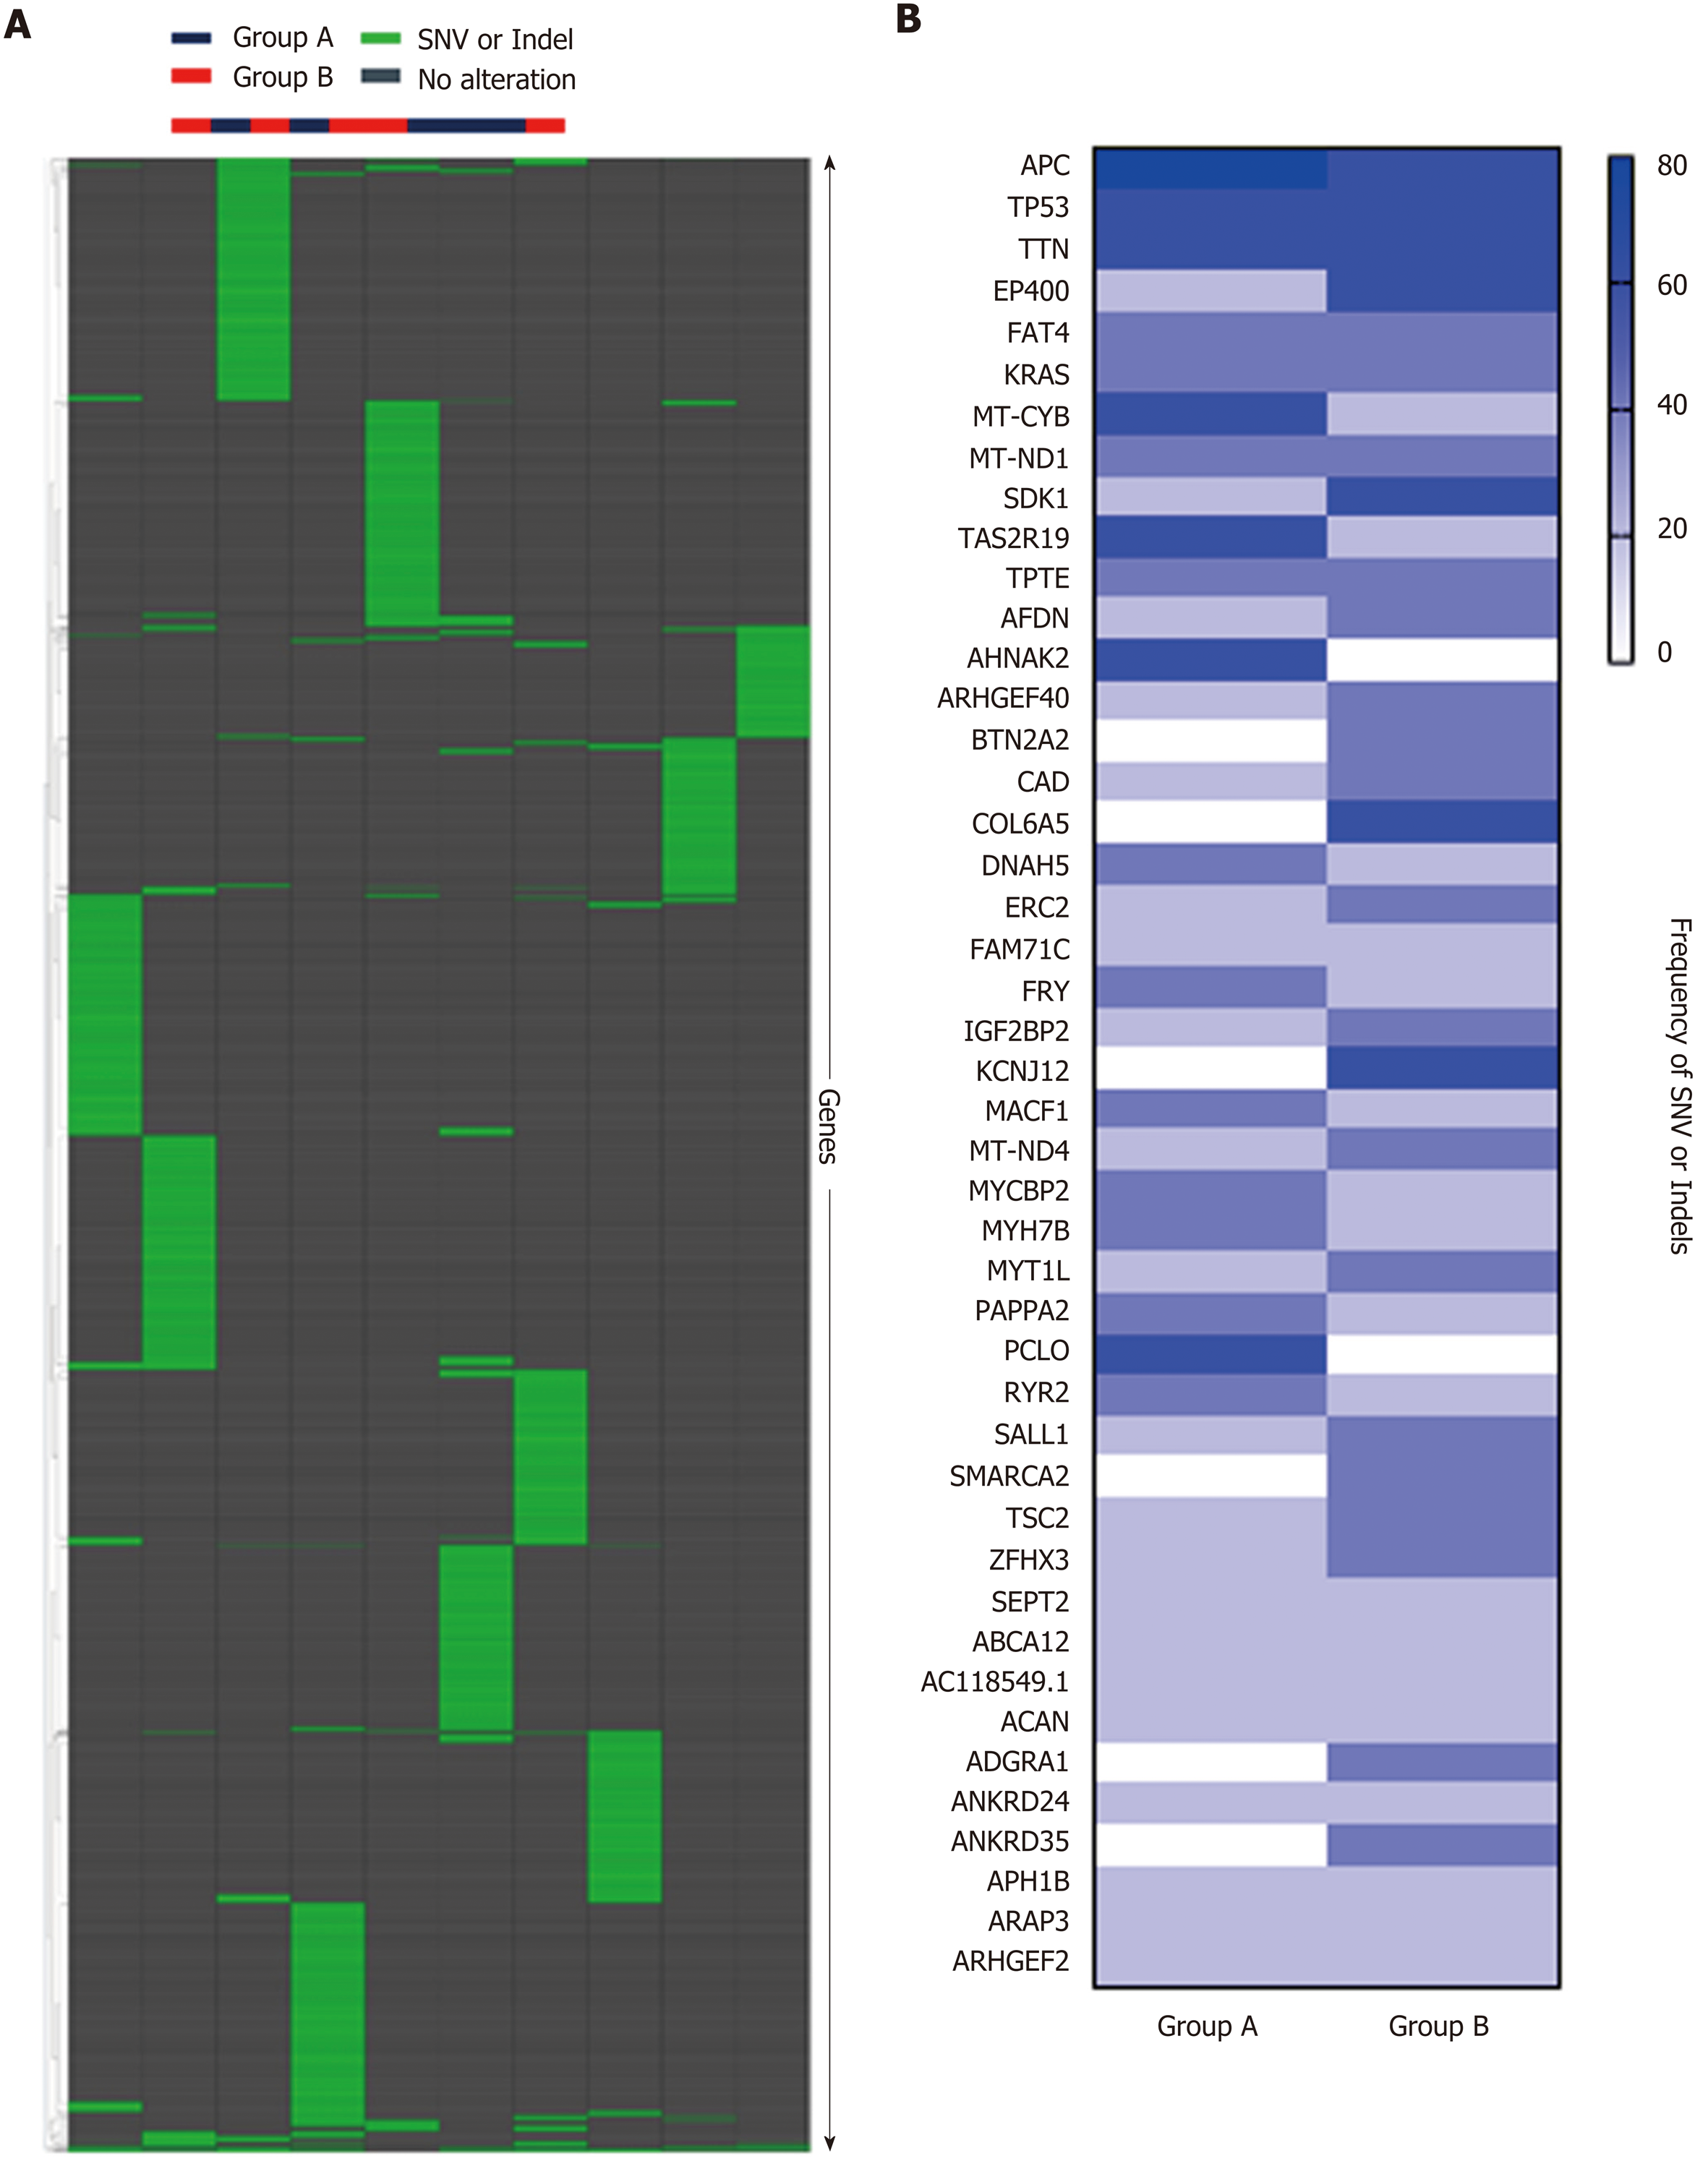
Figure 6 Whole exome sequencing analysis.
A: Hierarchical clustering of Groups A and B based on single nucleotide variant (SNV) and indels, showing no significant difference between the two groups. B: Frequency of SNV or indels in Group A and Group B, showing no significant difference between the two groups. SNV: Single nucleotide variant.
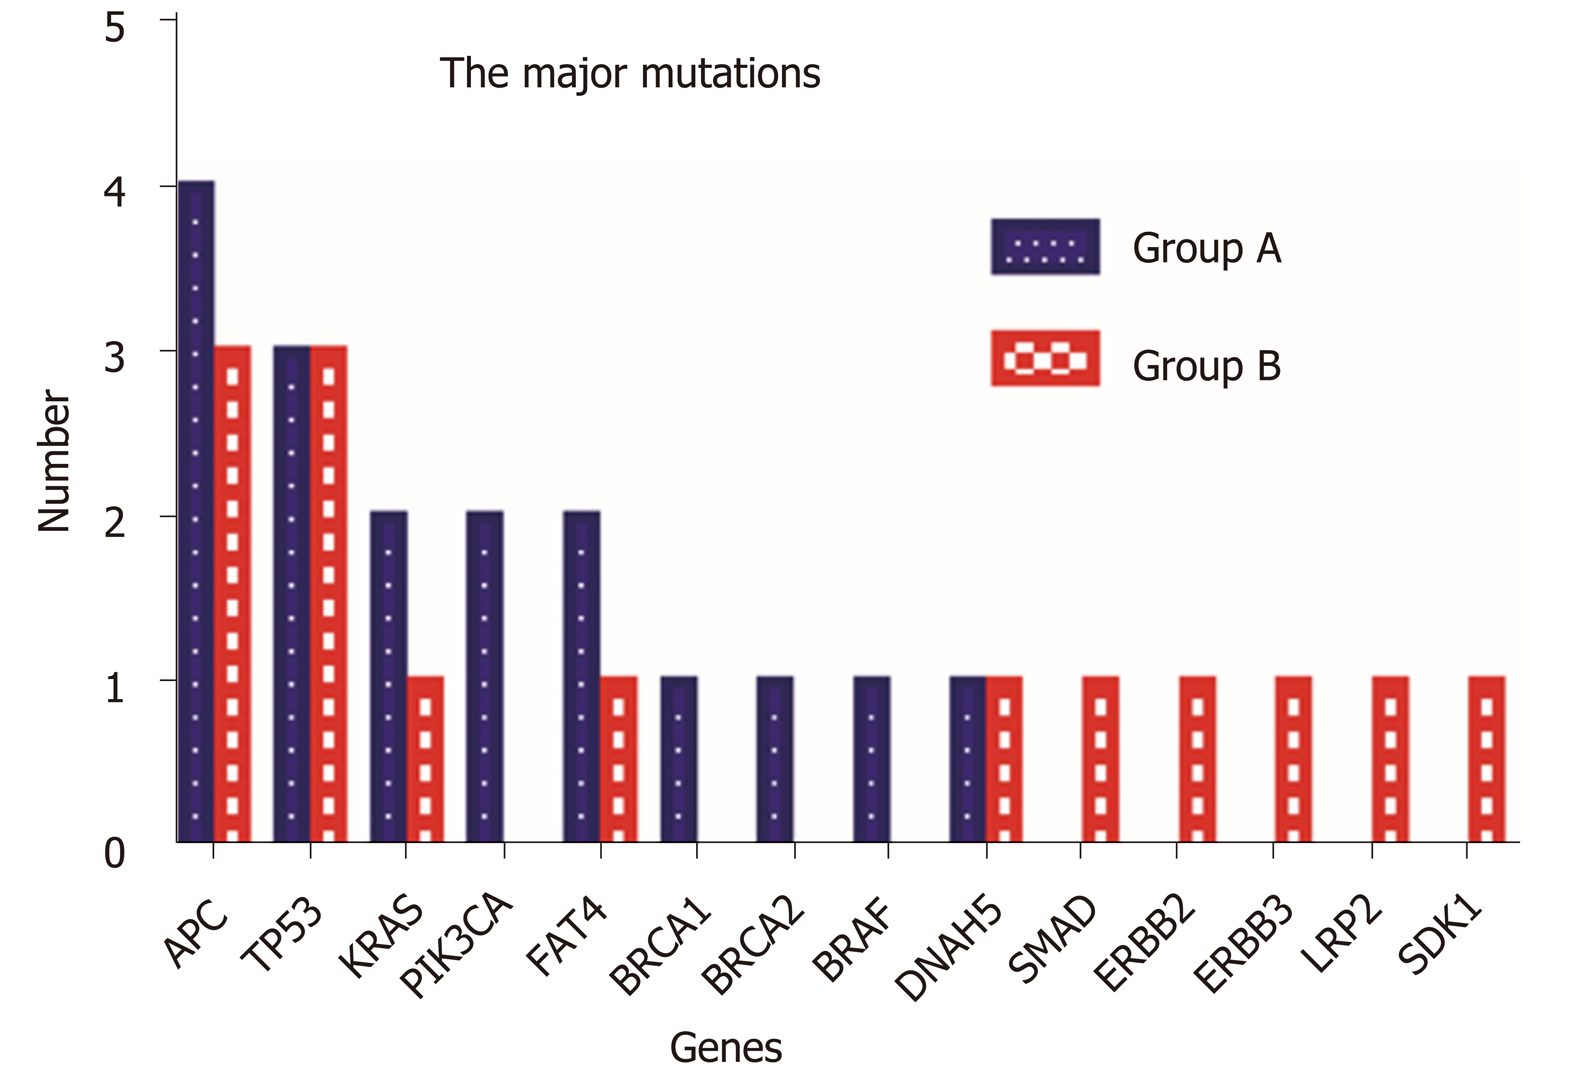
Figure 7 Comparison of the major mutations between Group A and Group B.
Fourteen major gene mutations were identified. PIK3CA, BRCA1, BRCA2, and BRAF mutations were only observed in Group A, and SMAD, ERBB2, ERBB3, LRP2, and SDK1 mutations were identified only in Group B.
- Citation: Wu JB, Sarmiento AL, Fiset PO, Lazaris A, Metrakos P, Petrillo S, Gao ZH. Histologic features and genomic alterations of primary colorectal adenocarcinoma predict growth patterns of liver metastasis. World J Gastroenterol 2019; 25(26): 3408-3425
- URL: https://www.wjgnet.com/1007-9327/full/v25/i26/3408.htm
- DOI: https://dx.doi.org/10.3748/wjg.v25.i26.3408


