Copyright
©The Author(s) 2019.
World J Gastroenterol. Jul 14, 2019; 25(26): 3408-3425
Published online Jul 14, 2019. doi: 10.3748/wjg.v25.i26.3408
Published online Jul 14, 2019. doi: 10.3748/wjg.v25.i26.3408
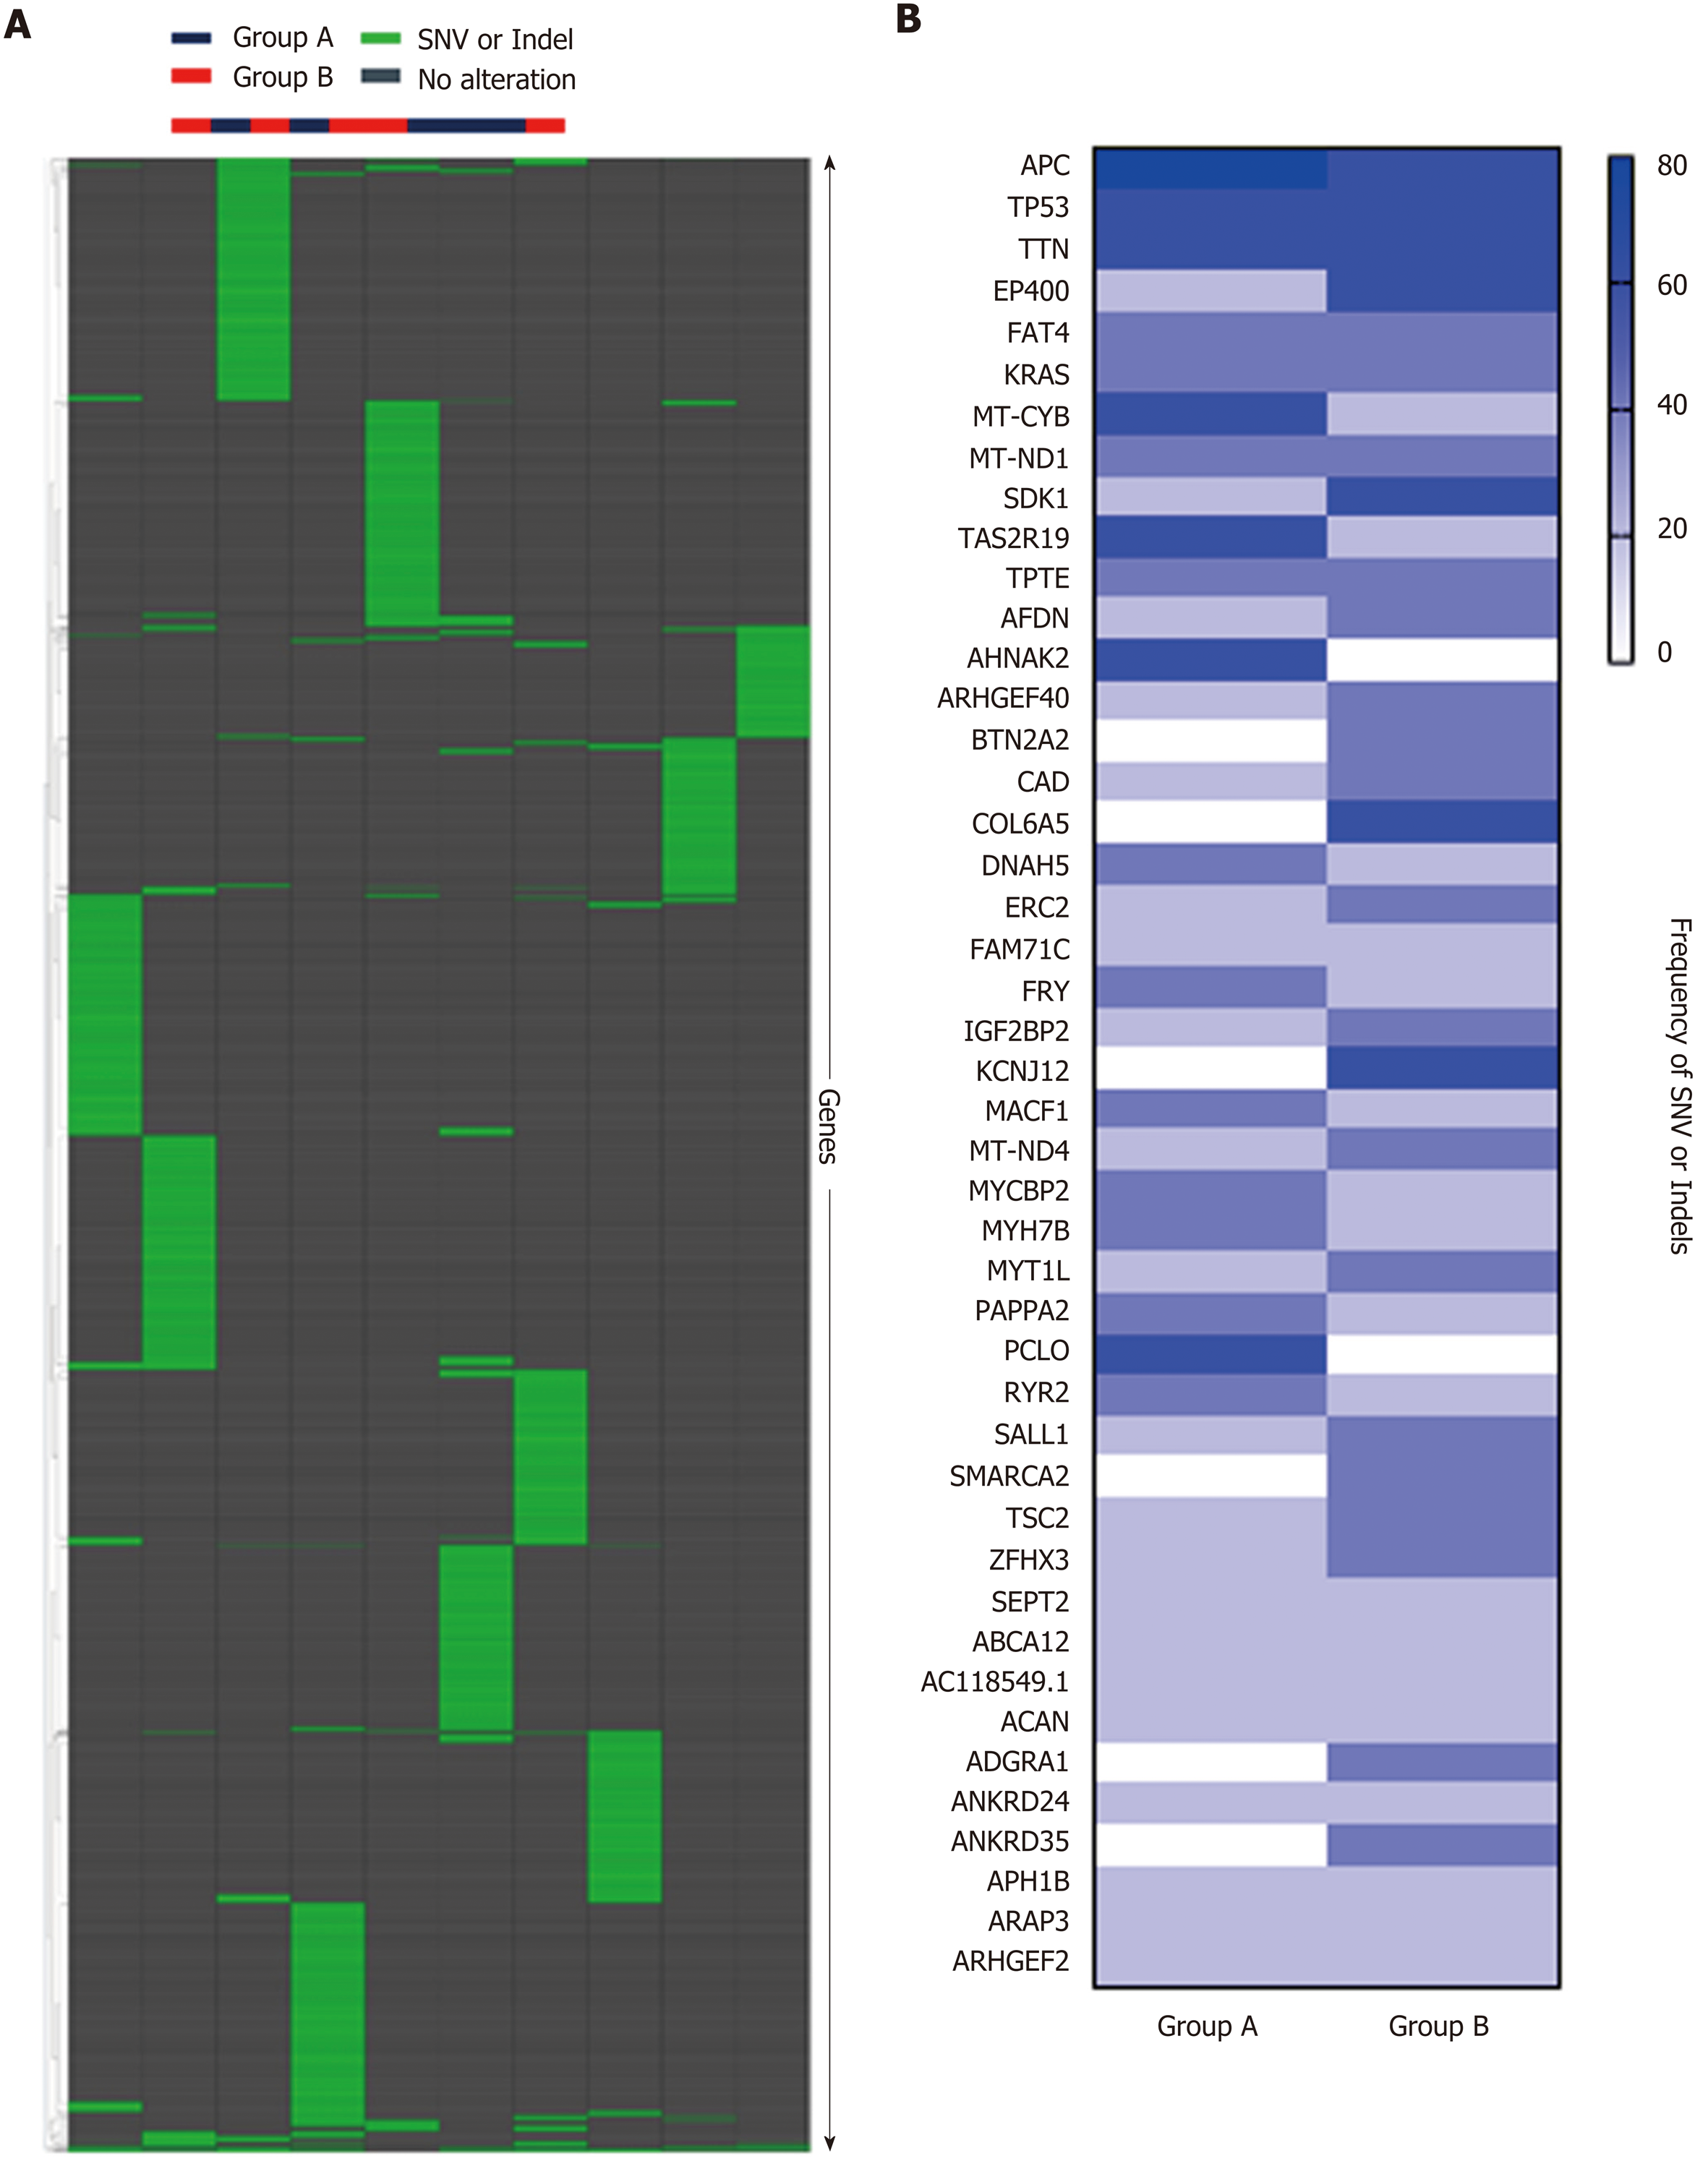
Figure 6 Whole exome sequencing analysis.
A: Hierarchical clustering of Groups A and B based on single nucleotide variant (SNV) and indels, showing no significant difference between the two groups. B: Frequency of SNV or indels in Group A and Group B, showing no significant difference between the two groups. SNV: Single nucleotide variant.
- Citation: Wu JB, Sarmiento AL, Fiset PO, Lazaris A, Metrakos P, Petrillo S, Gao ZH. Histologic features and genomic alterations of primary colorectal adenocarcinoma predict growth patterns of liver metastasis. World J Gastroenterol 2019; 25(26): 3408-3425
- URL: https://www.wjgnet.com/1007-9327/full/v25/i26/3408.htm
- DOI: https://dx.doi.org/10.3748/wjg.v25.i26.3408


