Copyright
©The Author(s) 2019.
World J Gastroenterol. Jul 14, 2019; 25(26): 3408-3425
Published online Jul 14, 2019. doi: 10.3748/wjg.v25.i26.3408
Published online Jul 14, 2019. doi: 10.3748/wjg.v25.i26.3408
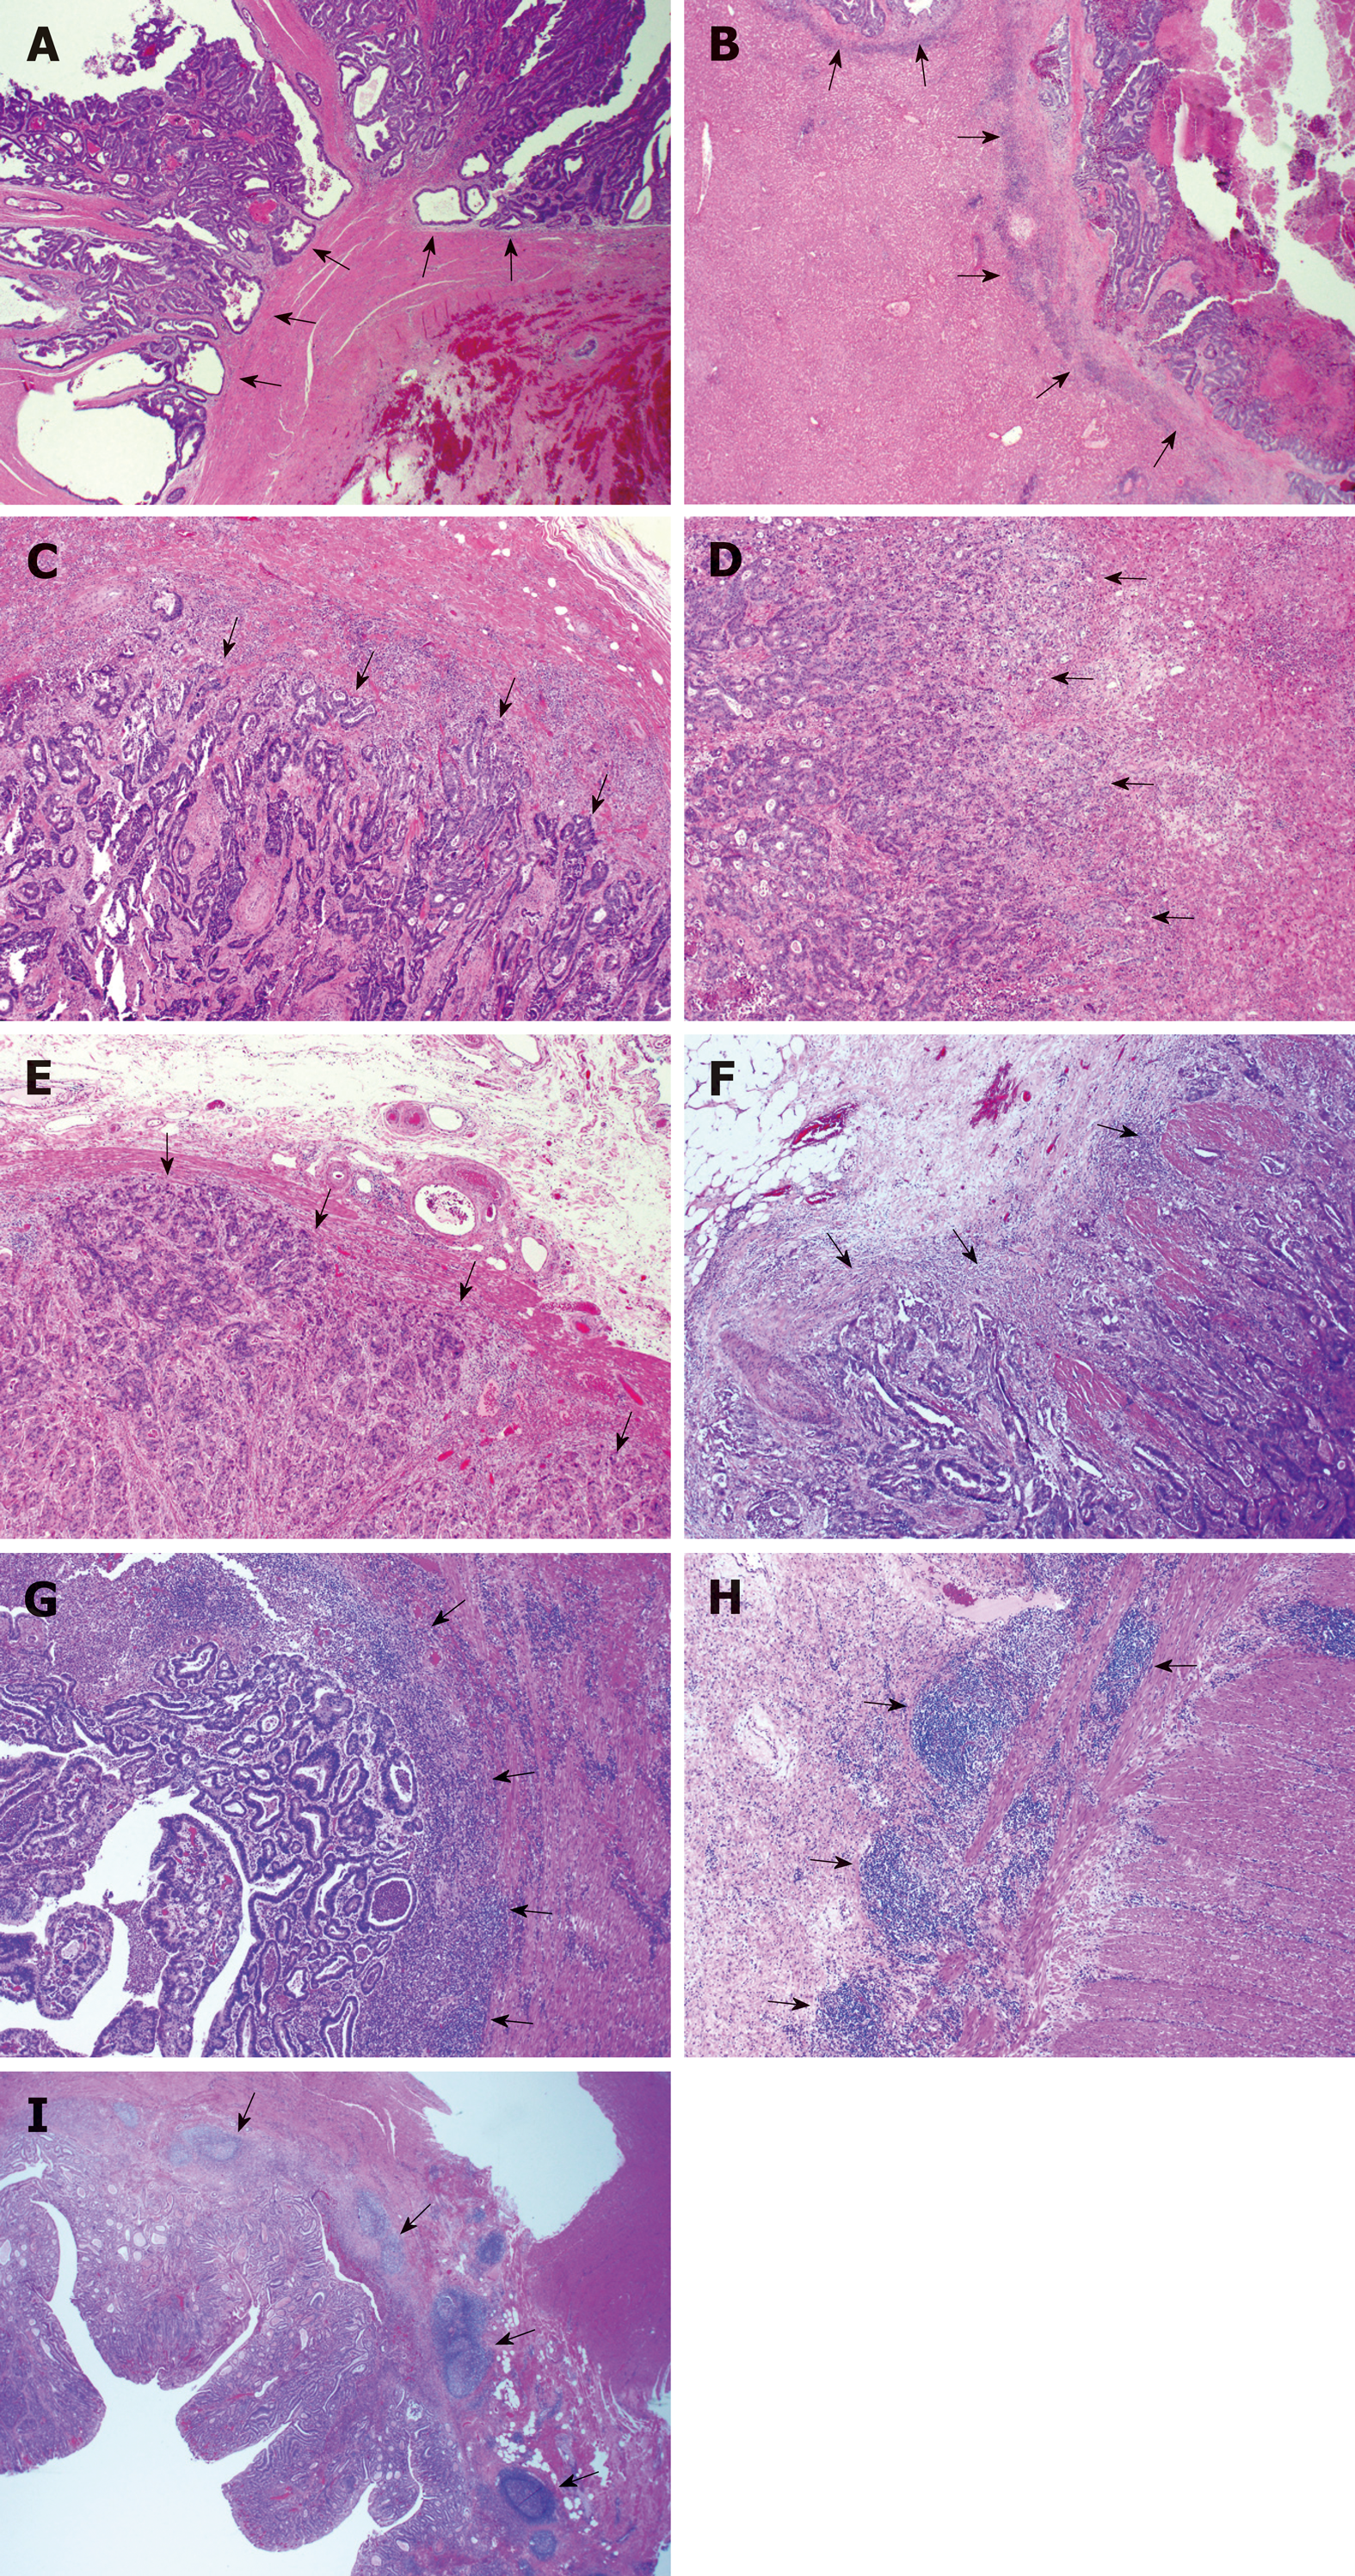
Figure 1 Representative histological images of the growth pattern of primary colorectal carcinoma and liver metastasis.
A: Primary colorectal carcinoma (CRC) with an expanding growth pattern where the tumor gland pushes the surrounding stroma with a sharper dividing interface (arrows show expanding growth pattern); B: Liver metastasis with a desmoplastic growth pattern showing a stroma band separating the tumor with the surrounding liver parenchyma (arrows show desmoplastic growth pattern), the same case as A; C: Primary CRC with an infiltrating growth pattern where streams of tumor cells permeate into the stroma with an irregular interface (arrows show infiltrating growth pattern); D: Liver metastasis with a replacement growth pattern showing tumors cells in direct contact with hepatocytes and grow into the liver cell plate (arrows show replacement growth pattern), the same case as C; E: Negative inflammatory cell band (ICB) negative. There is no lymphocyte infiltration at the tumor-normal tissue interface, as arrows show; F: Low grade ICB. Lymphocyte infiltration is present in less than 50% tumor-normal tissue interface, as arrows show; G: High grade ICB. Lymphocyte infiltration is present in more than 50% tumor-normal tissue interface, as arrows show; H: Positive Crohn’s disease-like response (CDR) showing lymphoid aggregates at the deeper aspects of the bowl wall (arrows show aggregated lymphoid tissue); I: Positive CDR showing lymphoid aggregates at the mucosal-submucosal junction (arrows show aggregated lymphoid tissue).
- Citation: Wu JB, Sarmiento AL, Fiset PO, Lazaris A, Metrakos P, Petrillo S, Gao ZH. Histologic features and genomic alterations of primary colorectal adenocarcinoma predict growth patterns of liver metastasis. World J Gastroenterol 2019; 25(26): 3408-3425
- URL: https://www.wjgnet.com/1007-9327/full/v25/i26/3408.htm
- DOI: https://dx.doi.org/10.3748/wjg.v25.i26.3408


