Published online Jun 28, 2020. doi: 10.35713/aic.v1.i1.31
Peer-review started: March 21, 2020
First decision: April 22, 2020
Revised: May 2, 2020
Accepted: June 7, 2020
Article in press: June 7, 2020
Published online: June 28, 2020
Processing time: 108 Days and 10.4 Hours
Digital pathology image (DPI) analysis has been developed by machine learning (ML) techniques. However, little attention has been paid to the reproducibility of ML-based histological classification in heterochronously obtained DPIs of the same hematoxylin and eosin (HE) slide.
To elucidate the frequency and preventable causes of discordant classification results of DPI analysis using ML for the heterochronously obtained DPIs.
We created paired DPIs by scanning 298 HE stained slides containing 584 tissues twice with a virtual slide scanner. The paired DPIs were analyzed by our ML-aided classification model. We defined non-flipped and flipped groups as the paired DPIs with concordant and discordant classification results, respectively. We compared differences in color and blur between the non-flipped and flipped groups by L1-norm and a blur index, respectively.
We observed discordant classification results in 23.1% of the paired DPIs obtained by two independent scans of the same microscope slide. We detected no significant difference in the L1-norm of each color channel between the two groups; however, the flipped group showed a significantly higher blur index than the non-flipped group.
Our results suggest that differences in the blur - not the color - of the paired DPIs may cause discordant classification results. An ML-aided classification model for DPI should be tested for this potential cause of the reduced reproducibility of the model. In a future study, a slide scanner and/or a preprocessing method of minimizing DPI blur should be developed.
Core tip: Little attention has been paid to the reproducibility of machine learning (ML)-based histological classification in heterochronously obtained Digital pathology images (DPIs) of the same hematoxylin and eosin slide. This study elucidated the frequency and preventable causes of discordant classification results of DPI analysis using ML for the heterochronously obtained DPIs. We observed discordant classification results in 23.1% of the paired DPIs obtained by two independent scans of the same microscope slide. The group with discordant classification results showed a significantly higher blur index than the other group. Our results suggest that differences in the blur of the paired DPIs may cause discordant classification results.
- Citation: Ogura M, Kiyuna T, Yoshida H. Impact of blurs on machine-learning aided digital pathology image analysis. Artif Intell Cancer 2020; 1(1): 31-38
- URL: https://www.wjgnet.com/2644-3228/full/v1/i1/31.htm
- DOI: https://dx.doi.org/10.35713/aic.v1.i1.31
Recent developments in medical image analysis empowered by machine learning (ML) have expanded to digital pathology image (DPI) analysis[1-3]. For over ten years, NEC Corporation has researched and developed image analysis software that can detect carcinomas in tissue in the digital images of hematoxylin and eosin (HE) stained slides. DPI analysis is generally performed for digital images obtained with special devices such as microscopic cameras or slide scanners. These devices cannot make completely identical digital images or data matrices even when the same microscope slide is repeatedly shot with the same camera or scanned by the same scanner.
In general, image analysis by ML can provide different classification results if an object has multiple images showing different features. Therefore, slight differences in a DPI made by imaging devices can also cause different classification results. Each digital image will have different characteristics even when the same microscope slide of a patient is repeatedly digitized by the same slide scanner. Similarly, the same microscope slide of a patient can be digitized at a local hospital and then at a referral hospital. The resulting differences in image features of the same microscope slide can provide discordant classification results of DPI analysis, confusing both patients and medical professionals. However, only a few reports have mentioned this issue.
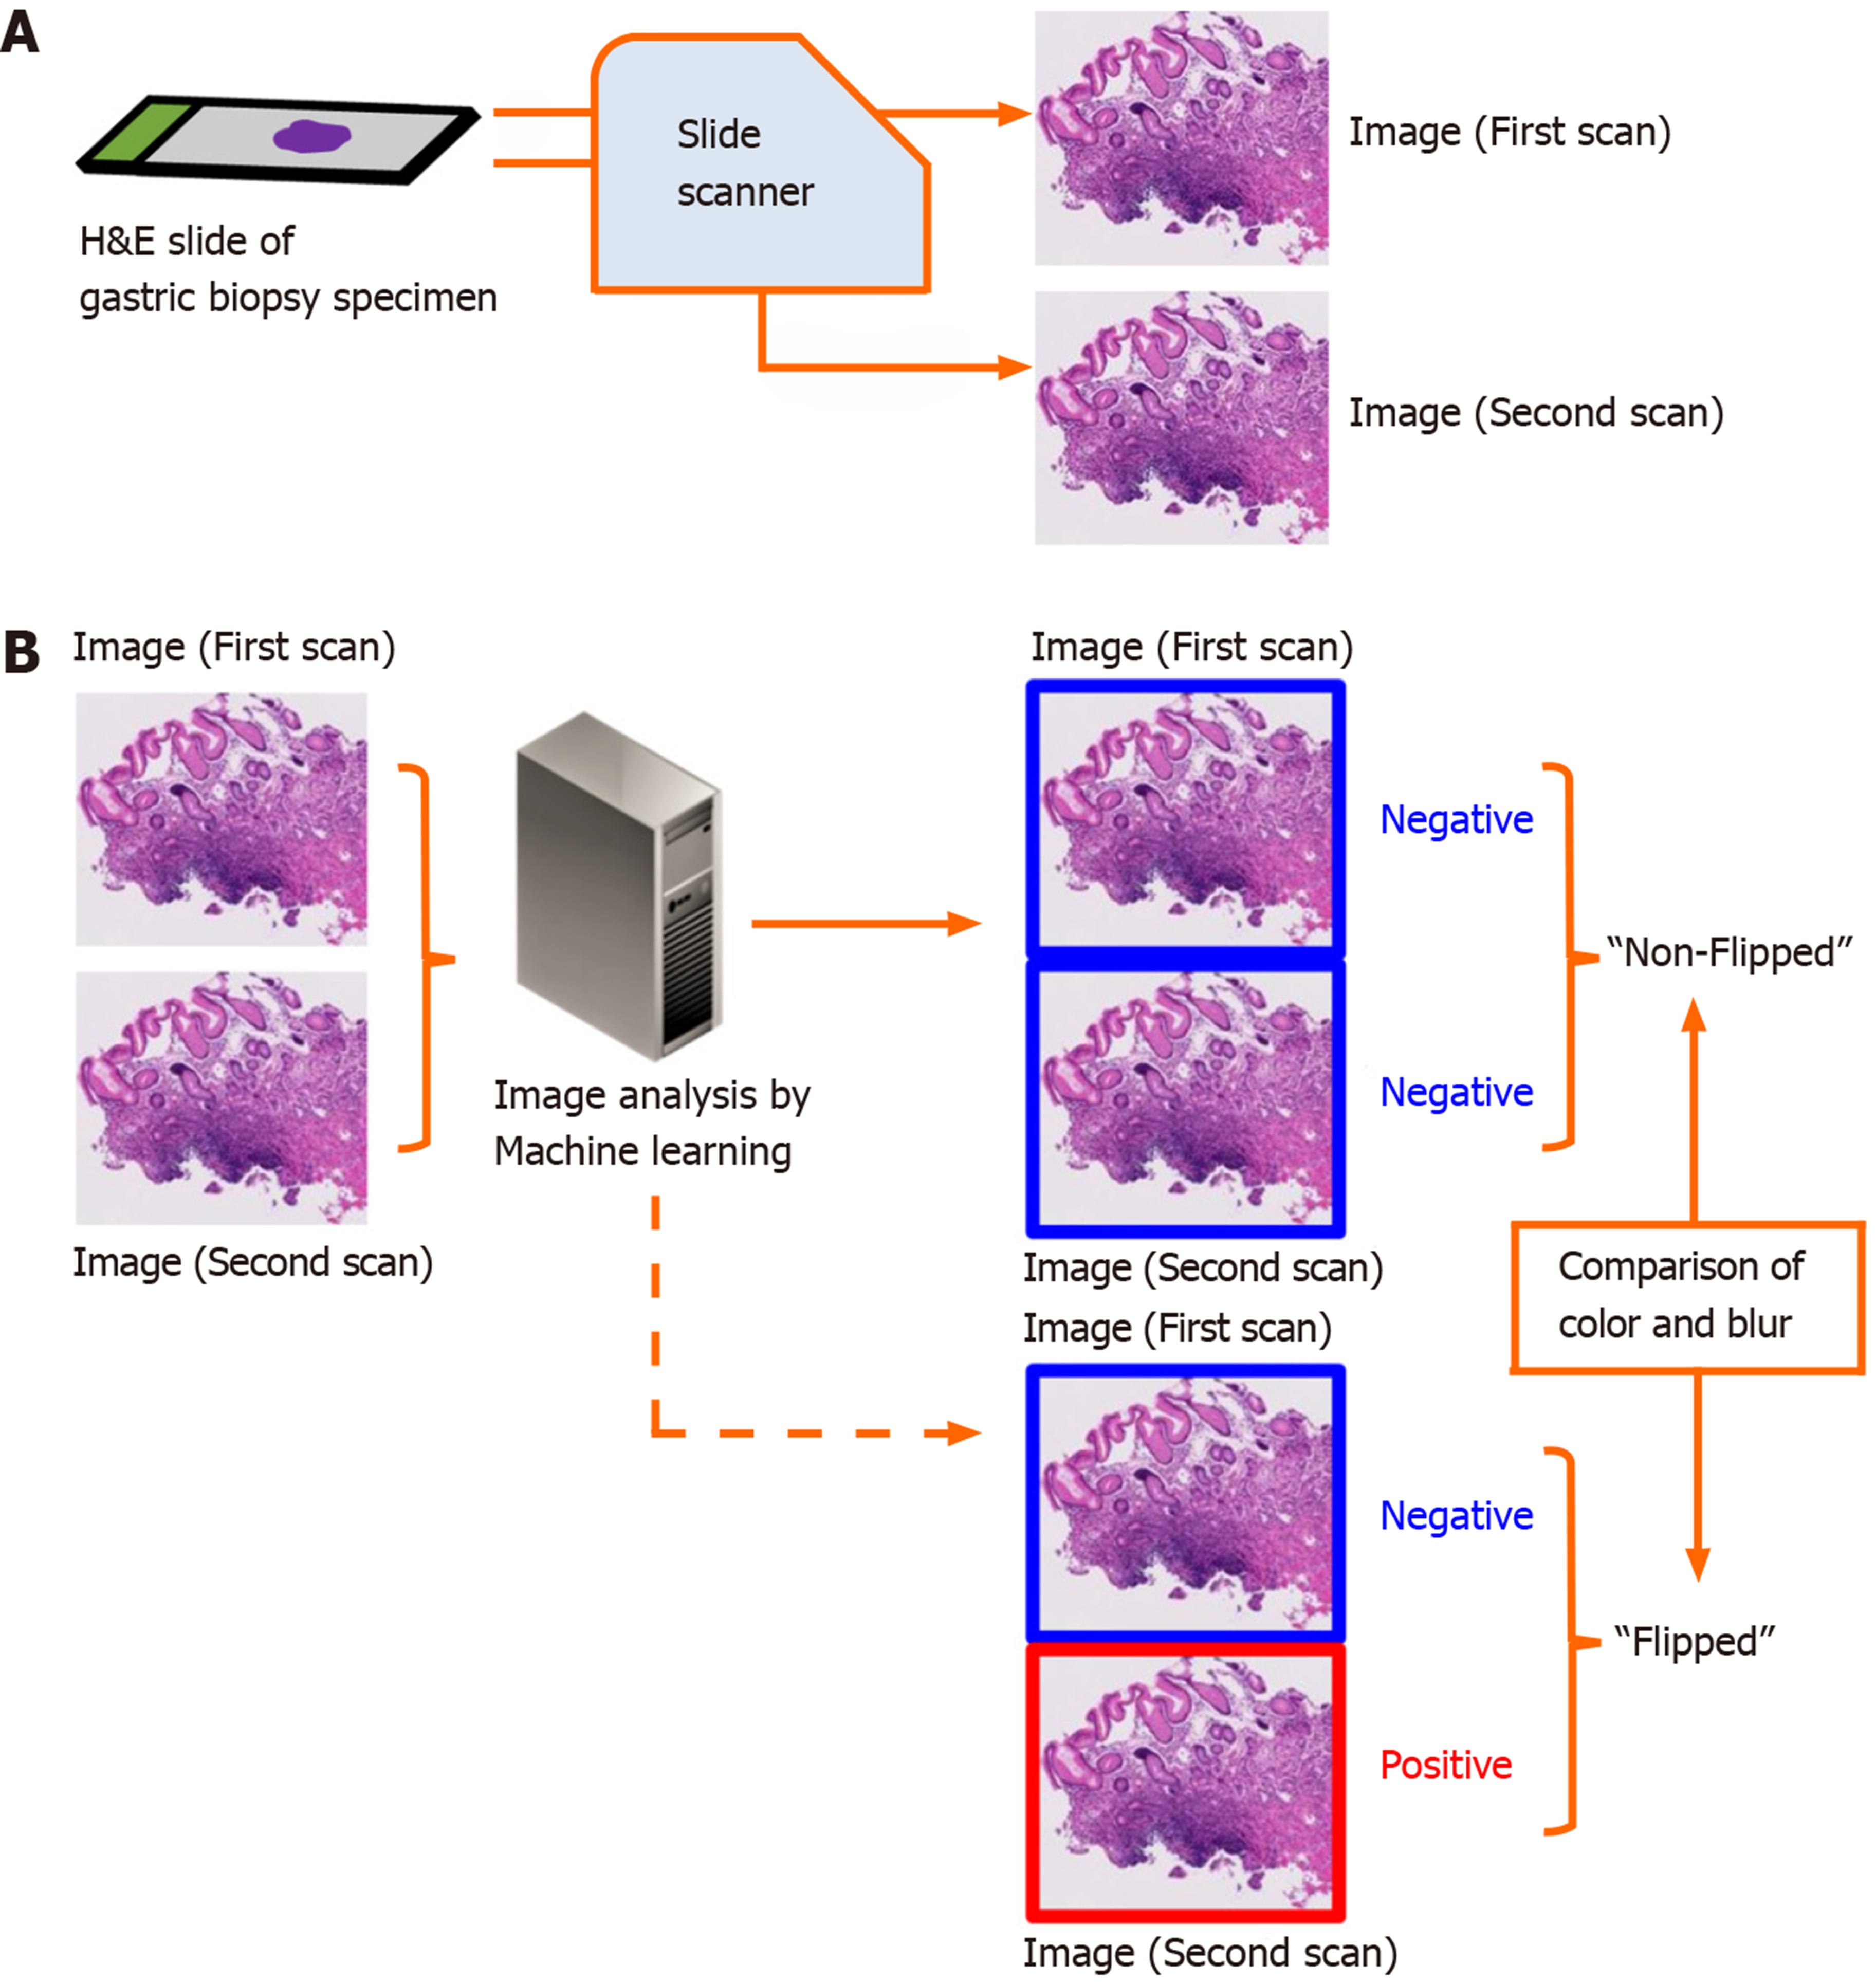
The aim of this study is to elucidate the frequency and preventable cause of discordant classification results of DPI analysis using ML in the aforementioned situation. We compared the classification results between paired DPIs of the same microscope slide obtained from two independent scans using the same slide scanner (Figure 1).
We conducted the study in accordance with the Declaration of Helsinki and with the approval of the Institutional Review Board of the National Cancer Center, Tokyo, Japan. We consecutively collected 3062 gastric biopsy specimens between January 19-April 30, 2015 at the National Cancer Center (Tsukiji and Kashiwa campuses). The specimens were placed in 10% buffered formalin and embedded in paraffin. Each block was sliced into 4-μm thick sections. Routine HE staining was performed for each slide using an automated staining system.
During the image collection and analysis procedure, the researchers were blind to all of the diagnoses of the human pathologists. We developed an ML model to analyze the DPIs using a multi-instance learning framework[4]. The results of the concordance between pathological diagnosis by human pathologists and classification by an ML model was previously reported[5]. In our study, we randomly selected 584 images of the 3062 specimens to use for the present analysis.
We scanned 298 HE stained slides containing 584 tissues twice using the NanoZoomer (Hamamatsu Photonics K. K., Shizuoka, Japan) virtual slide scanner, creating the paired DPIs. The paired DPIs were analyzed by our ML-aided classification model[4]. Our ML-aided classification model classified the results of each tissue as “Positive” or “Negative”. “Positive” denoted neoplastic lesions or suspicion of neoplastic lesions and “Negative” denoted the absence of neoplastic lesions. The procedure for classification of a cancerous areas in a given whole-slide image is as follows: (1) Identify the tissue regions at 1.25 ×; (2) The tissue area was then divided into several rectangular regions of interest (ROIs); (3) From each ROI, the structural and nuclear features are extracted at different magnification (10 × and 20 ×); (4) After the feature extraction, all ROIs were classified as positive or negative using a pre-trained classifier (support vector machine, SVM); and (5) The SVM-based classifier assigns a real number t to each ROI, where t takes value in the range (-1.0, 1.0). A value of 1.0 indicates a positive ROI and a value of -1.0 indicates a negative ROI[5]. In this experiment, we interpreted the value of t ≥ 0.4 indicates a positive ROI.
We defined the group without discordant classification results between the paired DPIs as the “non-flipped group” and the group with discordant classification results as the “flipped group”.
For reference, we repeated analysis of the identical DPIs that had identical data matrices twice, then compared their results.
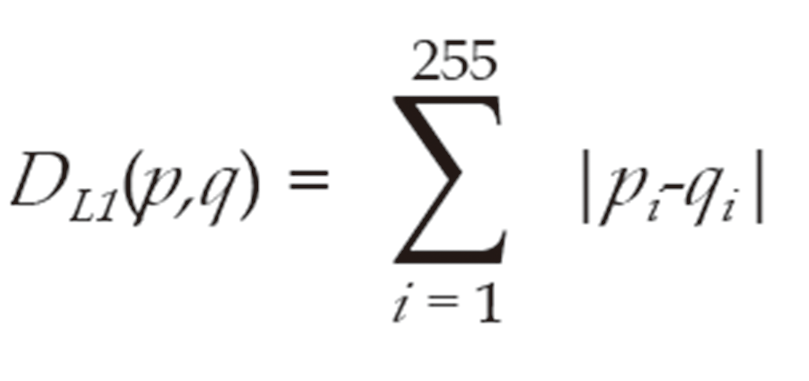
We separated tissue images into tissue regions and non-tissue regions. To examine the differences in tissue color in the first and second scanned images, we measured the L1-norm distance between color distributions of images in each color channel; i.e., red (R), green (G), and blue (B). The L1-norm distance between normalized histograms p and q were defined as Formula 1:
Where pi and qi are the normalized frequencies at the i-th bin of histograms p and q, respectively.
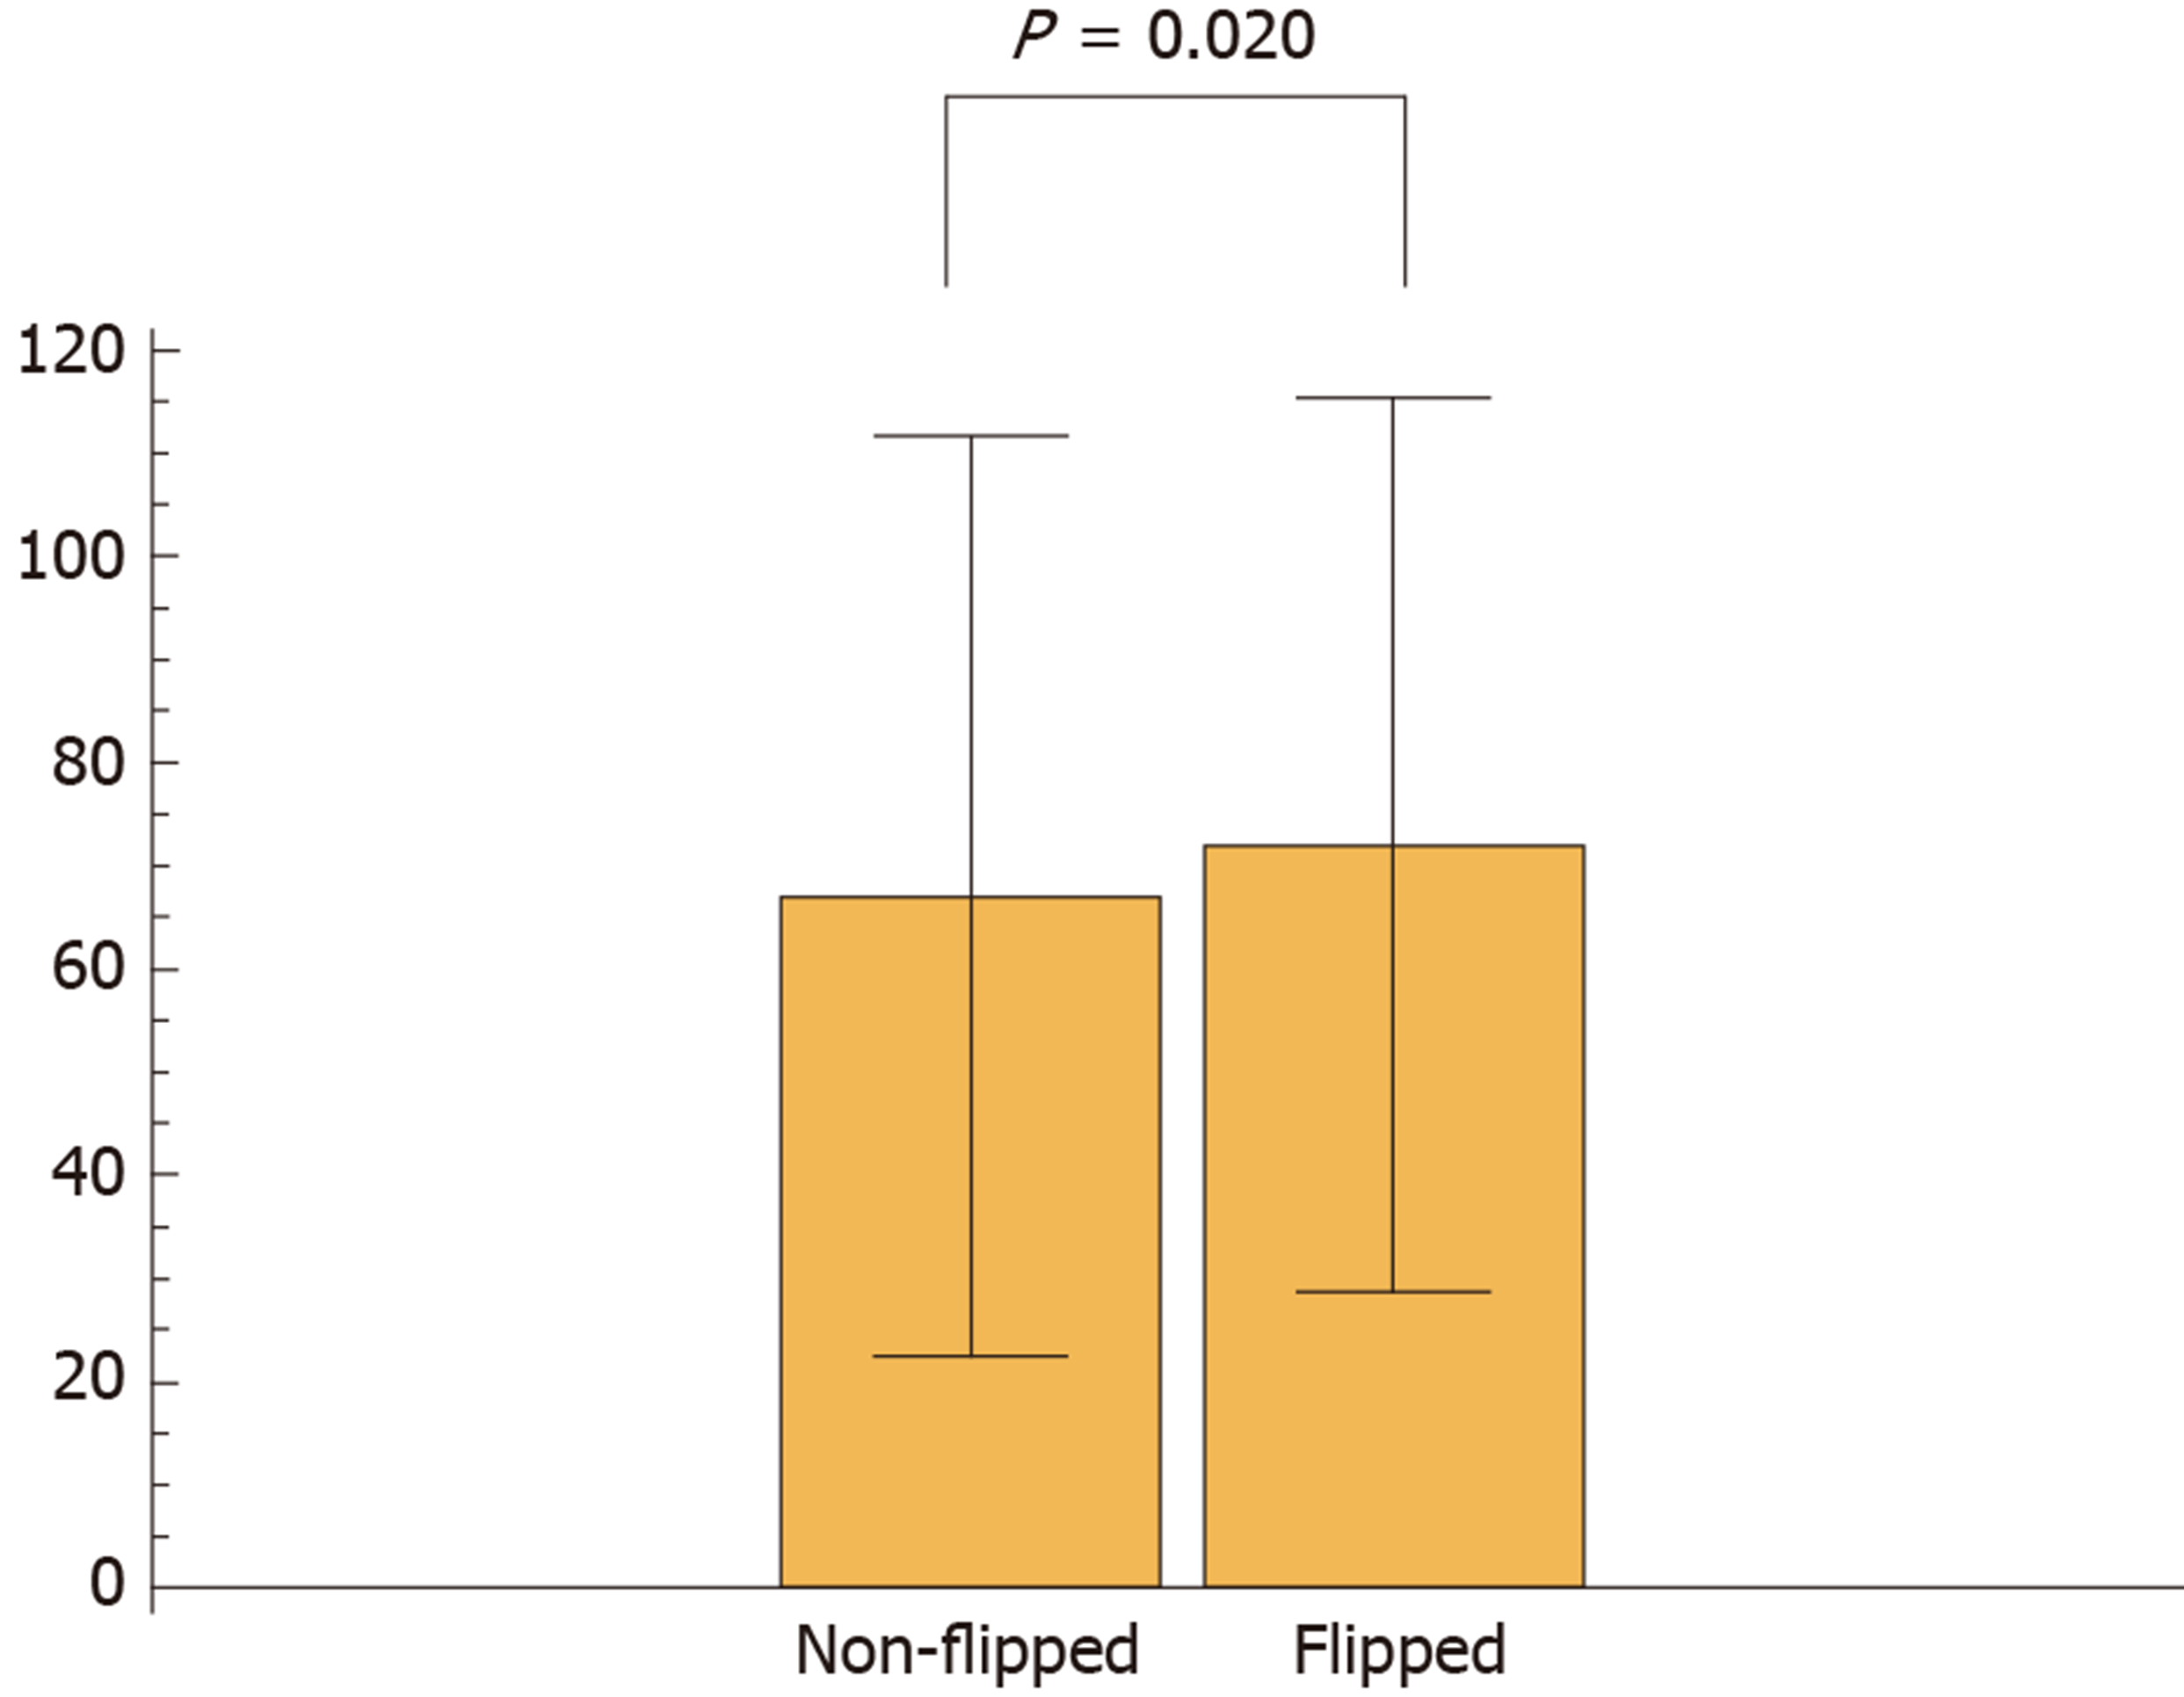
We quantified the degree of image blurring using the variance of wavelet coefficients of an image[6]. The degree of image blurring is calculated and normalized as follows: (1) 2D convolution by neighboring fileter; (2) Local variance of a 5 × 5 area; and (3) Captures local phase variations after convolution with wavelet filters, normalized by a sigmoid function to (0, 1) range. The degree of blurring was then normalized to between 0 and 255 and we calculated its distribution (normalized histogram). We defined the blur index using the 98th percentile of the above distribution of the variance of wavelet coefficients.
We used the Mann-Whitney test to evaluate the significant differences in the blur index between the non-flipped and flipped groups.
The analysis results did not change in 449 tissues; however, the results changed in 135 tissues (23.1%), either from positive to negative or from negative to positive (Table 1). Therefore, 135 tissues were in the flipped group.
| The second scan | ||||
| Positive | Negative | Unclassifiable | ||
| The first scan | Positive | 248 | 66 | 0 |
| Negative | 69 | 197 | 2 | |
| Unclassifiable | 1 | 0 | 4 | |
On the other hand, 100% (584/584) of the concordance rate was observed between the classification results of the first analysis and the second analysis of the identical DPIs by our ML-aided classification model.
We compared the medians of the L1-norm in the non-flipped and flipped groups and found no significant difference (Table 2).
| Color channel | Median of the non-flipped group | Median of the flipped group | P value |
| R | 0.0350 ± 0.0220 | 0.0347 ± 0.0217 | 0.900 |
| G | 0.0319 ± 0.0197 | 0.0313 ± 0.0205 | 0.931 |
| B | 0.0266 ± 0.0148 | 0.0250 ± 0.0190 | 0.255 |
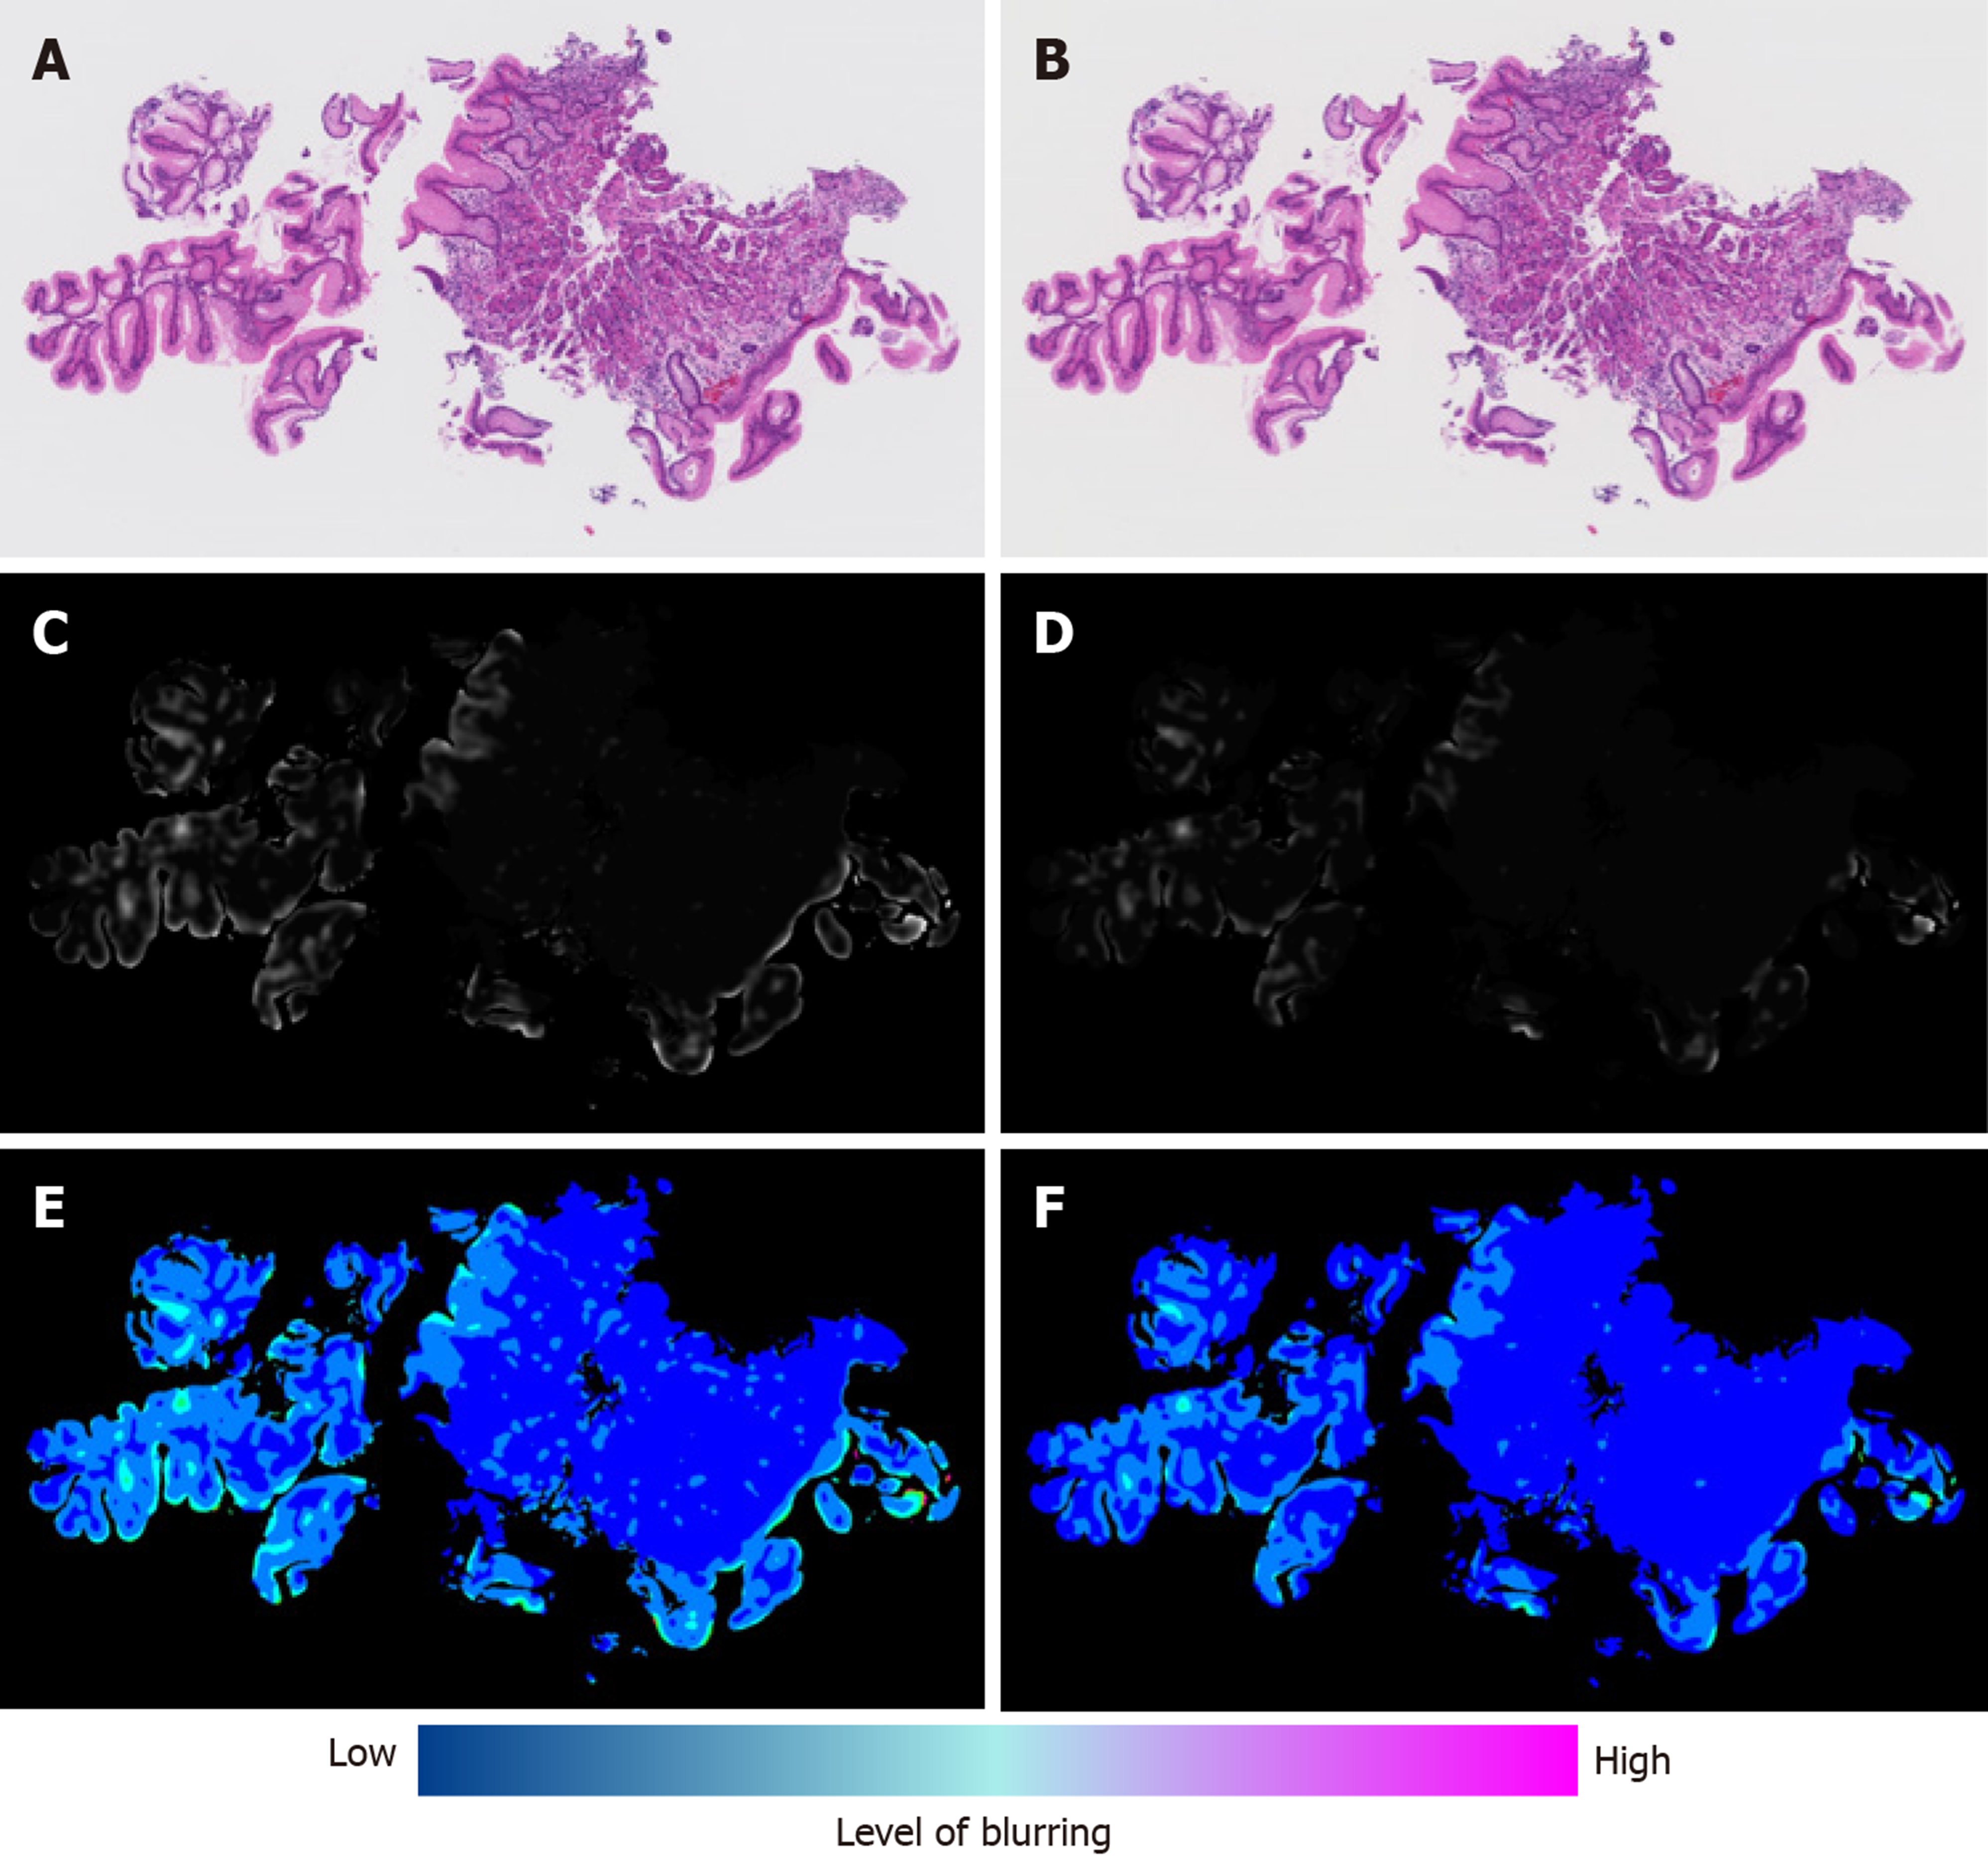
Next, we calculated the blur index of the paired DPIs and compared it between the non-flipped group and the flipped group. The flipped group showed a significantly higher blur index than the non-flipped group (Figure 2). Figure 3 shows a representative case of the flipped group’s results.
We observed 23.1% of discordant classification results between the paired DPIs obtained from two independent scans of the same microscope slide. Furthermore, we detected differences in blur (not color) of the paired DPIs as a potential cause of different classification results.
Differences in the colors of DPIs did not correlate with discordant classification results in this study. Since differences in the colors of digitized images reportedly result in different features of digitized images and different data matrices[7], we expected the difference in color to reduce reproducibility in our ML-aided classification model. However, the distribution of RGB value did not differ significantly between the paired DPIs and did not seem to cause discordant classification results. Nevertheless, color differences should be a concern because the color of HE stained slides obviously differed between different pathological laboratories. In such cases, a discordant classification result was observed in the same specimen with an identical pathological diagnosis (unpublished data). Therefore, even DPIs taken from the same microscope slide might show discordant classification results from obvious color changes due to the miscalibration of an imaging device.
Although qualitative changes in the blurs of the paired DPIs were macroscopically recognizable, their qualitative assessment was difficult. However, we developed a blur index that provided a quantitative comparison and detected the significant differences in blurs between the DPIs of the non-flipped group and those of the flipped group. Reportedly, blur can potentially influence the stability of features of a digitized image[7]; so, first, our study demonstrated that quantifying blurs revealed their impact on classification results.
A significant portion of cases showed discordant classification results; however, our ML-aided classification model worked efficiently for our intended purpose. 80.7% of all the flipped cases was non-tumor tissue, and 6.5% was carcinoma tissue. Our ML-aided classification model set a lower threshold than the best one (i.e., the threshold that yields a minimum error rate) because we made our model minimize false negative results, classifying carcinoma as non-tumor tissue. This lower threshold caused more frequent flipped cases in non-tumor tissue. In other words, the larger the percentage of non-tumor tissue included in the dataset, the greater the total number of flipped cases. Our dataset contained non-tumor tissue images 4.4 times more than cancerous tissue images, so the total number of flipped cases increased. Slide scanners have been broadly used to obtain DPIs for ML-aided image analysis, so the issue of blurring should be mentioned more in the implementation of DPI analysis and in the development of more robust ML-aided classification models.
This study had some limitations. First, the robustness of a classification model for DPIs differs depending on the objects being analyzed, the method of machine-learning, and the quality and quantity of the dataset for learning. Therefore, the issue mentioned above should not be overgeneralized. However, a classification model for medical images (including DPI) should be tested to find if image blur might reduce reproducibility of the classification model. Second, we only investigated differences in color and blur in this study, while there may be another potential cause of discordant classification.
In conclusion, our findings suggest that differences in the blur in paired DPIs from the same microscope slide could cause different classification results by an ML-aided classification model. If an ML model has sufficient robustness, these slight differences in DPI might not cause a different classification result. However, an ML-aided classification model for DPI should be tested for this potential cause of the reduced reproducibility of the model. Since our method provides a quantitative measure for the degree of blurring, it is possible to avoid discordance through excluding these disqualified slides using this measure. However, further experiments are required to establish more reliable measure together with other factors, for instance, such as tissue area size and nuclear densities. In a future study, we will develop a slide scanner and/or a preprocessing method that will minimize DPI blur.
Little attention has been paid to the frequency and preventable causes of discordant classification results of digital pathological image (DPI) analysis using machine learning (ML) for the heterochronously obtained DPIs.
Authors compared the classification results between paired DPIs of the same microscope slide obtained from two independent scans using the same slide scanner.
In this study, the authors elucidated the frequency and preventable causes of discordant classification results of DPI analysis using ML for the heterochronously obtained DPIs.
Authors created paired DPIs by scanning 298 hematoxylin and eosin stained slides containing 584 tissues twice with a virtual slide scanner. The paired DPIs were analyzed by our ML-aided classification model. Differences in color and blur between the non-flipped and flipped groups were compared by L1-norm and a blur index.
Discordant classification results in 23.1% of the paired DPIs obtained by two independent scans of the same microscope slide were observed. No significant difference in the L1-norm of each color channel between the two groups; however, the flipped group showed a significantly higher blur index than the non-flipped group.
The results suggest that differences in the blur - not the color - of the paired DPIs may cause discordant classification results.
An ML-aided classification model for DPI should be tested for this potential cause of the reduced reproducibility of the model. In a future study, a slide scanner and/or a preprocessing method of minimizing DPI blur should be developed.
Authors (Ogura M and Kiyuna T) would like to thank Dr. Yukako Yagi, Memorial Sloan Kettering Cancer Center, and Professor Masahiro Yamaguchi, Tokyo Institute of Technology, for their helpful comments and suggestions.
Manuscript source: Invited manuscript
Specialty type: Oncology
Country/Territory of origin: Japan
Peer-review report’s scientific quality classification
Grade A (Excellent): 0
Grade B (Very good): 0
Grade C (Good): C, C
Grade D (Fair): 0
Grade E (Poor): 0
P-Reviewer: Youness RA, Zhang K S-Editor: Wang JL L-Editor: A E-Editor: Liu JH
| 1. | Al-Janabi S, Huisman A, Van Diest PJ. Digital pathology: current status and future perspectives. Histopathology. 2012;61:1-9. [RCA] [PubMed] [DOI] [Full Text] [Cited by in Crossref: 220] [Cited by in RCA: 222] [Article Influence: 15.9] [Reference Citation Analysis (0)] |
| 2. | Park S, Parwani AV, Aller RD, Banach L, Becich MJ, Borkenfeld S, Carter AB, Friedman BA, Rojo MG, Georgiou A, Kayser G, Kayser K, Legg M, Naugler C, Sawai T, Weiner H, Winsten D, Pantanowitz L. The history of pathology informatics: A global perspective. J Pathol Inform. 2013;4:7. [RCA] [PubMed] [DOI] [Full Text] [Full Text (PDF)] [Cited by in Crossref: 48] [Cited by in RCA: 42] [Article Influence: 3.5] [Reference Citation Analysis (0)] |
| 3. | Coudray N, Ocampo PS, Sakellaropoulos T, Narula N, Snuderl M, Fenyö D, Moreira AL, Razavian N, Tsirigos A. Classification and mutation prediction from non-small cell lung cancer histopathology images using deep learning. Nat Med. 2018;24:1559-1567. [RCA] [PubMed] [DOI] [Full Text] [Cited by in Crossref: 1224] [Cited by in RCA: 1533] [Article Influence: 219.0] [Reference Citation Analysis (0)] |
| 4. | Cosatto E, Laquerre PF, Malon C, Graf HP, Saito A, Kiyuna T, Marugame A, Kamijo K. Automated gastric cancer diagnosis on H&E-stained sections; ltraining a classifier on a large scale with multiple instance machine learning. Proceedings of SPIE 8676, Medical Imaging 2013: Digital Pathology, 867605; 2013 Mar 29; Florida, USA. [DOI] [Full Text] |
| 5. | Yoshida H, Shimazu T, Kiyuna T, Marugame A, Yamashita Y, Cosatto E, Taniguchi H, Sekine S, Ochiai A. Automated histological classification of whole-slide images of gastric biopsy specimens. Gastric Cancer. 2018;21:249-257. [RCA] [PubMed] [DOI] [Full Text] [Cited by in Crossref: 63] [Cited by in RCA: 72] [Article Influence: 10.3] [Reference Citation Analysis (0)] |
| 6. | Yang G, Nelson BJ. Wavelet-based autofocusing and unsupervised segmentation of microscopic images. Proceedings. Proceedings 2003 IEEE/RSJ International Conference on Intelligent Robots and Systems (IROS 2003) (Cat. No.03CH37453); 2003 Oct 27-31; Las Vegas, USA. IEEE, 2003: 2143-2148. [DOI] [Full Text] |
| 7. | Aziz MA, Nakamura T, Yamaguchi M, Kiyuna T, Yamashita Y, Abe T, Hashiguchi A, Sakamoto M. Effectiveness of color correction on the quantitative analysis of histopathological images acquired by different whole-slide scanners. Artif Life Robotics. 2019;24:28-37. [RCA] [DOI] [Full Text] [Cited by in Crossref: 2] [Cited by in RCA: 2] [Article Influence: 0.3] [Reference Citation Analysis (0)] |


