Copyright
©The Author(s) 2020.
Artif Intell Cancer. Jun 28, 2020; 1(1): 31-38
Published online Jun 28, 2020. doi: 10.35713/aic.v1.i1.31
Published online Jun 28, 2020. doi: 10.35713/aic.v1.i1.31
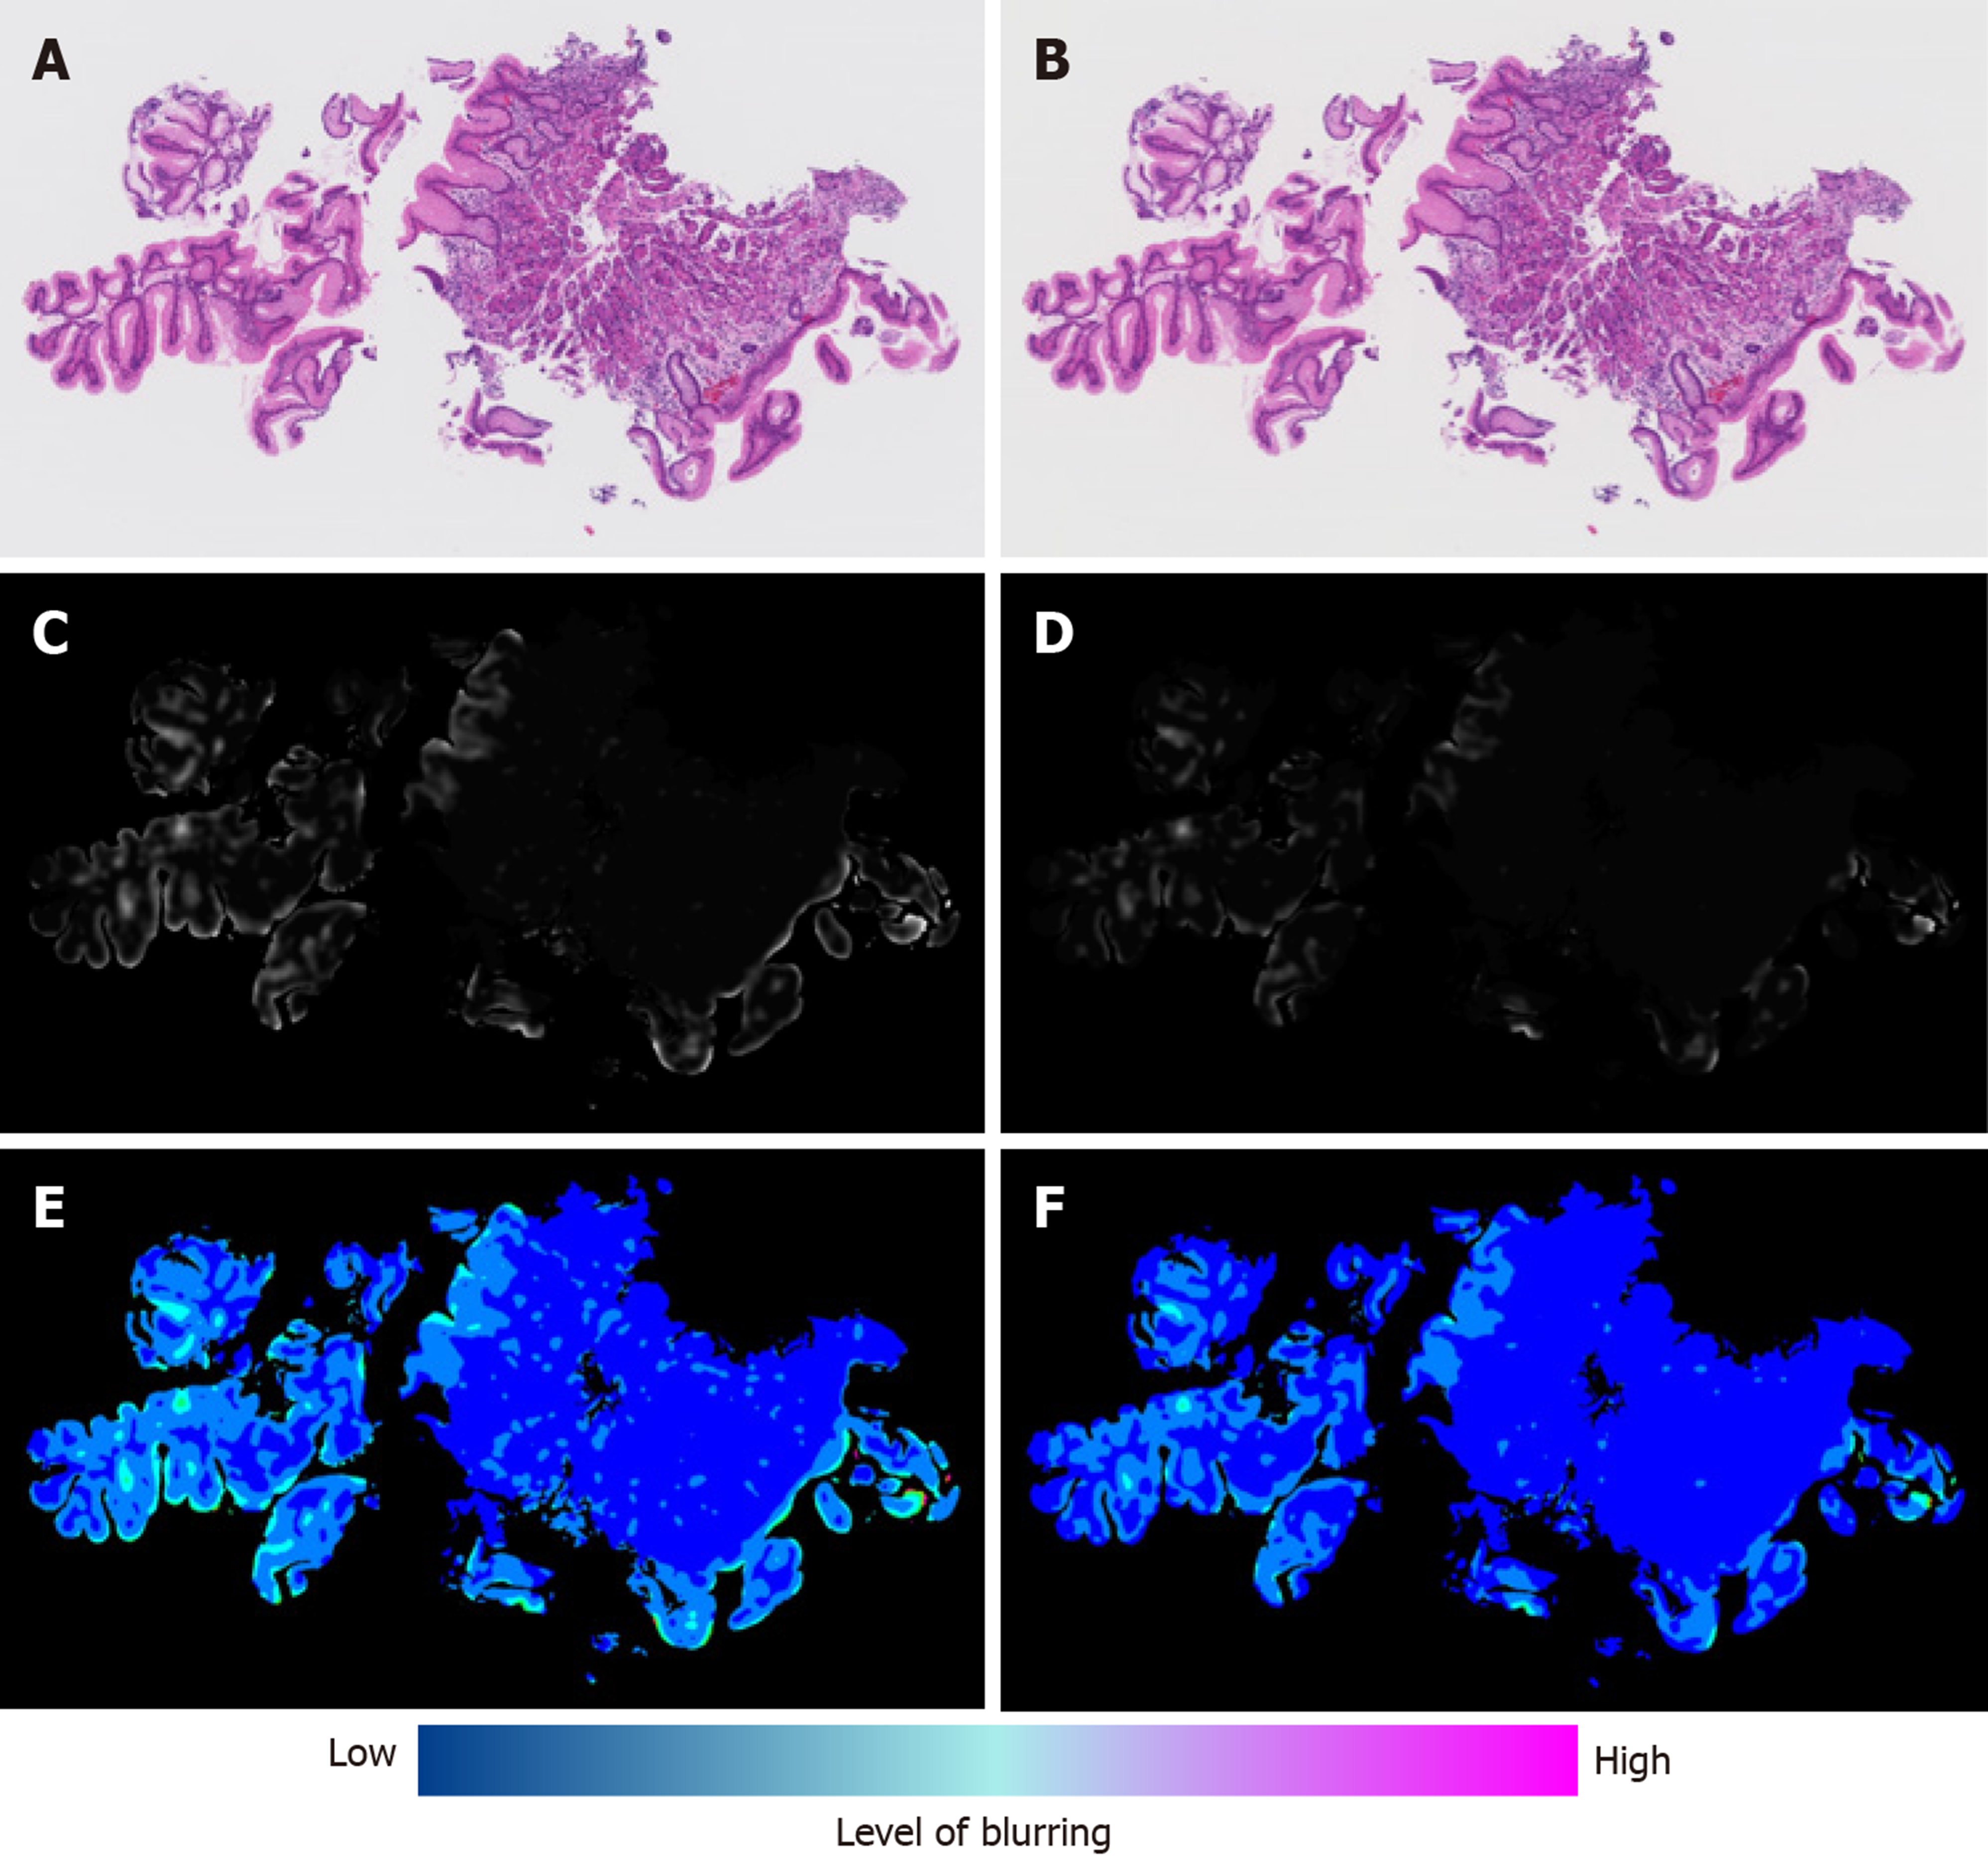
Figure 3 Typical examples of differences in the blurring level.
A: Whole-slide image at the first scan; B: Whole-slide image at the second scan; C: The blurring level at the first scan (blur index = 115); D: The blurring level at the second scan (blur index = 78); E: A heat map representation of the blurring level at the first scan; F: A heat map representation of the blurring level at the second scan.
- Citation: Ogura M, Kiyuna T, Yoshida H. Impact of blurs on machine-learning aided digital pathology image analysis. Artif Intell Cancer 2020; 1(1): 31-38
- URL: https://www.wjgnet.com/2644-3228/full/v1/i1/31.htm
- DOI: https://dx.doi.org/10.35713/aic.v1.i1.31


