Copyright
©The Author(s) 2022.
World J Clin Cases. Aug 16, 2022; 10(23): 8304-8311
Published online Aug 16, 2022. doi: 10.12998/wjcc.v10.i23.8304
Published online Aug 16, 2022. doi: 10.12998/wjcc.v10.i23.8304
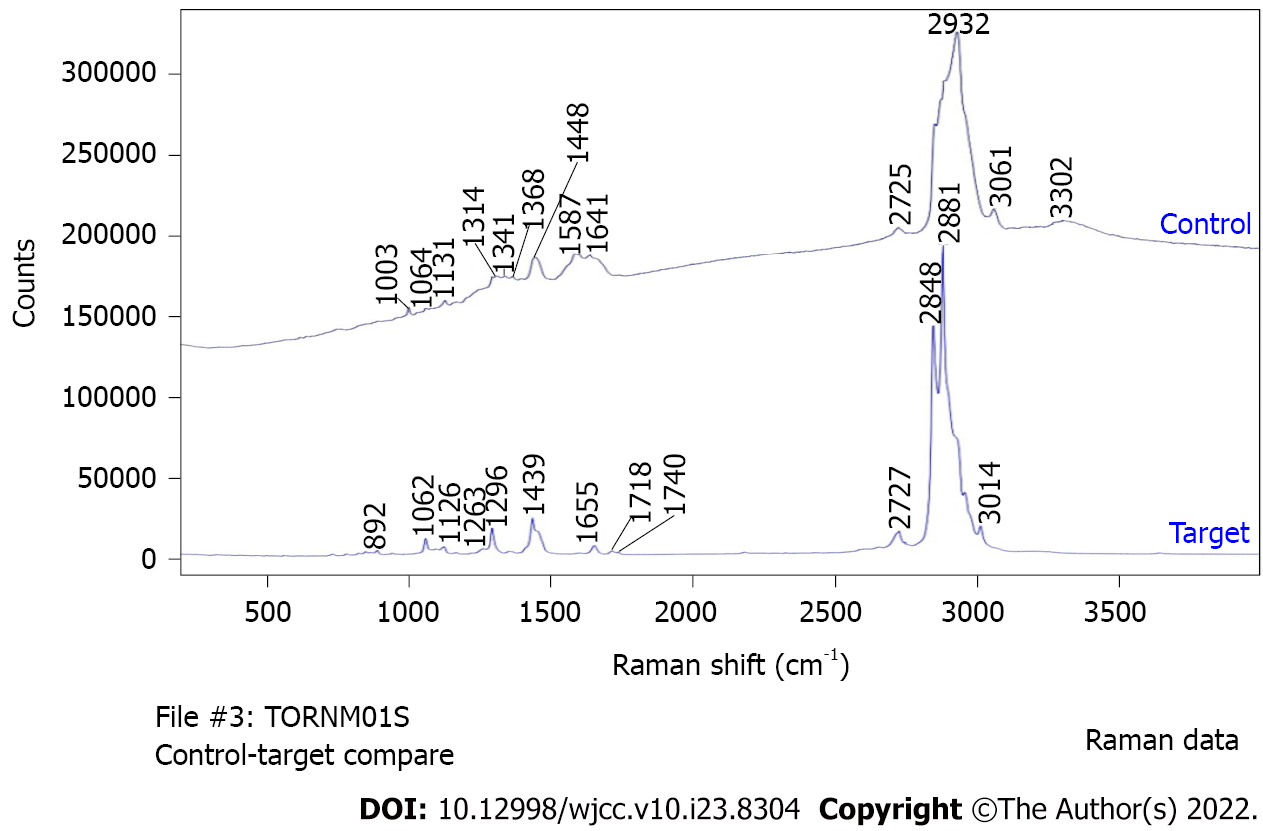
Figure 5 Raman spectra of the target and control areas.
The following peaks are seen in the target area: 1000-1300 cm-1, P-O and P=O bonds of phosphate (partially overlapping with the alkyl group signal); 1400-12800 cm-1, C-H bonds of saturated hydrocarbon groups; 1600-13800 cm-1, C=C bonds of unsaturated hydrocarbons; 1700 cm-1, C=O bonds of esters.
- Citation: Ohkura Y, Uruga H, Shiiba M, Ito S, Shimoyama H, Ishihara M, Ueno M, Udagawa H. Phosphoglyceride crystal deposition disease requiring differential diagnosis from malignant tumors and confirmed by Raman spectroscopy: A case report. World J Clin Cases 2022; 10(23): 8304-8311
- URL: https://www.wjgnet.com/2307-8960/full/v10/i23/8304.htm
- DOI: https://dx.doi.org/10.12998/wjcc.v10.i23.8304


