Copyright
©The Author(s) 2021.
World J Clin Cases. Mar 6, 2021; 9(7): 1682-1695
Published online Mar 6, 2021. doi: 10.12998/wjcc.v9.i7.1682
Published online Mar 6, 2021. doi: 10.12998/wjcc.v9.i7.1682
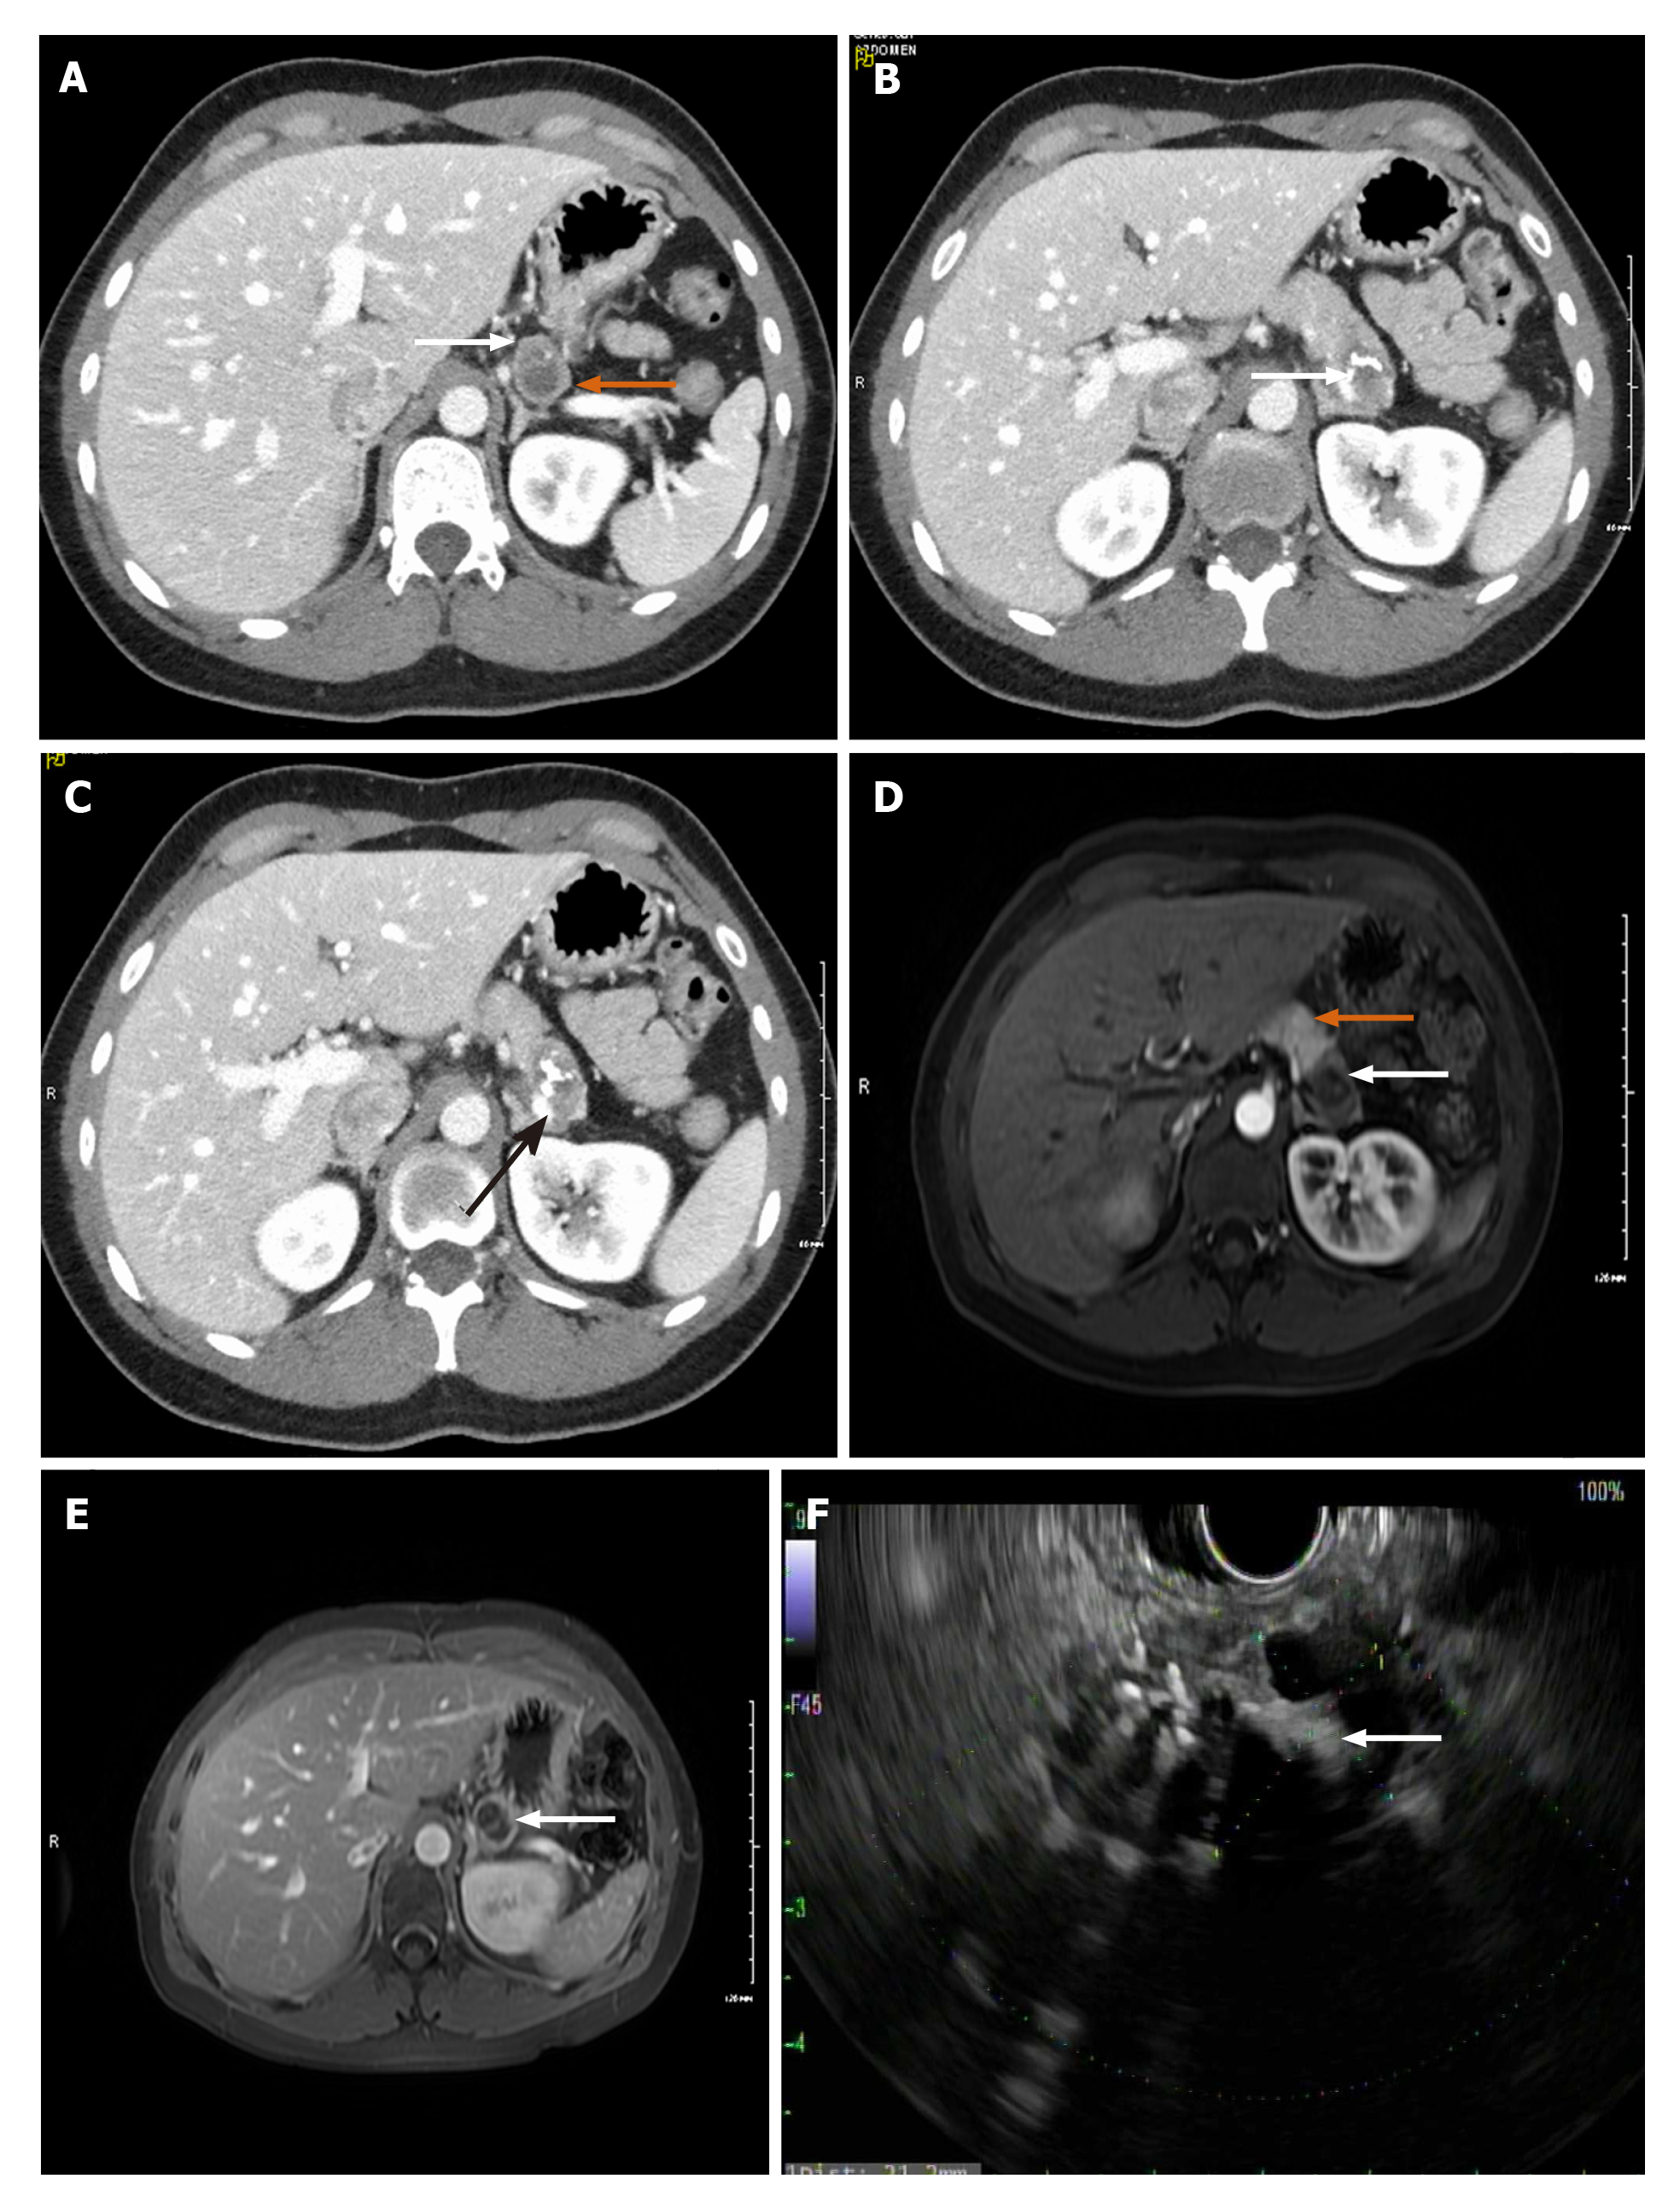
Figure 1 Complex, cystic and solid mass in the pancreatic tail.
A: Axial computed tomography with IV contrast showing a bilobed hypodense lesion with superior and inferior components with peripheral thick rim of enhancement. White arrow: Showing solid component. Orange arrow: Inferior cystic component; B: White arrow: Calcification within tumor; C: Black arrow: Compression of splenic vein by mass effect from tumor; D: Arterial phase magnetic resonance imaging (MRI) image. White arrow: Showing the tumor. Orange arrow: Normal pancreatic tissue; E: MRI post gadolinium study, white arrow: Thick peripheral solid enhancing component with central non-enhancing cystic component with internal septation; F: Solid and cystic mass on endoscopic ultrasound.
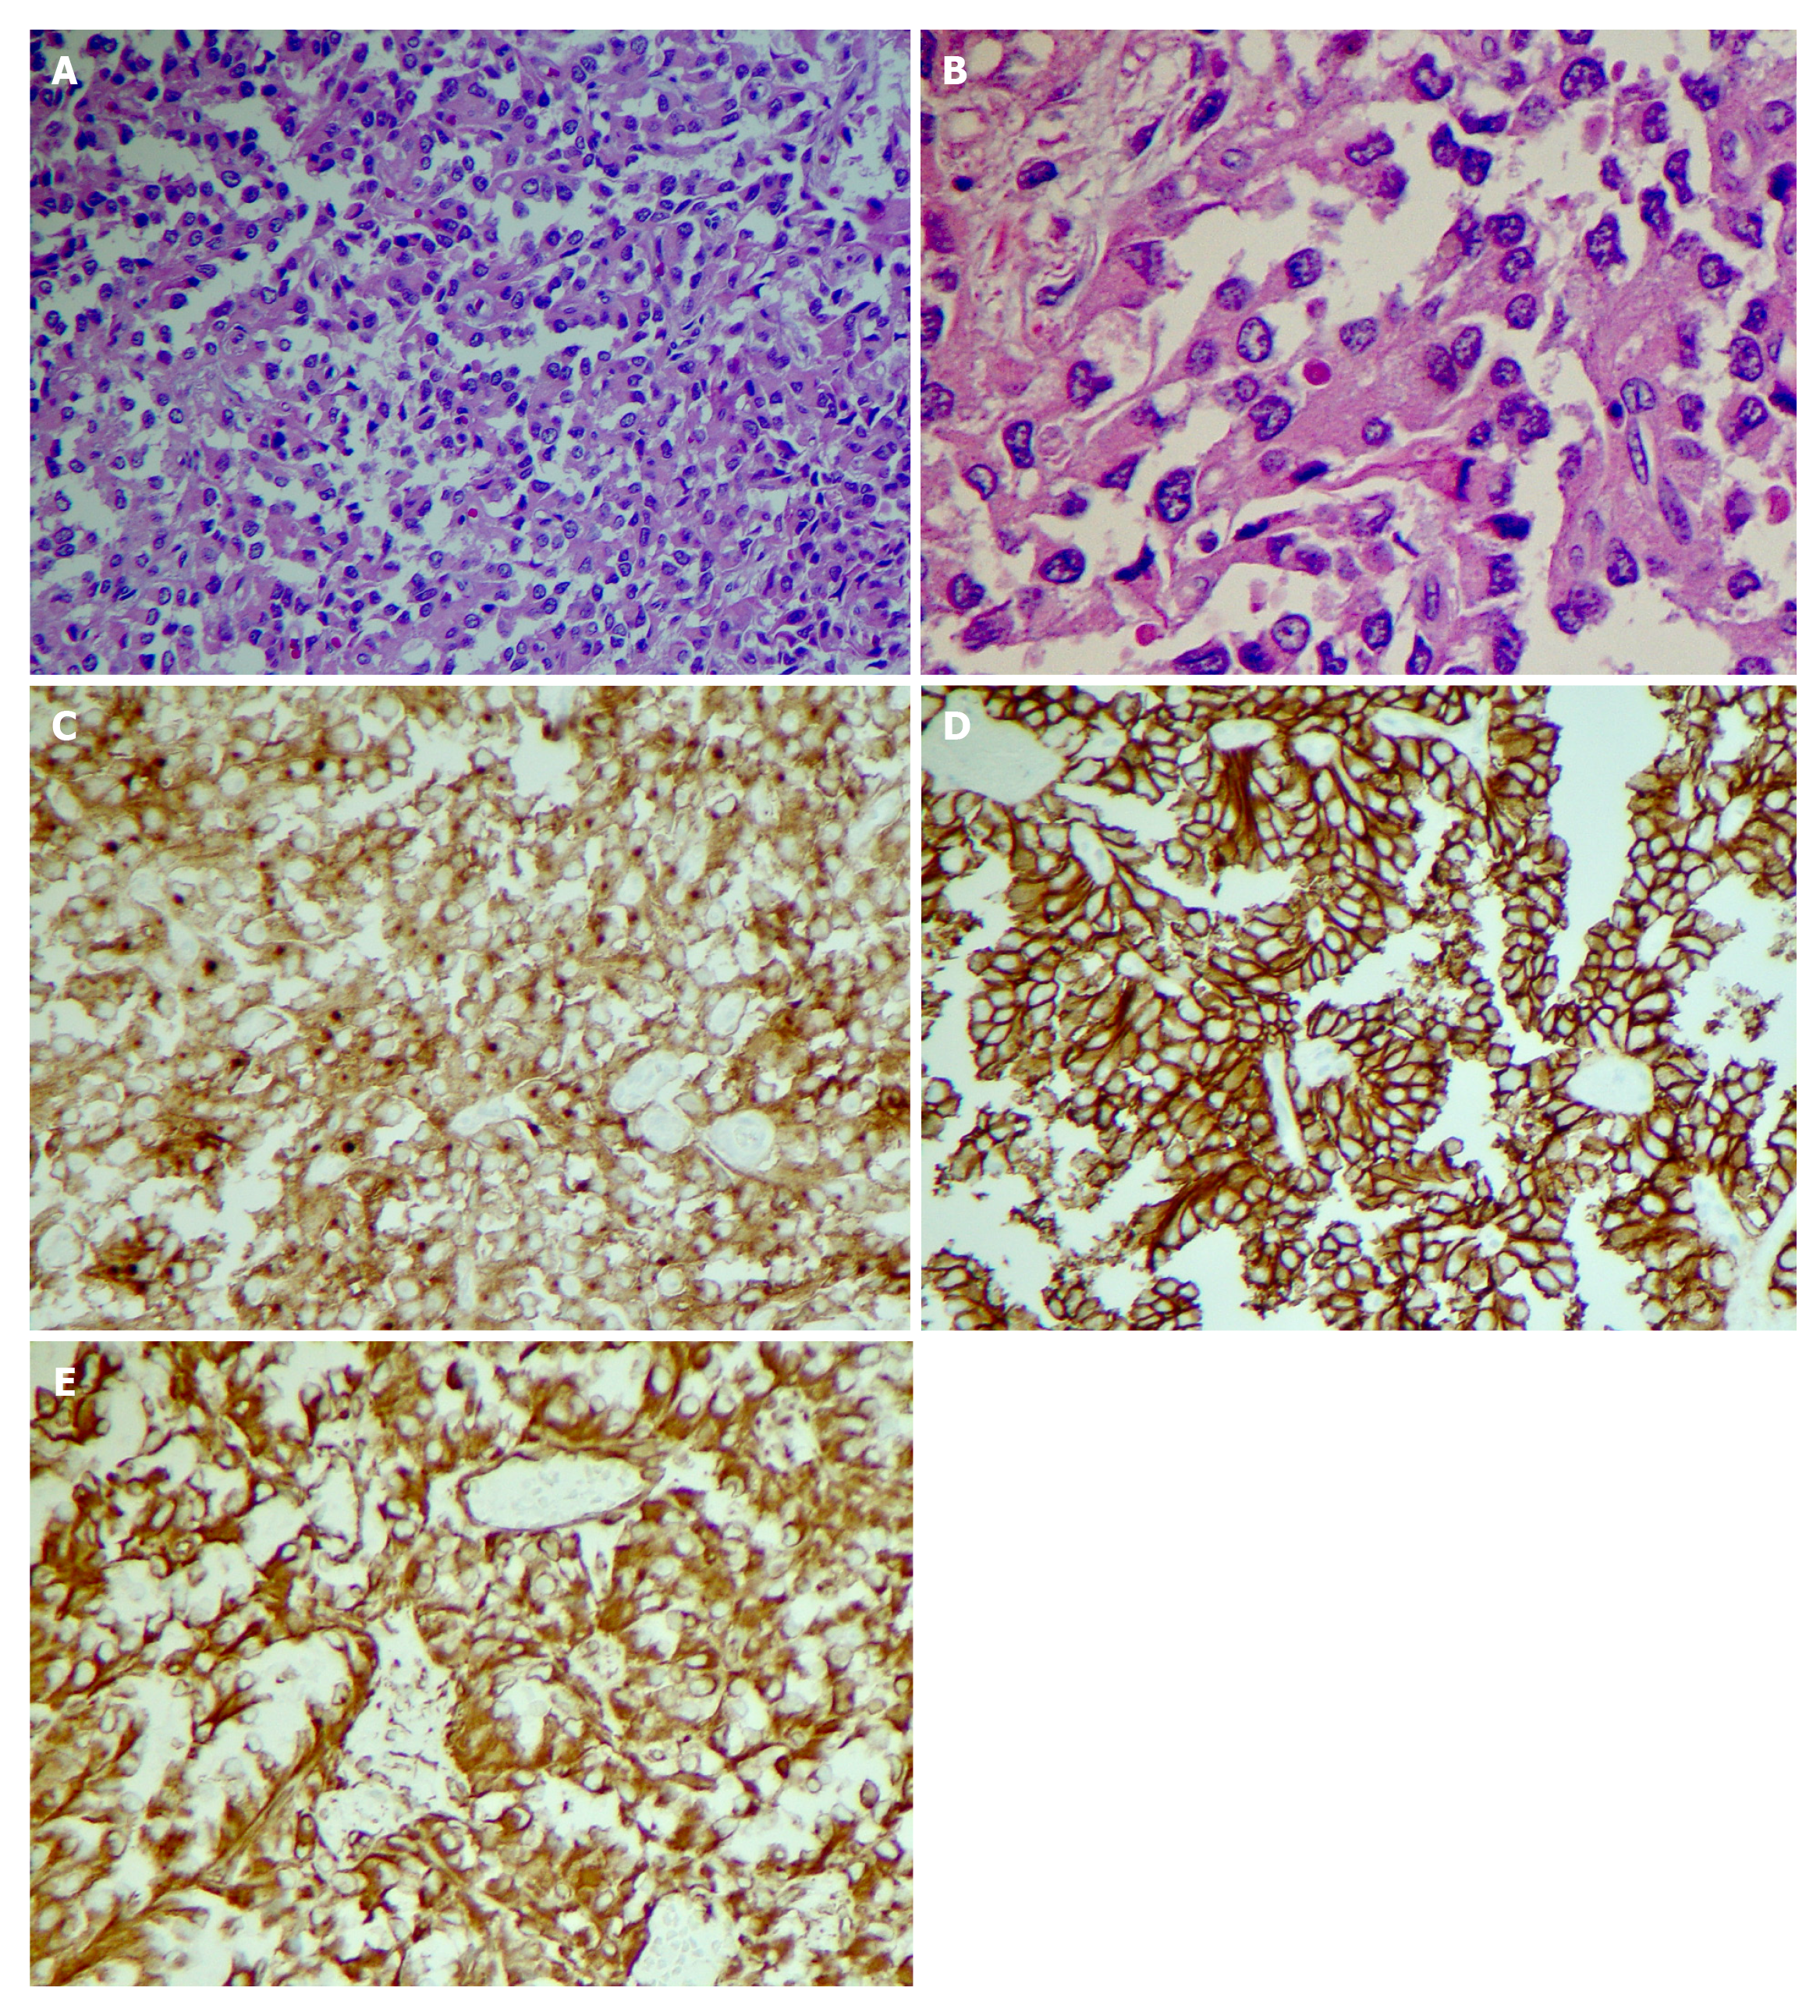
Figure 2 Pathological phenomena.
Histology shows solid areas with poorly cohesive cells forming cuff around blood vessels resulting in a pseudopapillary architecture. Tumor cells show uniform nuclei with finely textured chromatin, inconspicuous nucleoli and occasional longitudinal grooves. A: × 20 magnification; B: × 40 magnification; C: CD 10 positive; D: CD 56 positive; E: Vimentin positive.
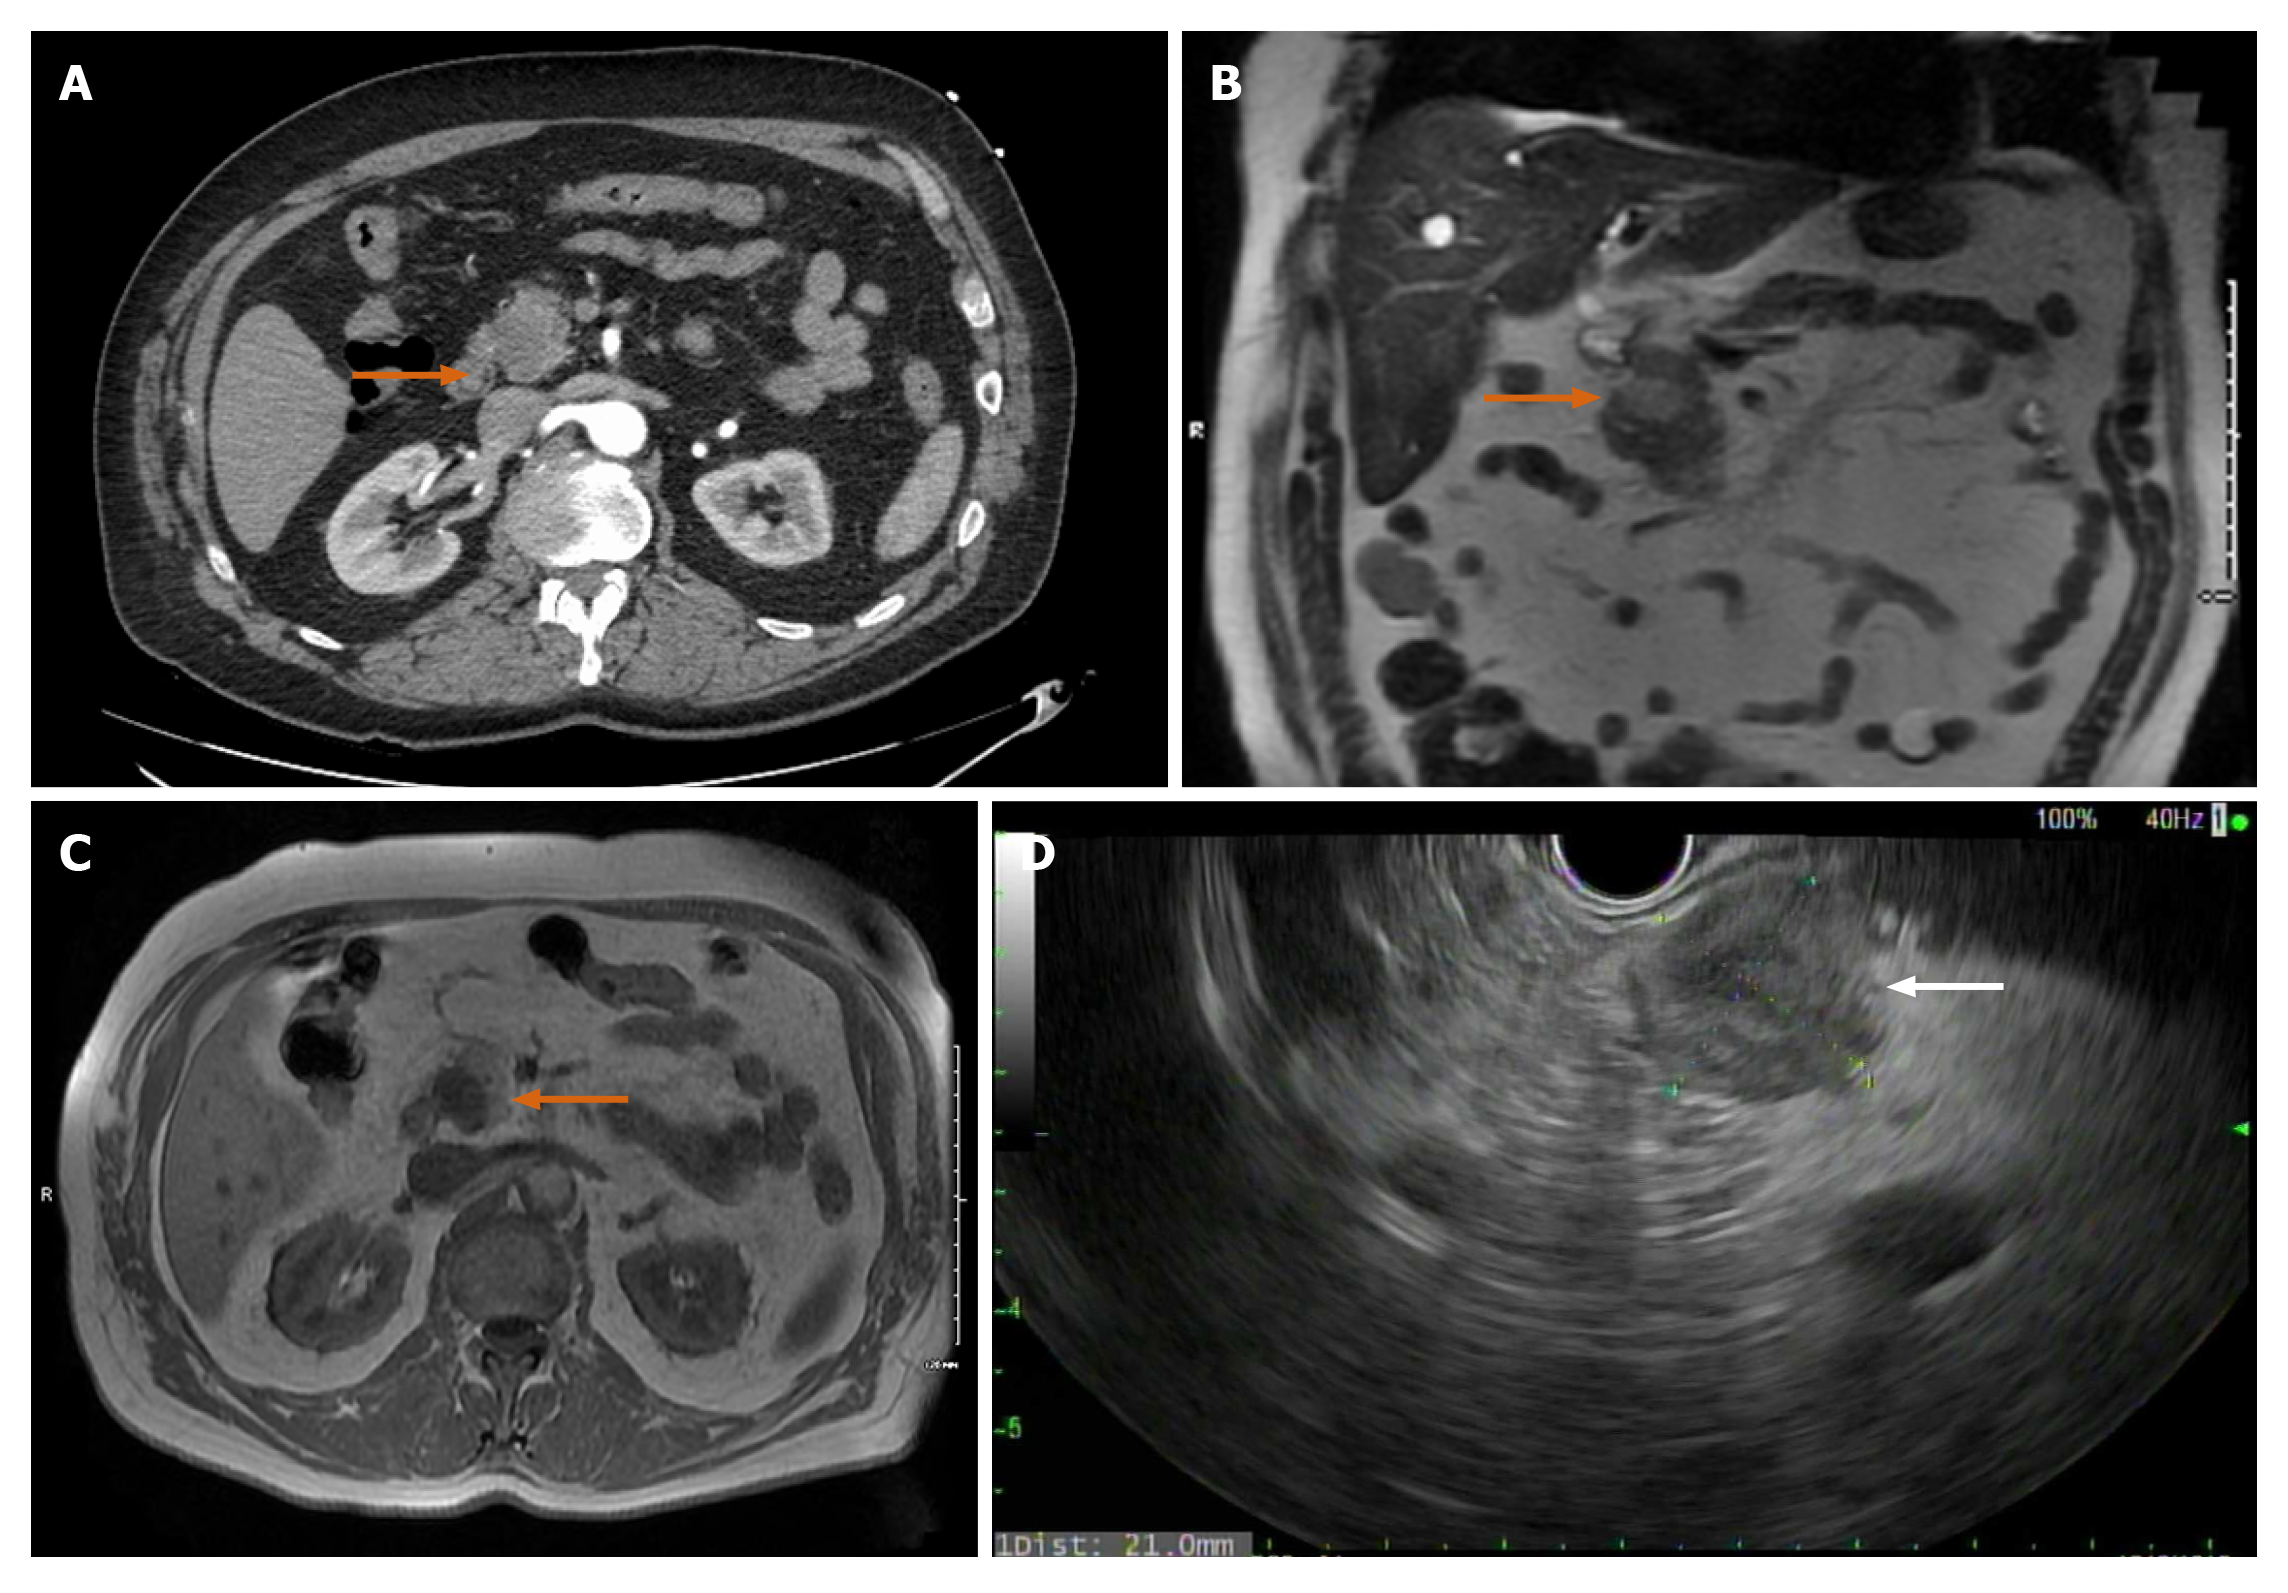
Figure 3 Abdominal computed tomography angiography.
A: Computed tomography angiography showing 2.3 cm hypodense lesion in head of pancreas; B: Magnetic resonance imaging (MRI) axial view, T1. Arrow: Mass appears as a hypointense lesion; C: Coronal MRI T2 tumor is hyperintense and solid; D: Endoscopic Ultrasound showing hypoechoic mass in pancreatic head.
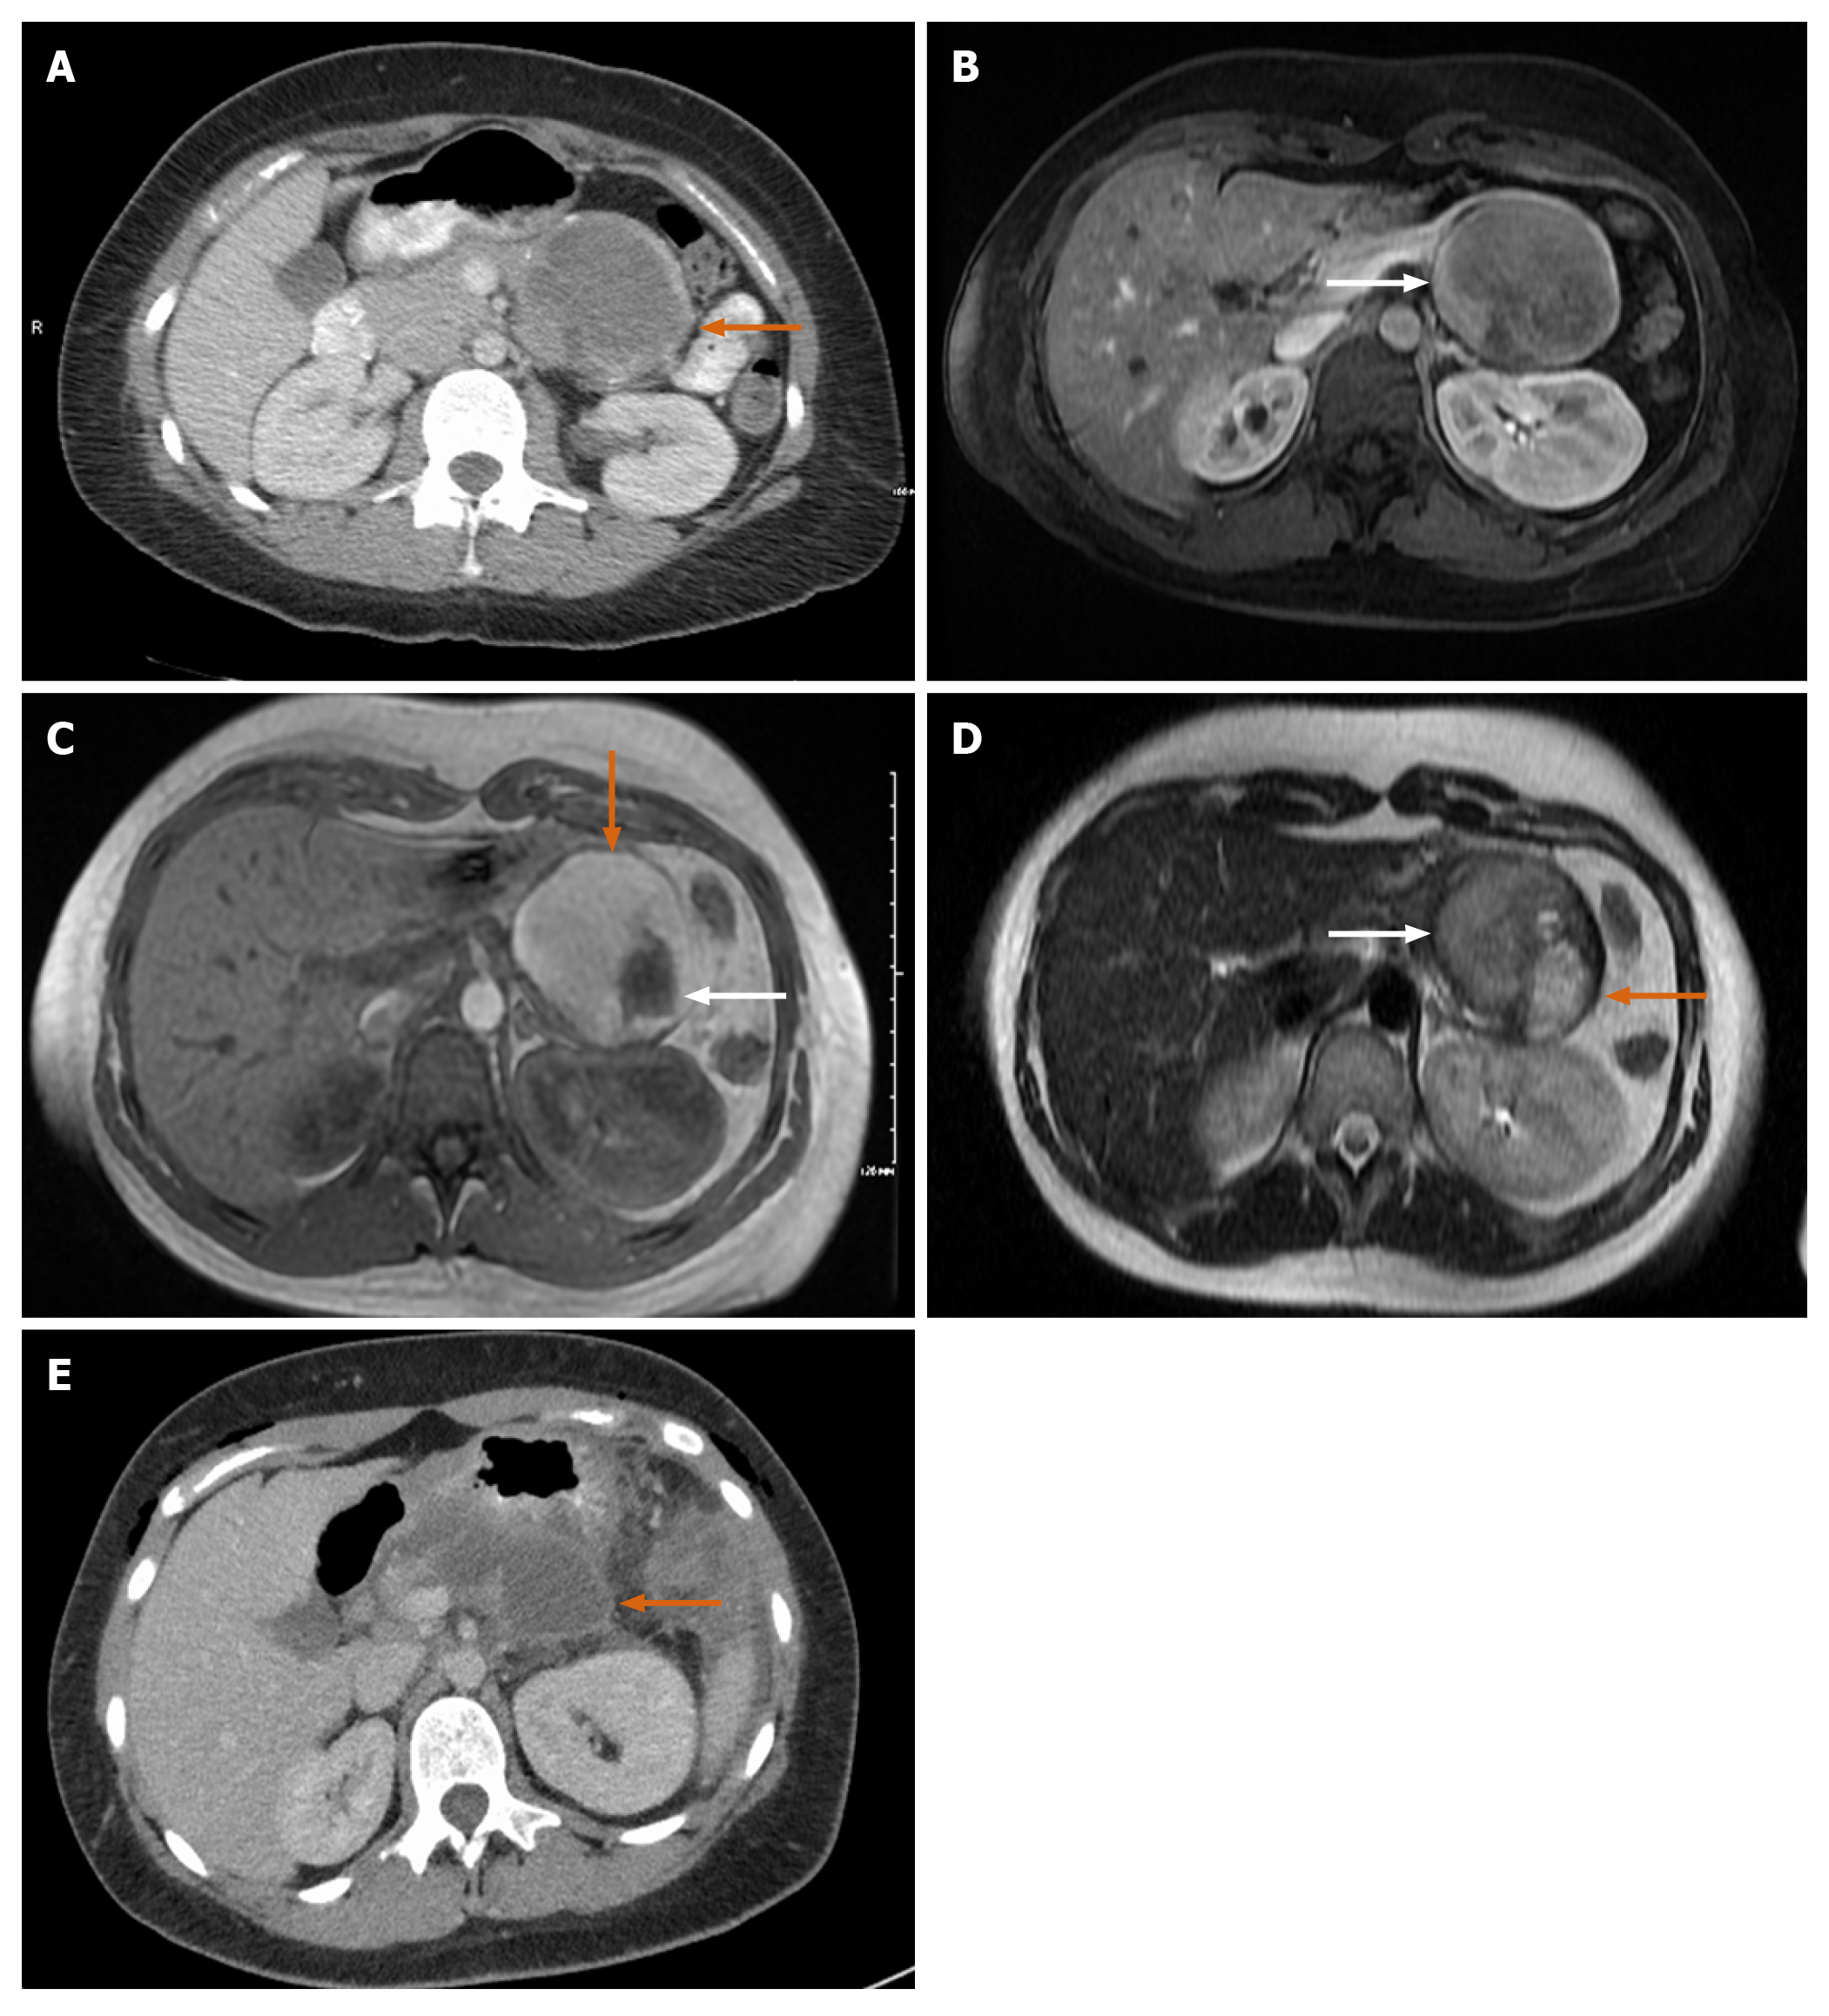
Figure 4 Magnetic resonance imaging.
A: Large mass with rim of calcification; B: Axial T1 image. White arrow: Solid enhancing component of the tumor; C: Magnetic resonance imaging (MRI) T1 post gadolinium image, orange arrow: Large mass with bright T1 hyperintense signal; white arrow: Changes inside mass appear as hypointense; D: Axial T2 MRI white arrow: Heterogenous T2 signal in conjunction with the bright T1 signal (orange arrow in image C) is consistent with internal hemorrhage; orange arrow: T2 hyperintense in conjunction with hypointense appearance (white arrow in image C) correlates with a cystic component of the mass; E: 6 cm hypodensity with rim enhancement and central hyperdense contents representing post-surgical fluid collection.
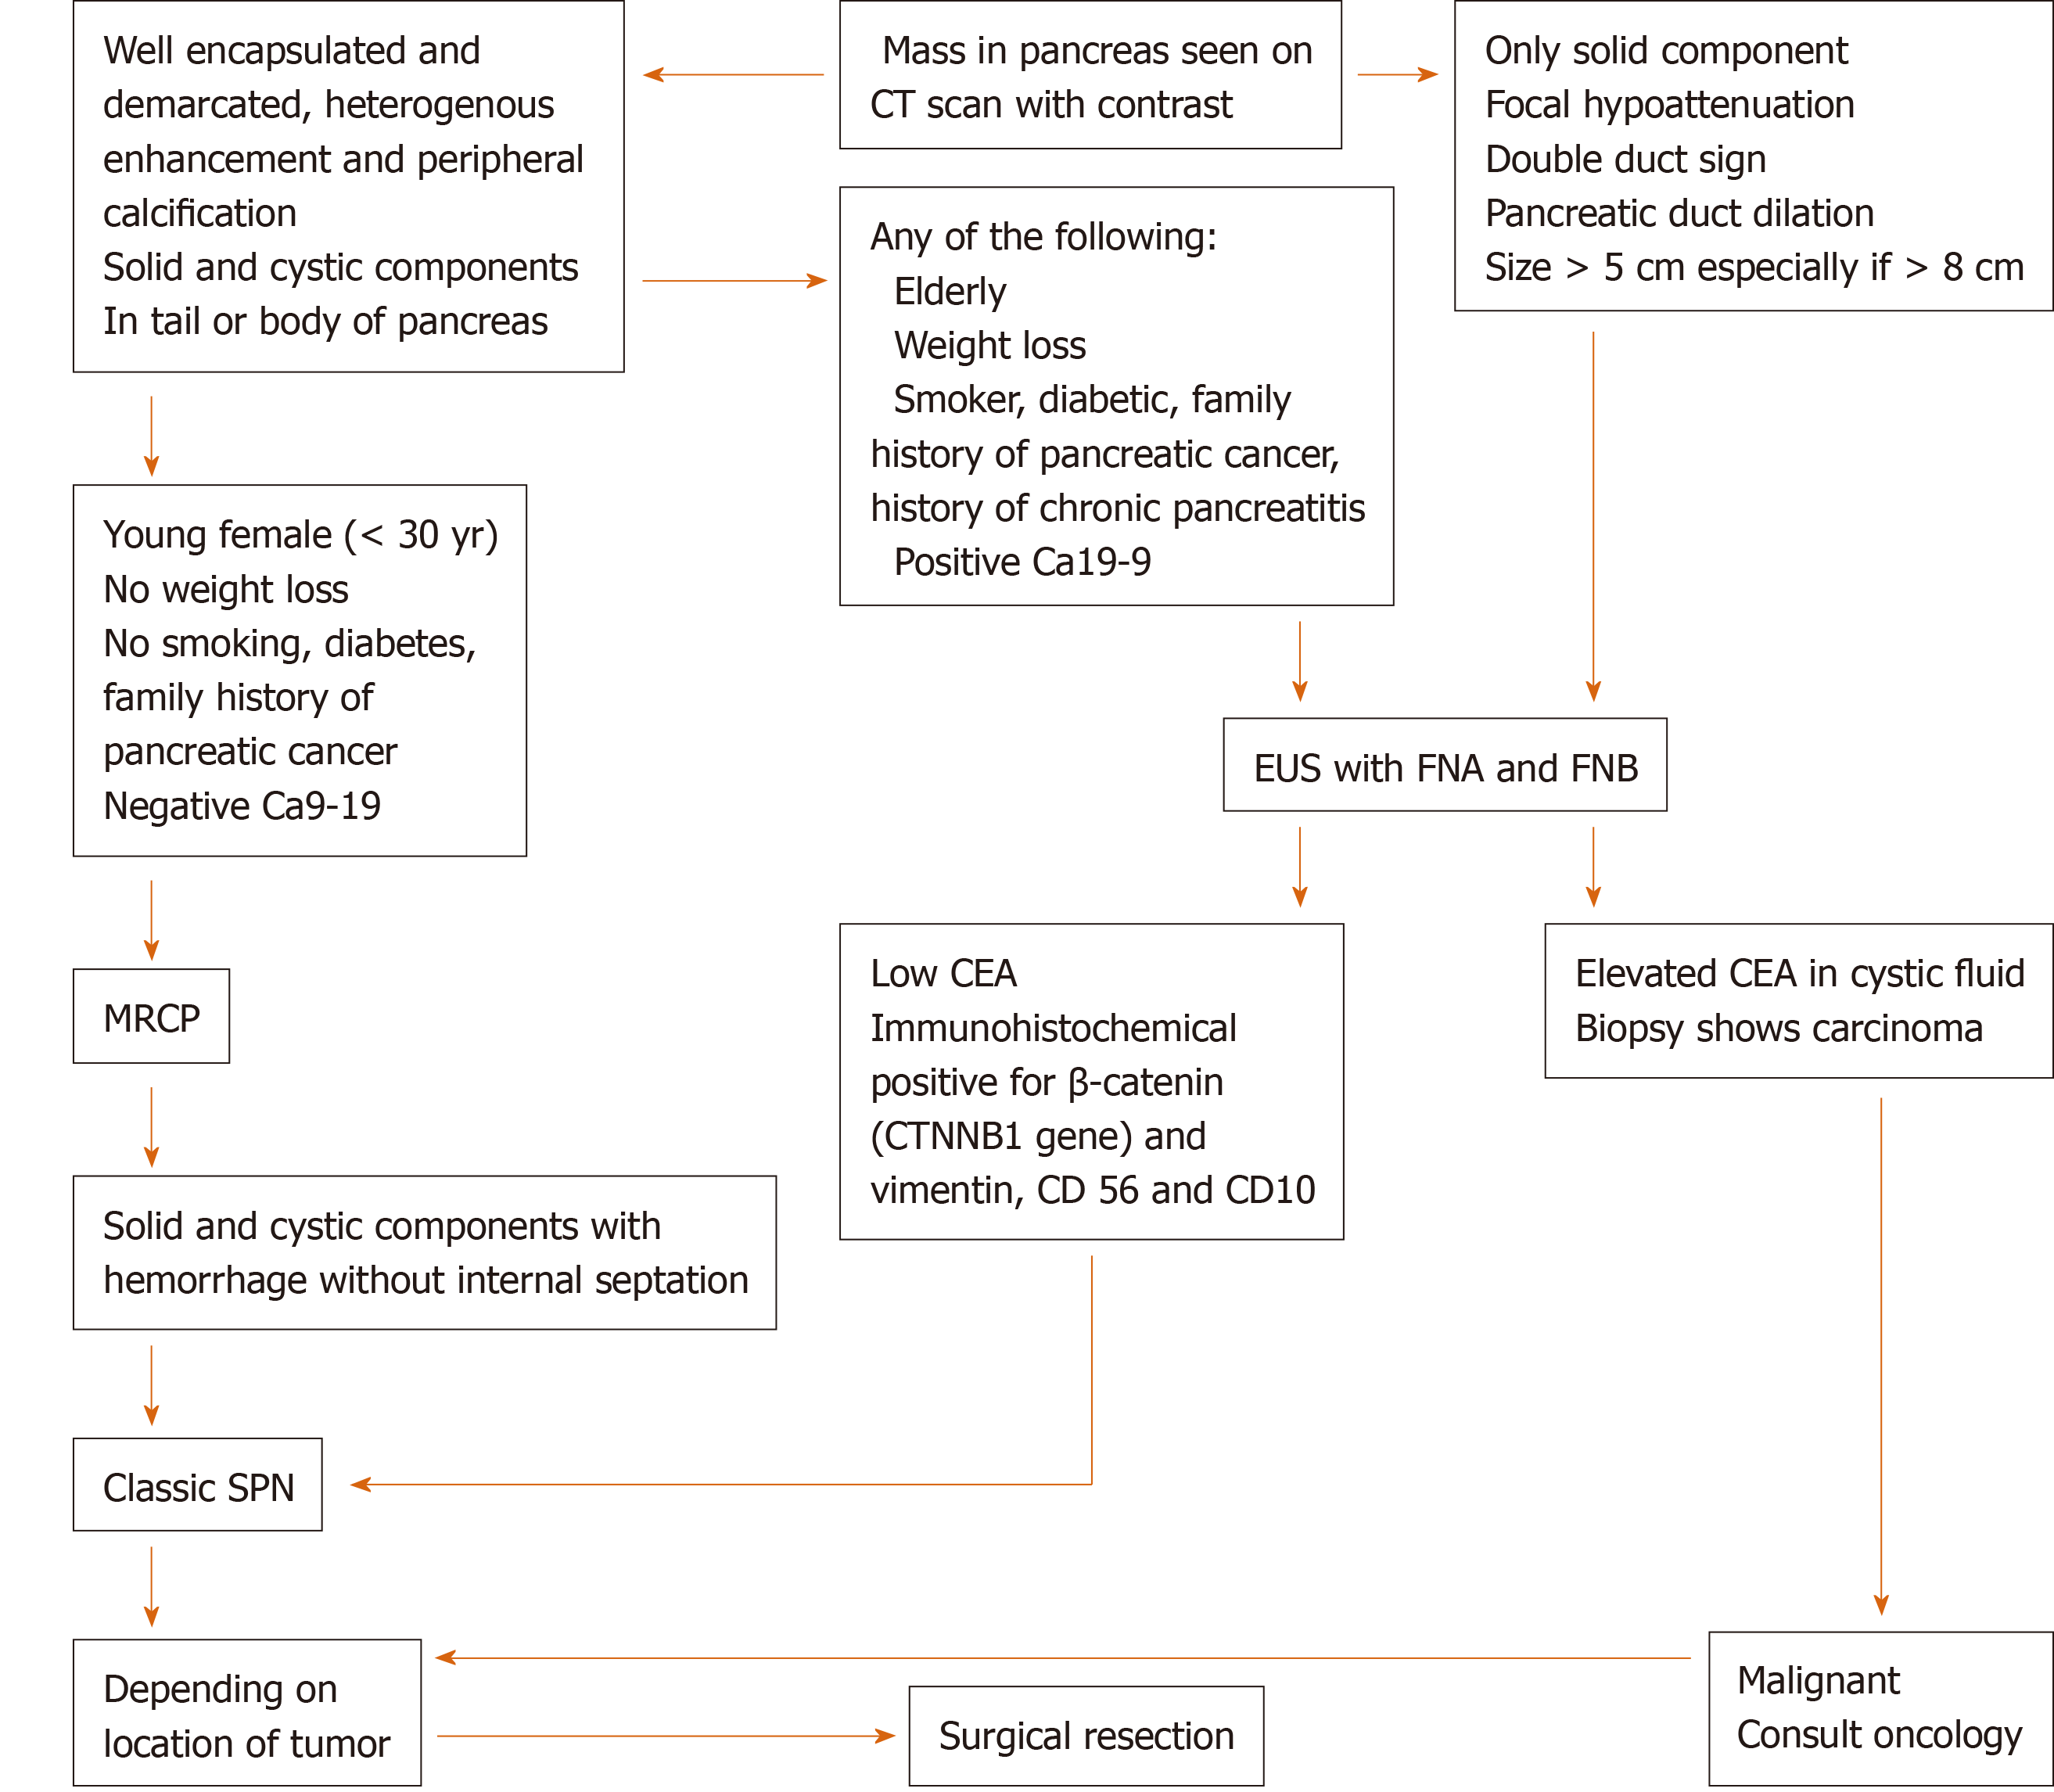
Figure 5 Endoscopic ultrasound with fine needle aspiration and biopsy is often performed to differentiate solid pseudopapillary neoplasm from other cystic lesions should the diagnosis remain unclear after initial evaluation with computed tomography and/or magnetic resonance imaging.
CT: Computed tomography; EUS: Endoscopic Ultrasound; FNA: Fine needle aspiration; FNB: Fine needle biopsy; MRCP: Magnetic resonance cholangiopancreatography; SPN: Solid pseudopapillary neoplasm; CEA: Carcinoembryonic antigen.
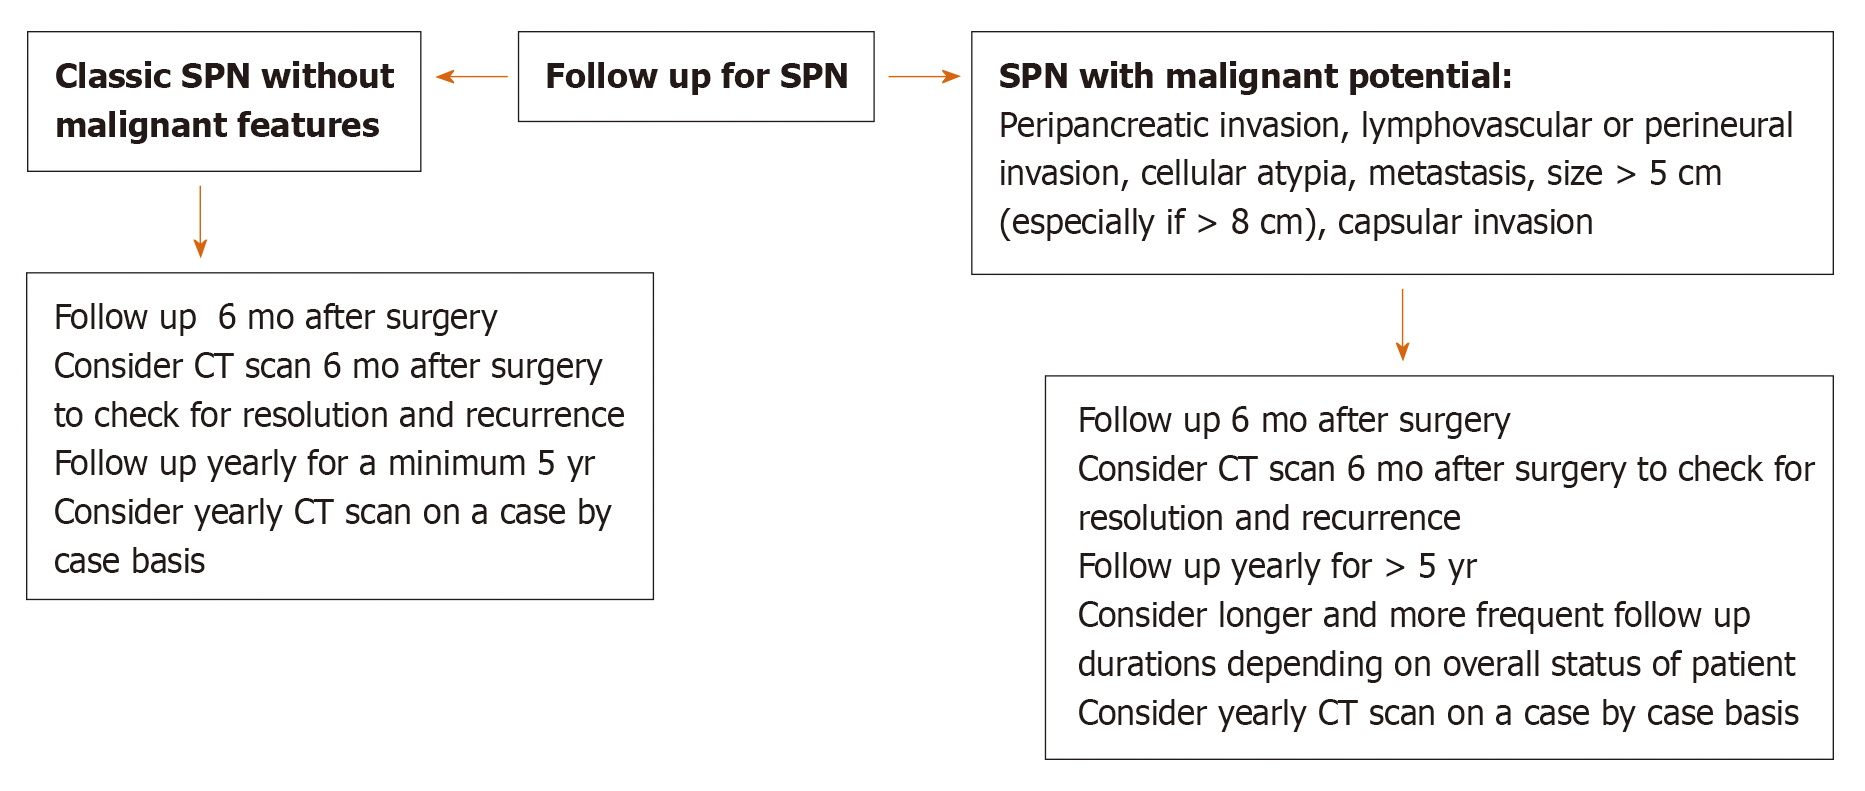
Figure 6 Based on the demographic and imaging characteristics of the solid pseudopapillary neoplasm tumors, we created an algorithm for the diagnosis, management, and post-surgical follow-up in order to avoid unnecessary testing and avoid misdiagnosing a malignant neoplasm in preoperative evaluation.
SPN: Solid pseudopapillary neoplasm; CT: Computed tomography.
- Citation: Abudalou M, Vega EA, Dhingra R, Holzwanger E, Krishnan S, Kondratiev S, Niakosari A, Conrad C, Stallwood CG. Solid pseudopapillary neoplasm-diagnostic approach and post-surgical follow up: Three case reports and review of literature. World J Clin Cases 2021; 9(7): 1682-1695
- URL: https://www.wjgnet.com/2307-8960/full/v9/i7/1682.htm
- DOI: https://dx.doi.org/10.12998/wjcc.v9.i7.1682


