Copyright
©The Author(s) 2021.
World J Clin Cases. Dec 16, 2021; 9(35): 11102-11107
Published online Dec 16, 2021. doi: 10.12998/wjcc.v9.i35.11102
Published online Dec 16, 2021. doi: 10.12998/wjcc.v9.i35.11102
Figure 1 Echocardiography images.
A: Echocardiography in case 1 demonstrated apical hypertrophy (18.7 mm; white arrows) without apical aneurysm and a normal left ventricular ejection fraction (LVEF); B: Echocardiography in case 2 revealed apical hypertrophy (20.1 mm; white arrows) without apical aneurysm and a normal LVEF.
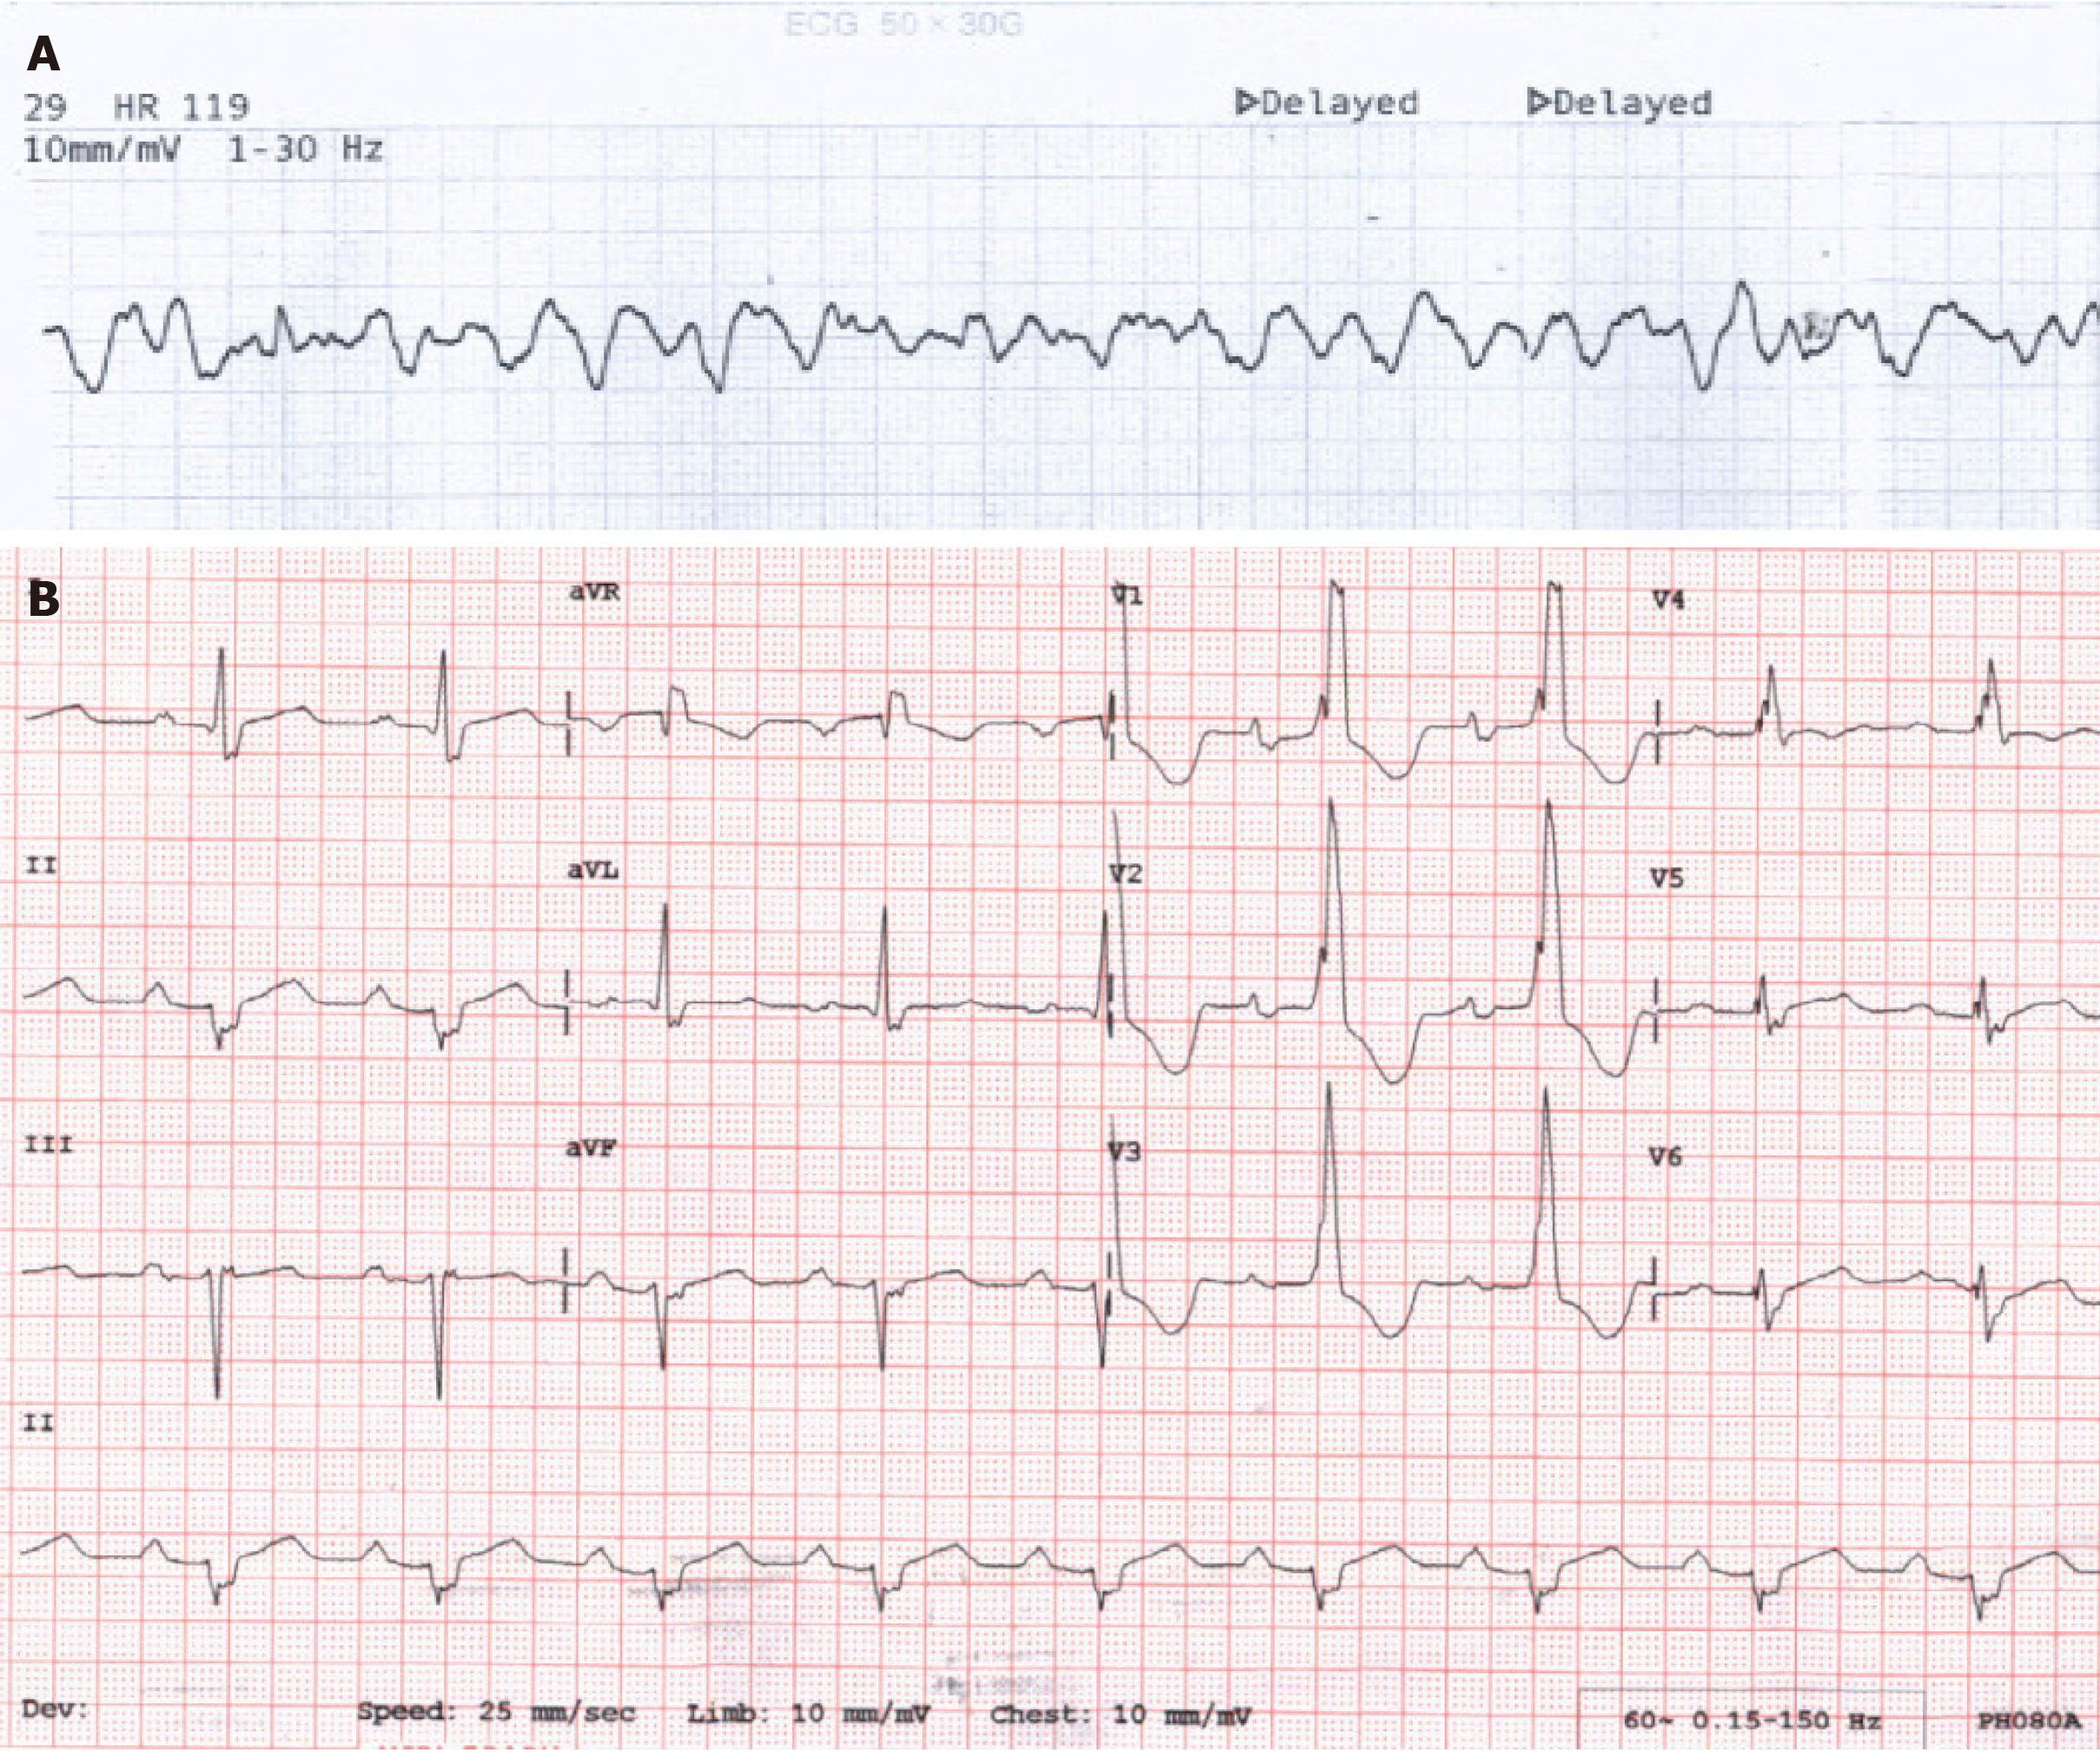
Figure 2 The initial rhythm strip and electrocardiogram in case 1.
A: The initial electrocardiogram (ECG) revealed ventricular fibrillation; B: The ECG after stabilization showed sinus rhythm with deep T-wave inversion.
Figure 3 The initial rhythm strip and electrocardiogram in case 2.
A: The initial electrocardiogram (ECG) revealed ventricular fibrillation; B: The ECG after stabilization was similar to that before cardiac collapse showing sinus rhythm with a tri-fascicular block and T-wave inversion.
- Citation: Park YM, Jang AY, Chung WJ, Han SH, Semsarian C, Choi IS. Ventricular fibrillation and sudden cardiac arrest in apical hypertrophic cardiomyopathy: Two case reports . World J Clin Cases 2021; 9(35): 11102-11107
- URL: https://www.wjgnet.com/2307-8960/full/v9/i35/11102.htm
- DOI: https://dx.doi.org/10.12998/wjcc.v9.i35.11102


