Copyright
©The Author(s) 2021.
World J Clin Cases. Sep 6, 2021; 9(25): 7579-7587
Published online Sep 6, 2021. doi: 10.12998/wjcc.v9.i25.7579
Published online Sep 6, 2021. doi: 10.12998/wjcc.v9.i25.7579
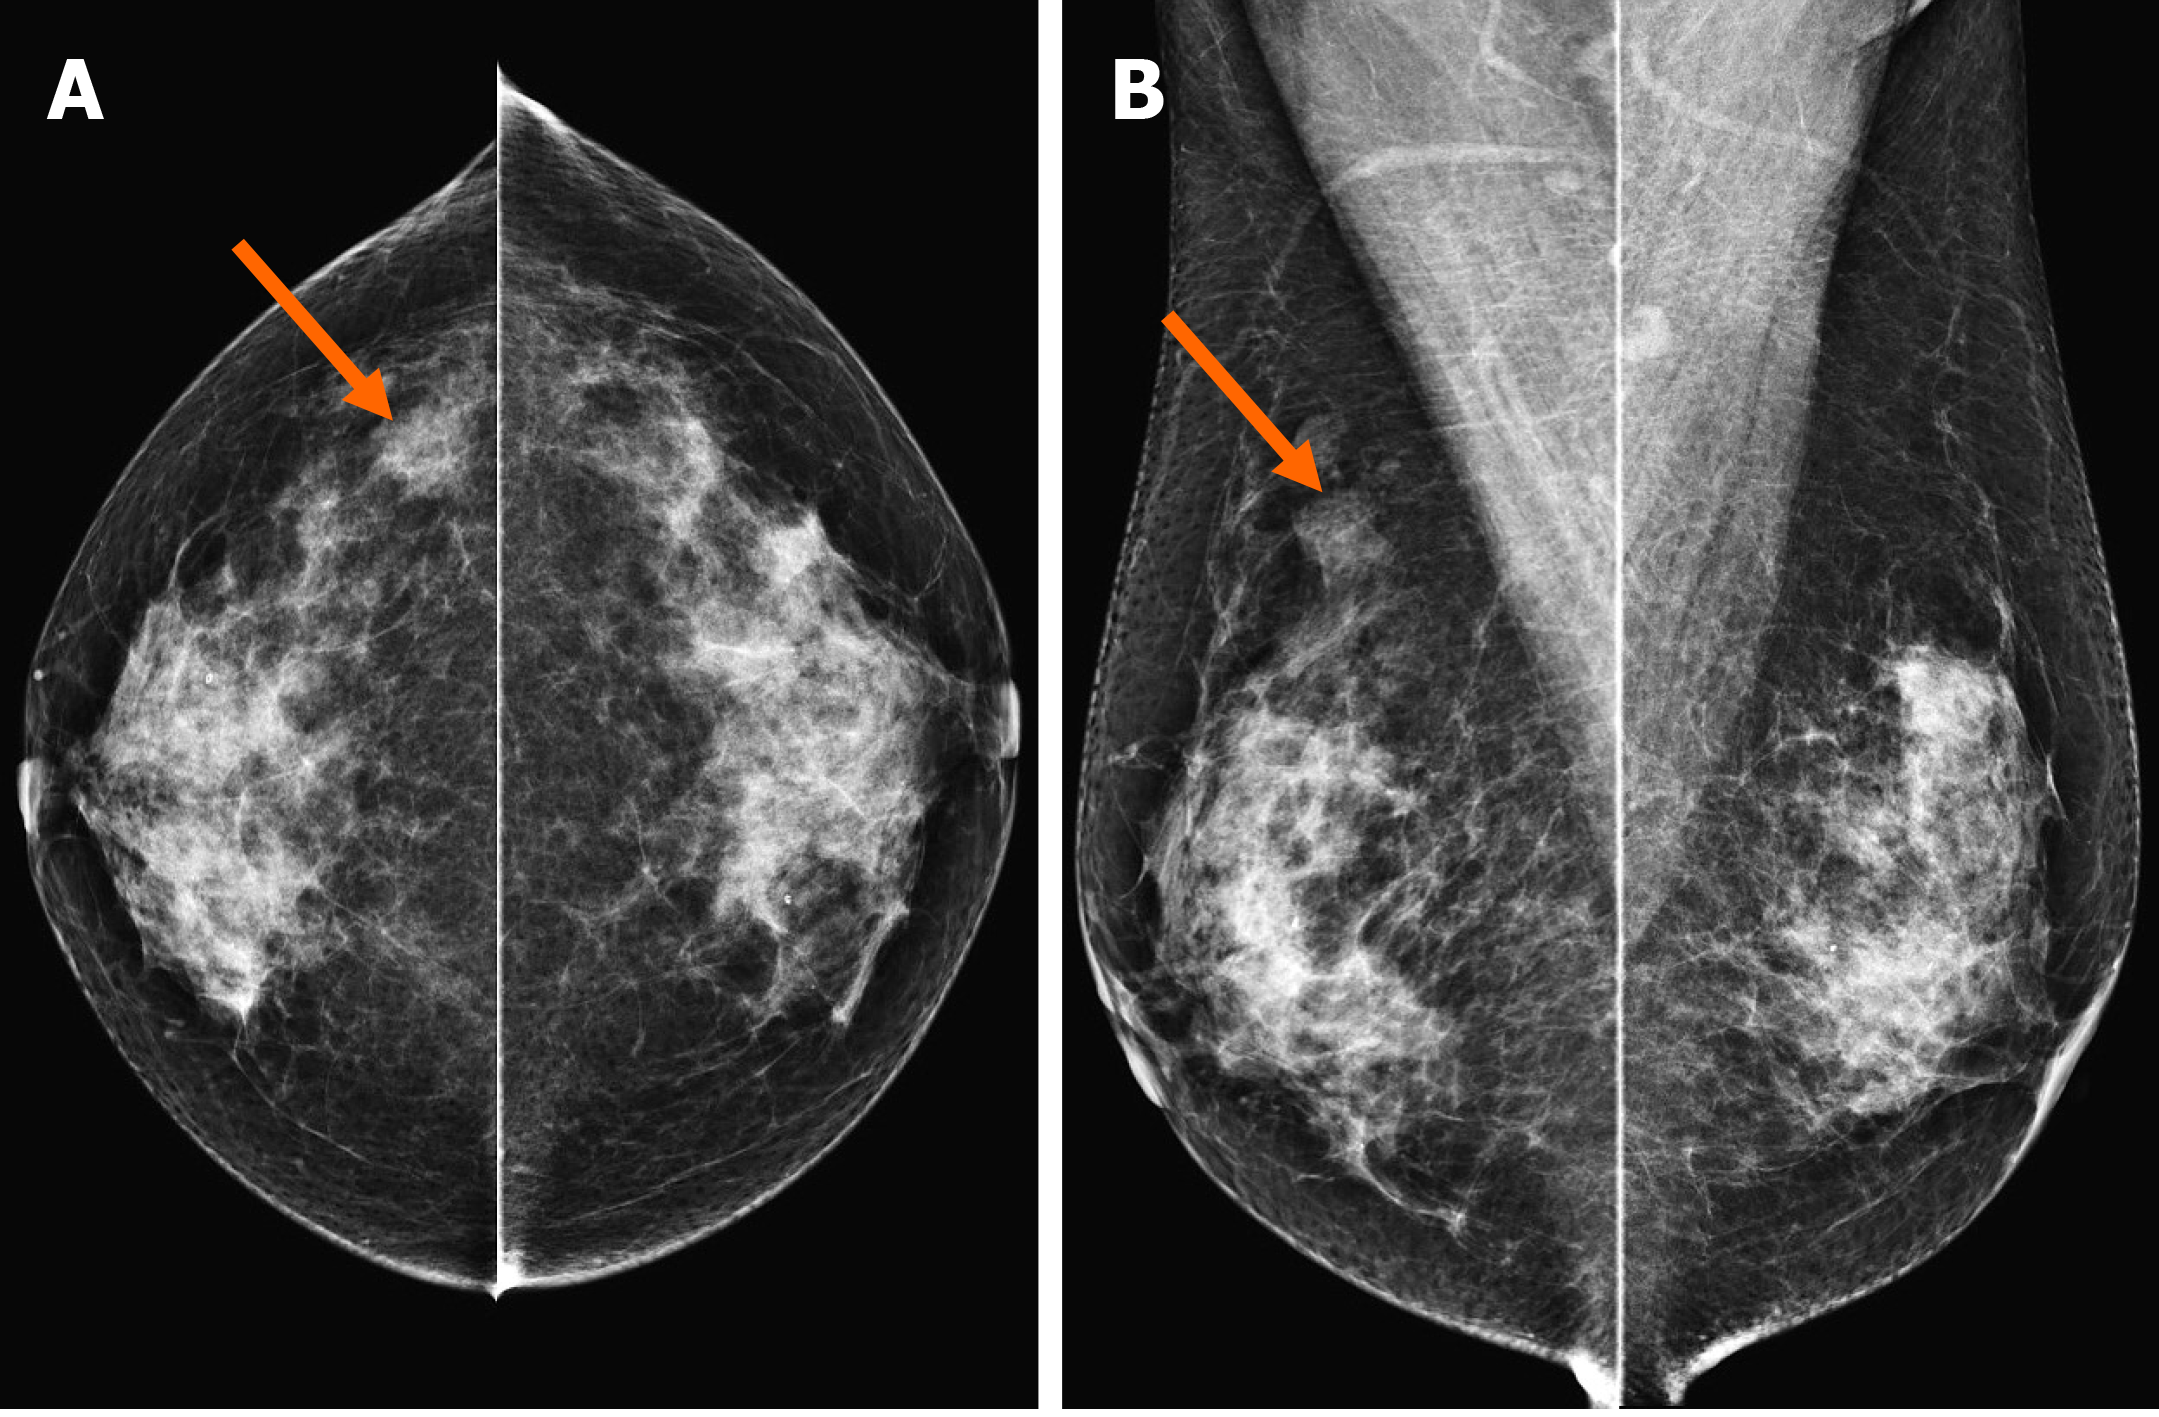
Figure 1 Mammography showing a focal asymmetry.
On cranio-caudal (A) and medio-lateral-oblique (B) view, the lesion was located in the right upper outer peripheral breast (arrows). The density was similar to or slightly lower than that of the breast parenchyma. There were no associated parenchymal distortions or microcalcifications.
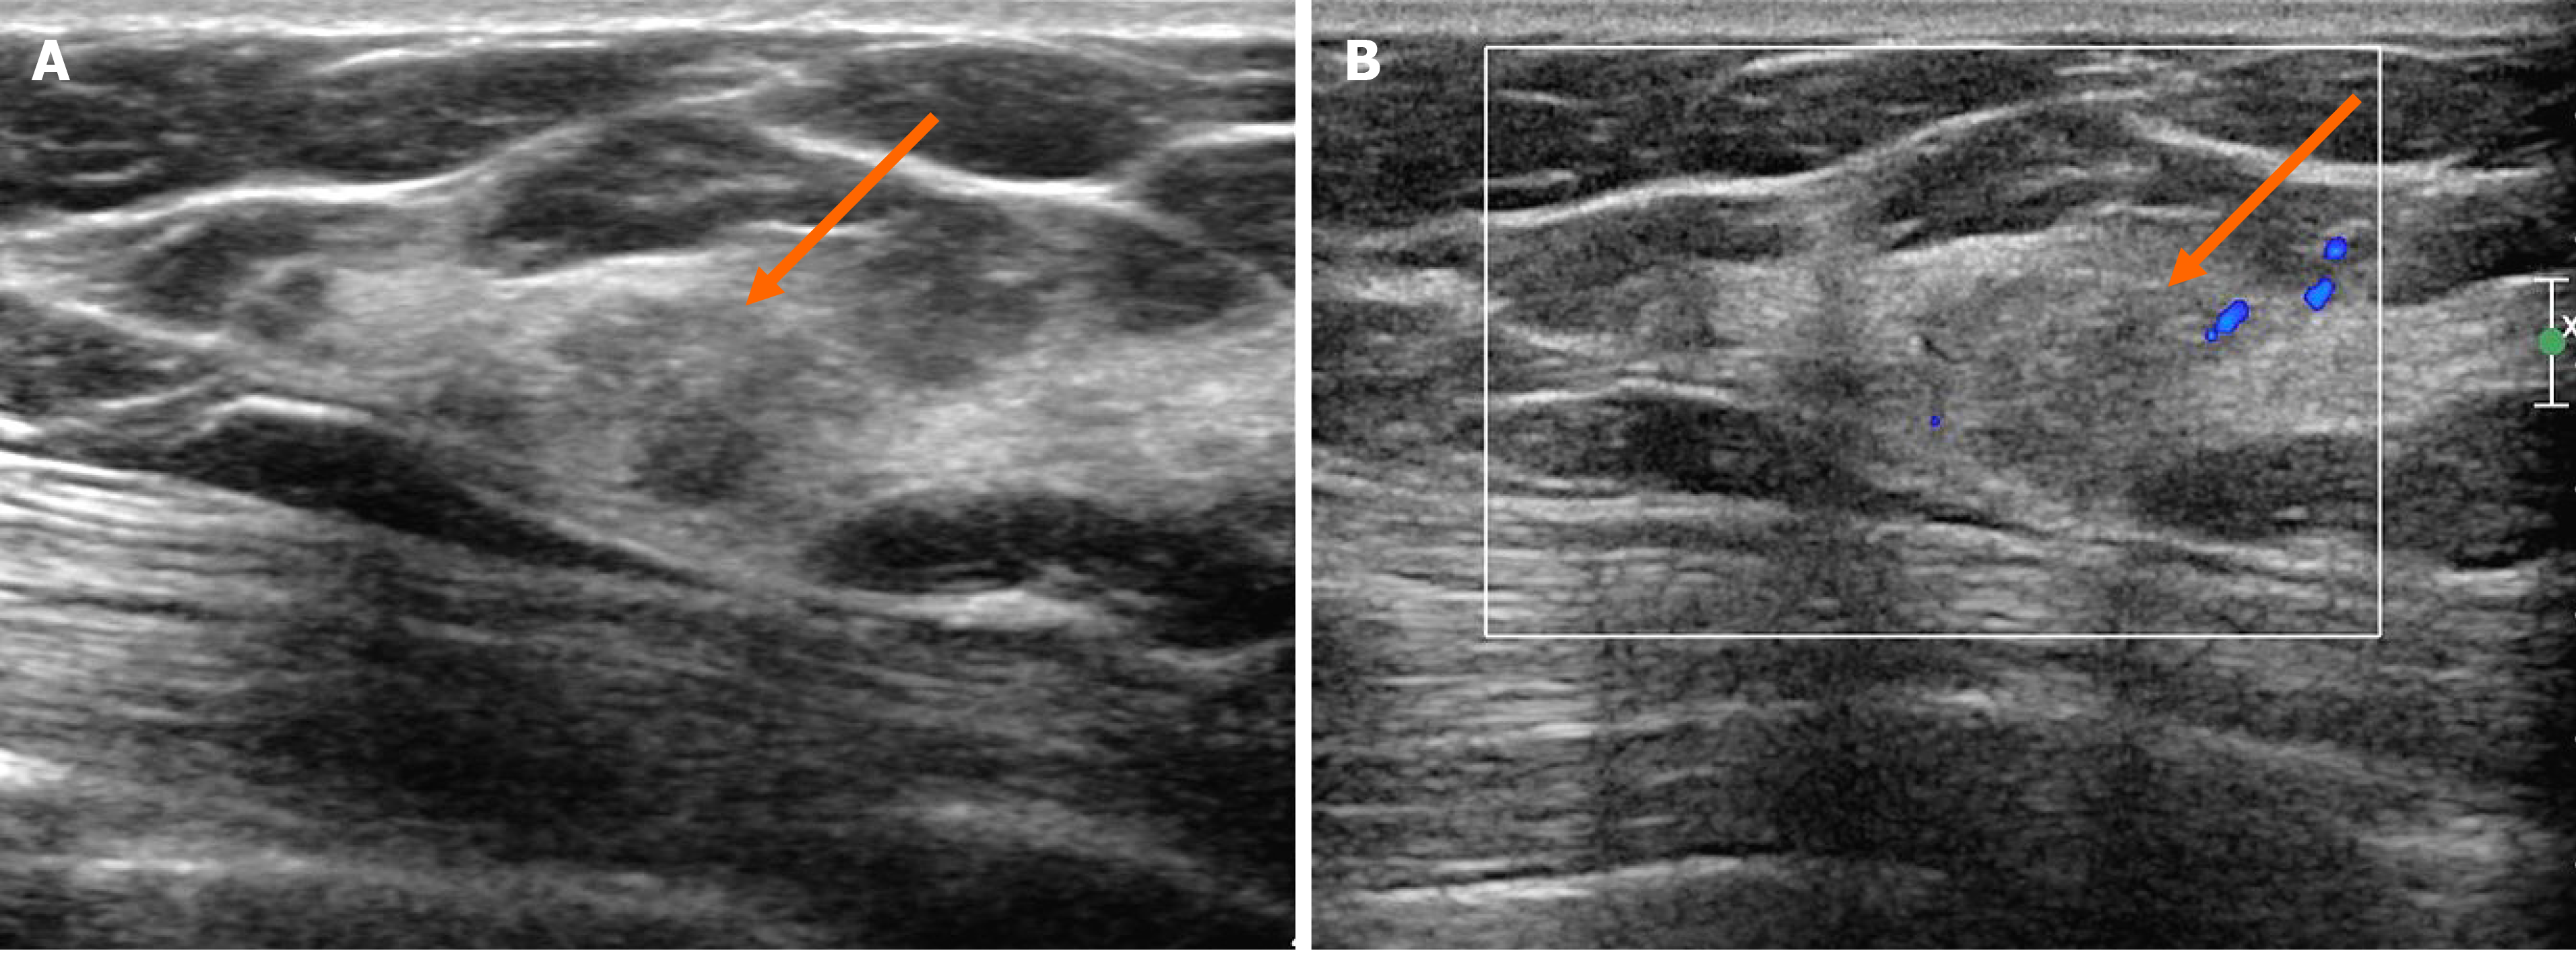
Figure 2 Ultrasonography showing an irregular mass.
A: On B-mode ultrasonography, the lesion showed an irregular shape and angular margin (arrow). The echogenicity was slightly higher than that of fat; B: In the color Doppler study, there was no internal or rim vascularity (arrow).
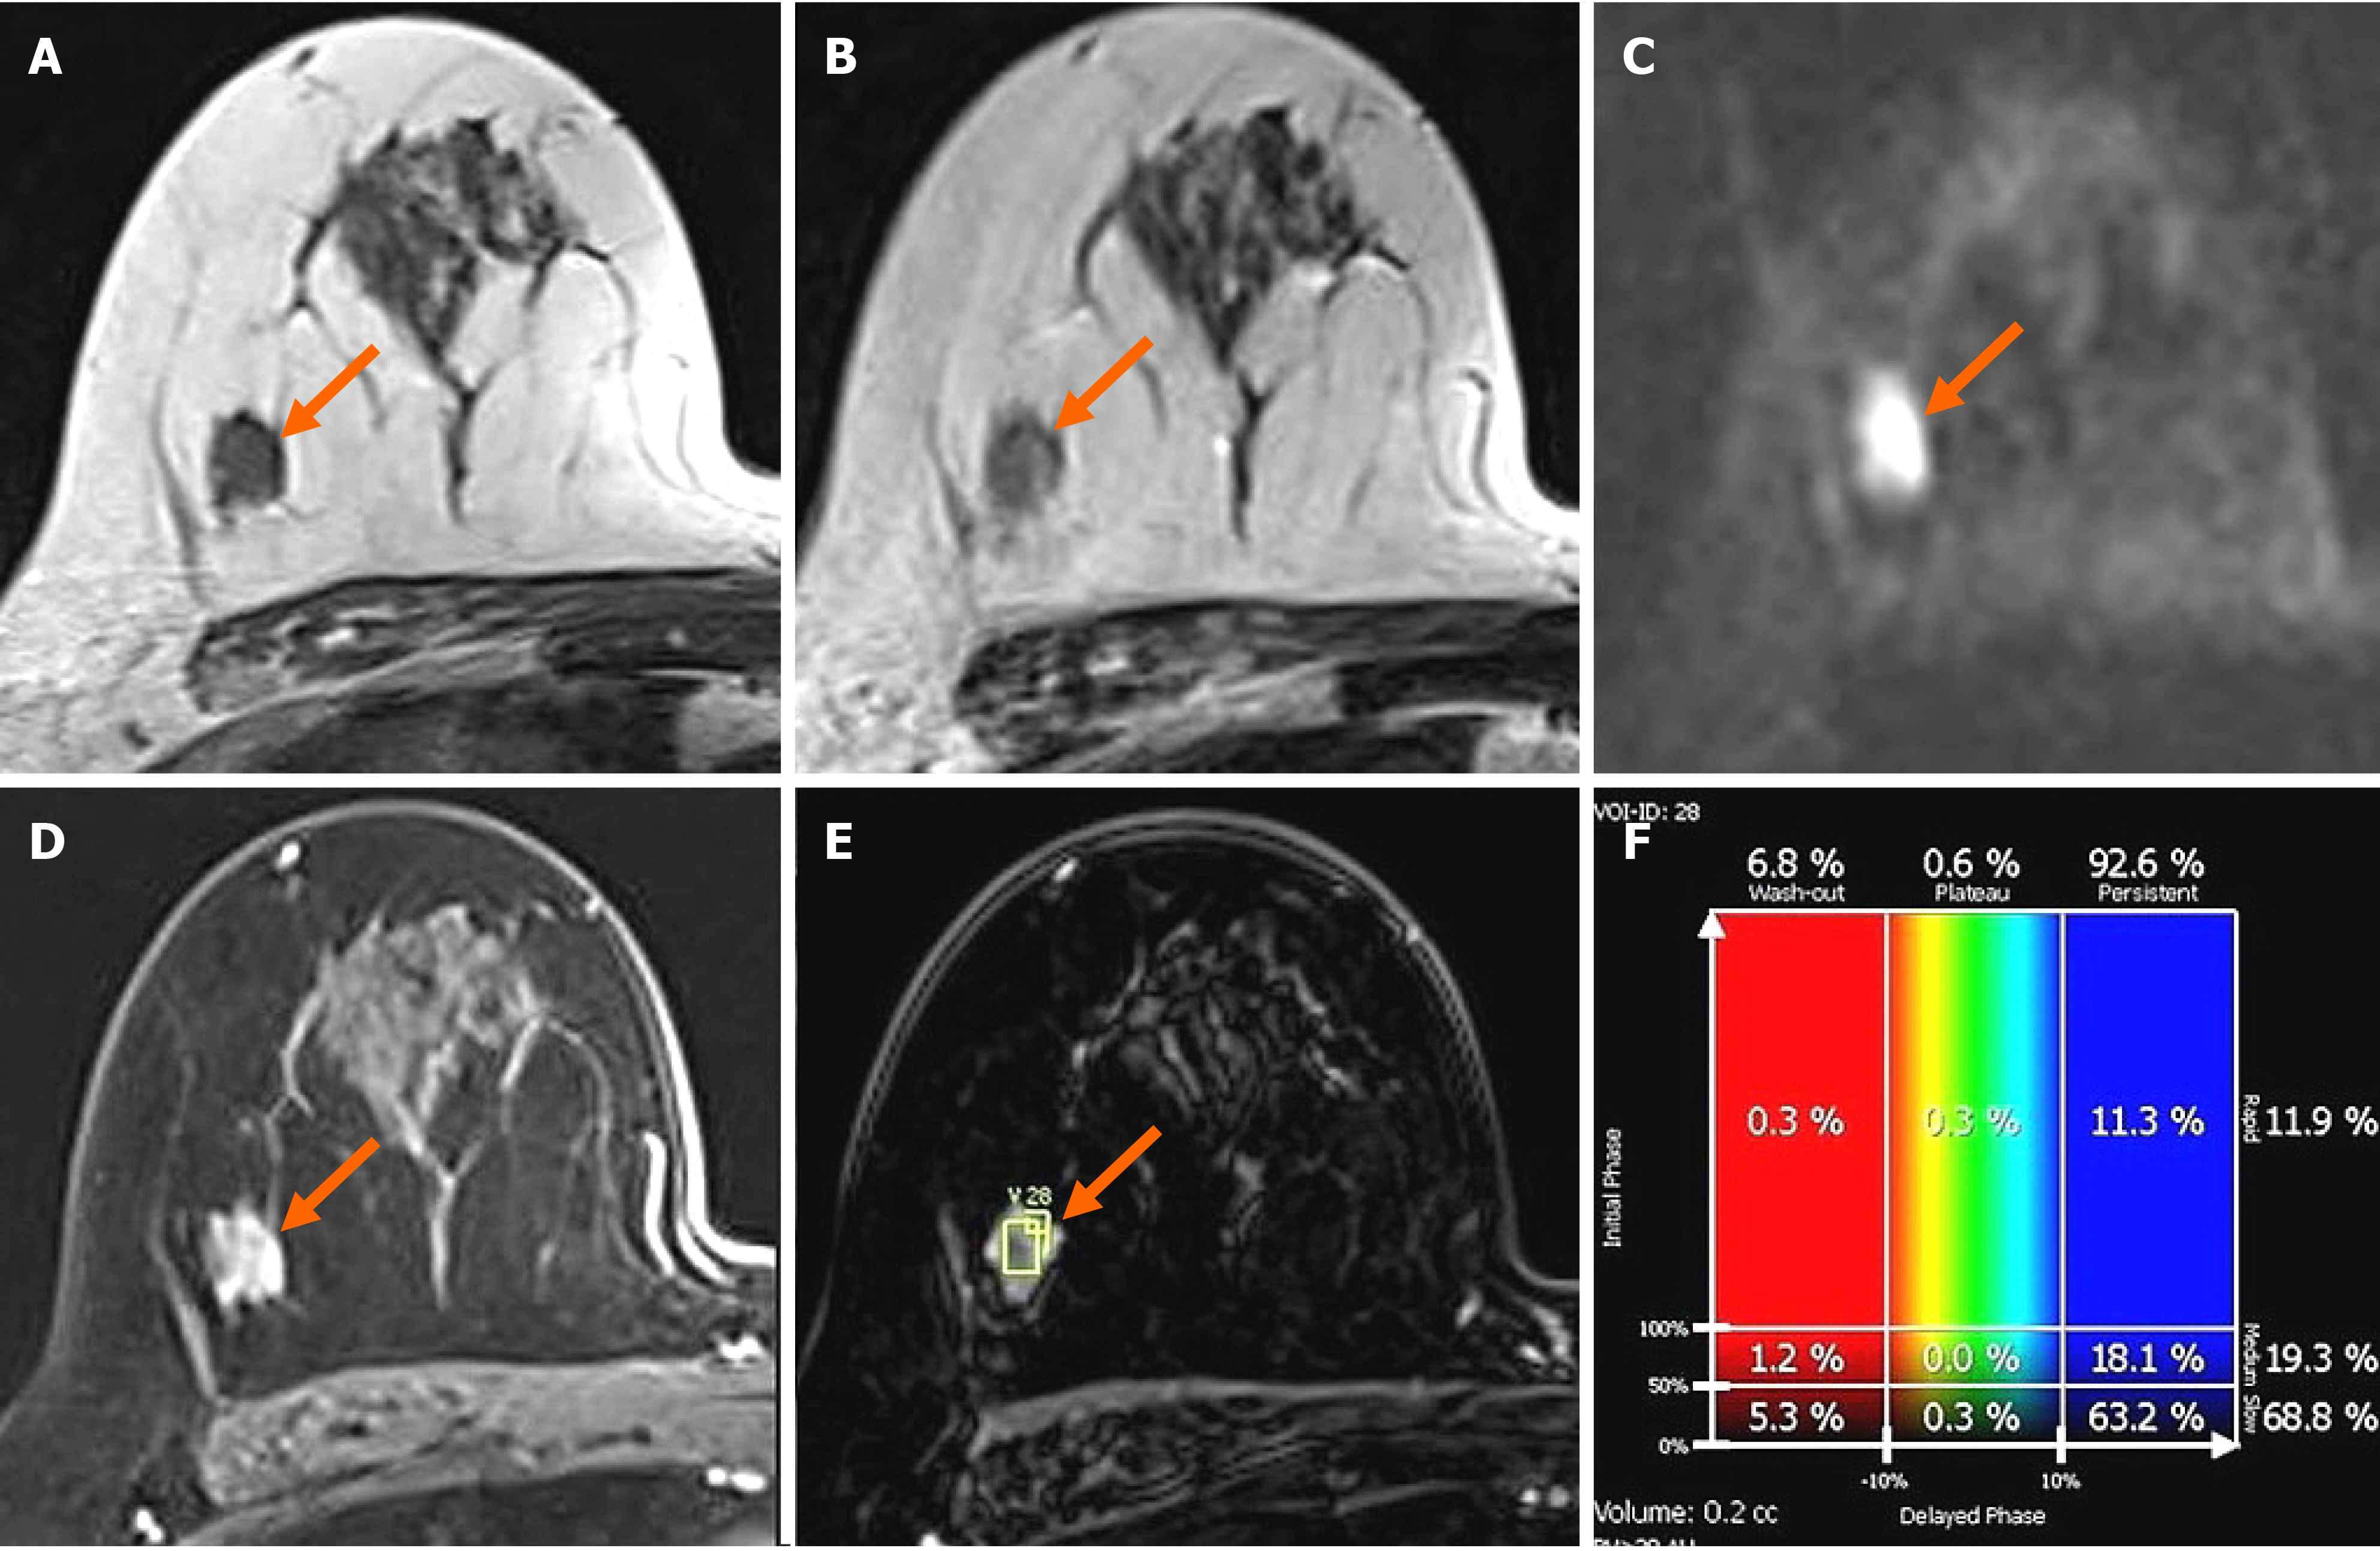
Figure 3 Breast magnetic resonance imaging showing an irregular mass in right breast.
In breast magnetic resonance imaging, the lesion showed similar T1 signal intensity (A) and slightly higher T2 signal intensity (B) compared to muscles or the breast parenchyma. The lesion showed reduced diffusivity with hyperintensity in diffusion-weighted images (C). In the contrast enhancement study, the lesion showed heterogeneous internal enhancement (D) with an initial slow and delayed persistent enhancing pattern (E and F).
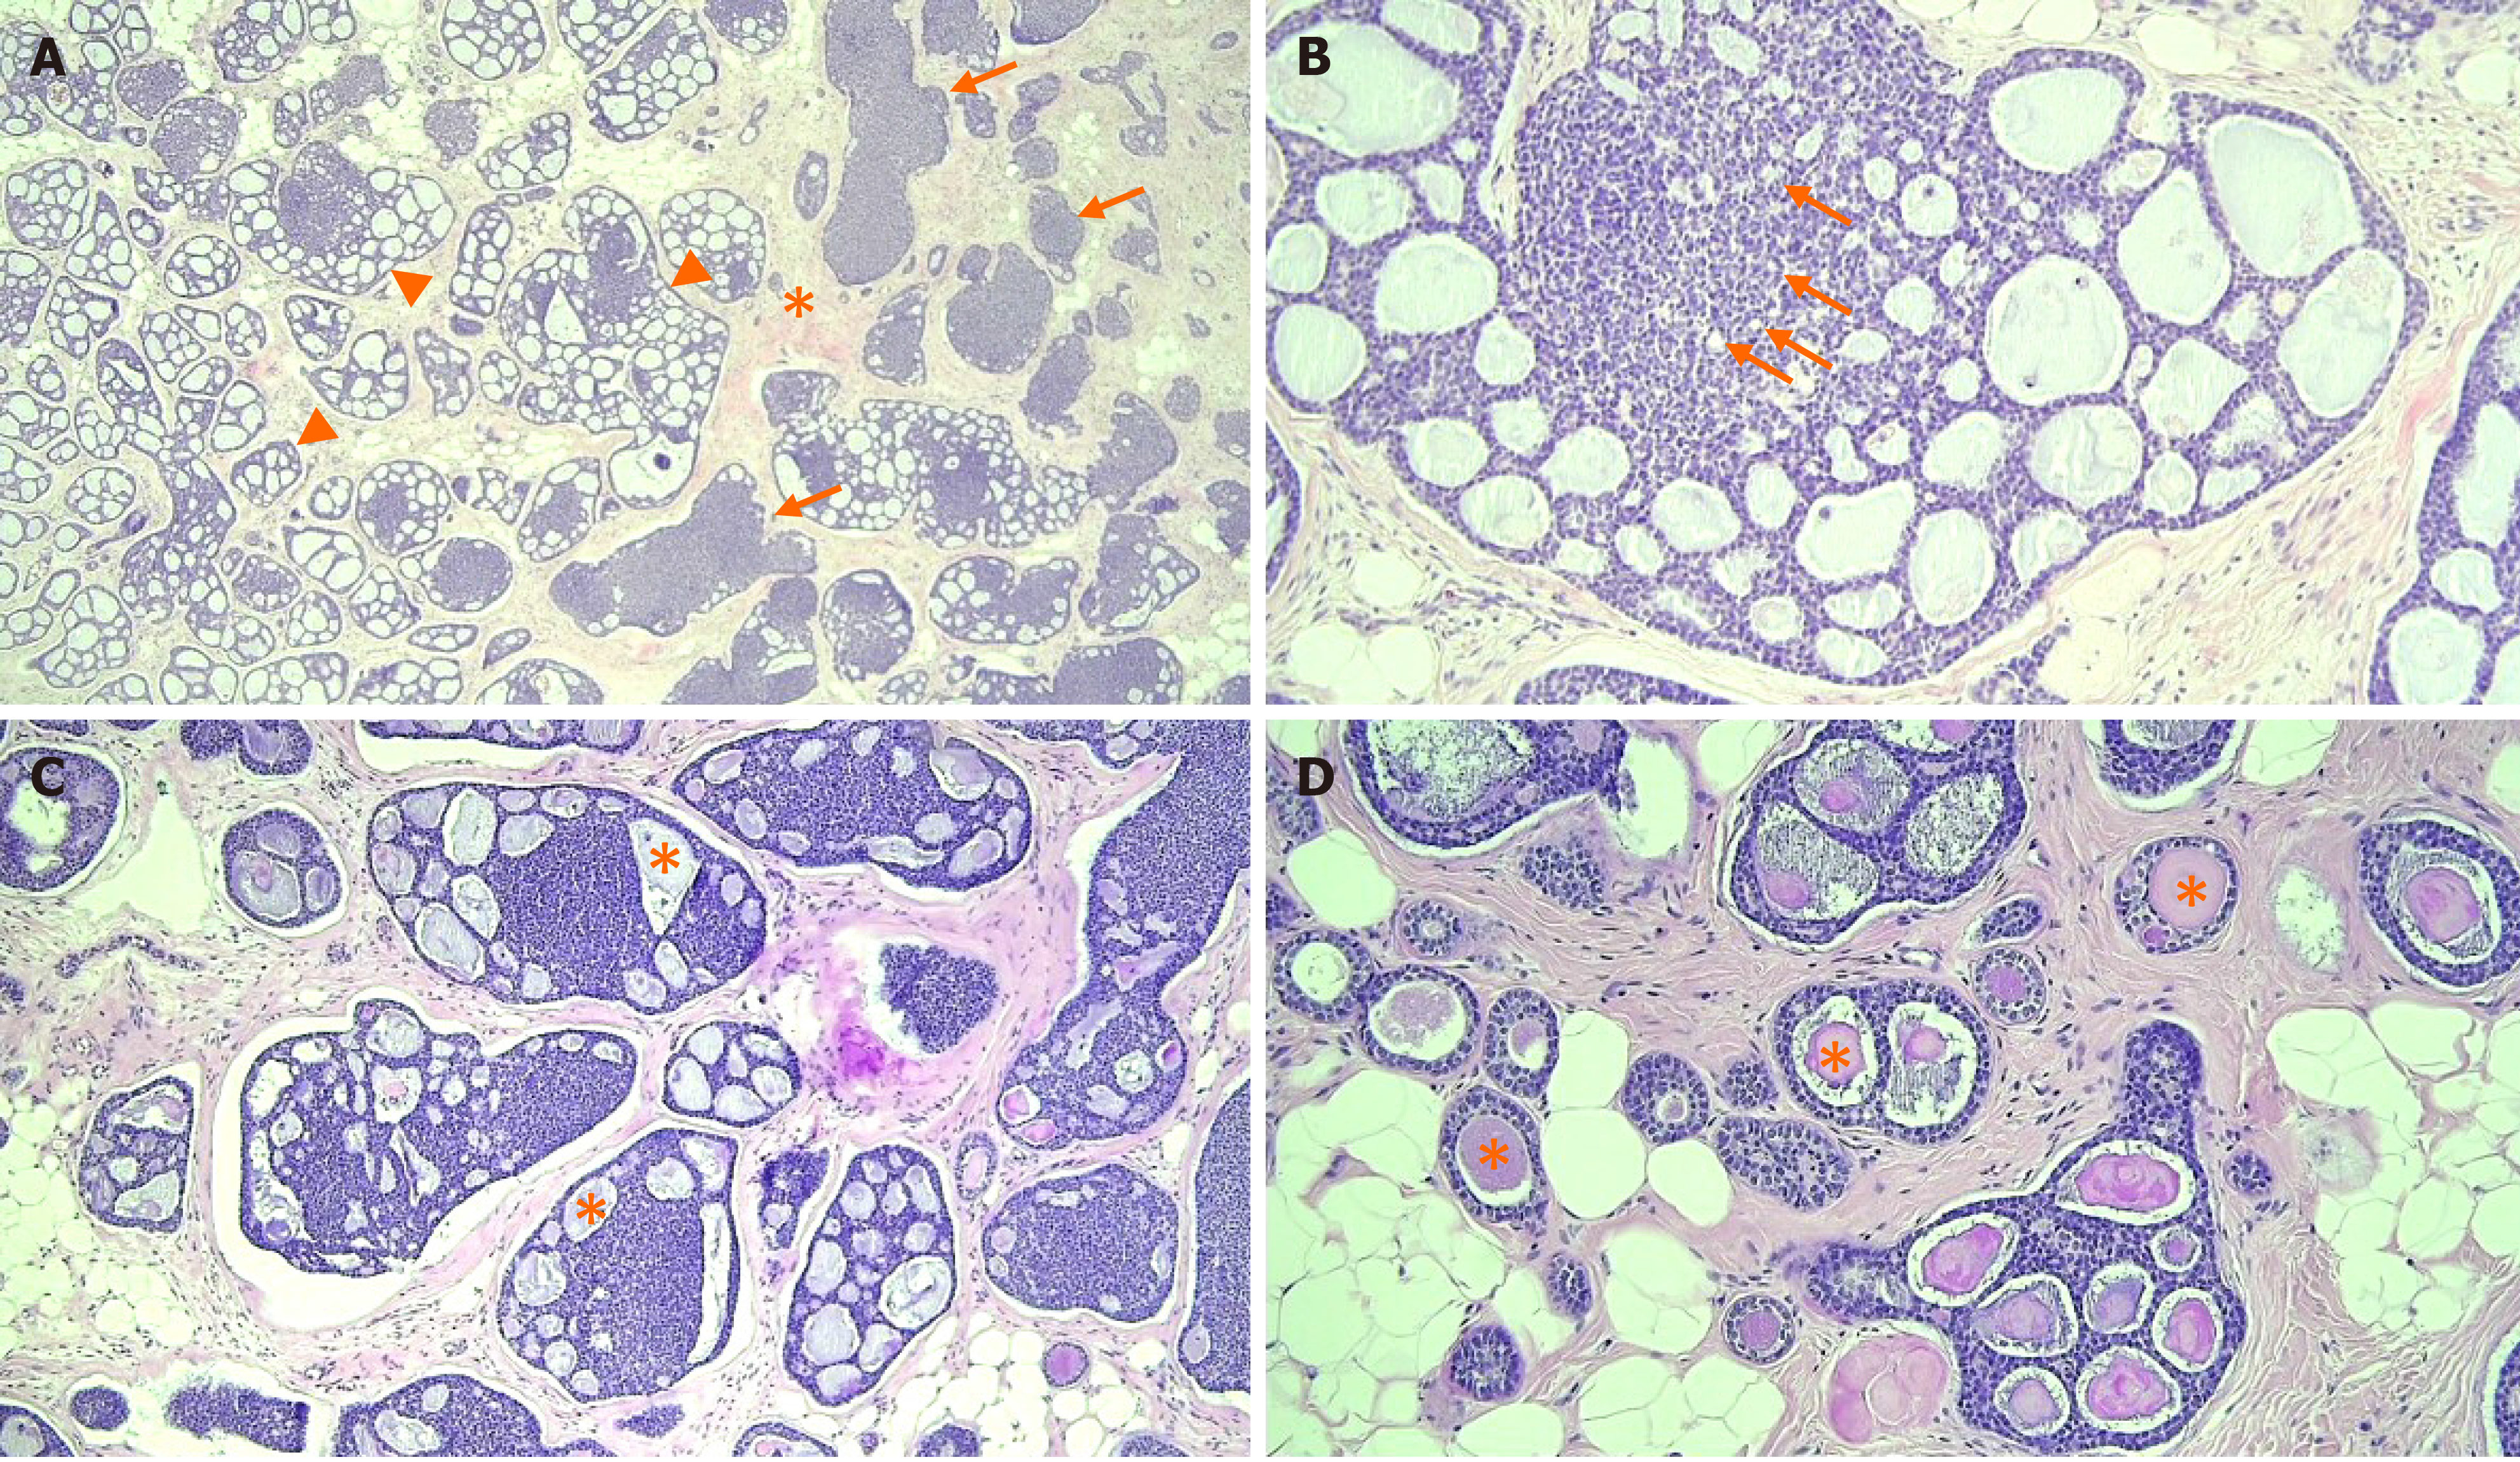
Figure 4 Photomicrographs of the adenoid cystic carcinoma.
A: The tumor was composed of cribriform (arrowheads) and solid nests (arrows) in the fibrous stroma (asterisk), [hematoxylin and eosin (H&E) staining, magnification: 40 ×]; B: Myoepithelial cells formed cribriform or solid basaloid growth, whereas ductal epithelial cells were lining small ductule-like lumen (arrows) (H&E staining, magnification: 200 ×); C and D: The cribriform space contained Periodic acid Schiff positive basement membrane-like materials (asterisk) in invasive (H&E staining, magnification: 100 ×) and in situ components (H&E staining, magnification: 200 ×).
Figure 5 Photomicrographs of in situ adenoid cystic carcinoma and microglandular adenosis.
A: In situ adenoid cystic carcinoma haphazardly scattered in fat tissue, showing cribriform or tubular proliferation of tumor cells. Just next to the in situ components, remaining microglandular adenosis (MGA) showed small tubular glands (arrows) [hematoxylin and eosin (H&E) staining, magnification: 40 ×]; B: In situ adenoid cystic carcinoma was noted in the right. MGA showed small tubular glands with single epithelial lining and retained lumen in the left (H&E staining, magnification: 100 ×).
Figure 6 Immunohistochemical staining.
A: In situ adenoid cystic carcinoma showed S-100 negativity, whereas microglandular adenosis was strongly positive for S-100 staining; B: Immunohistochemical staining for p63 showed diffuse myoepithelial differentiation of the tumor cells; C: Immunohistochemical staining for cytokeratin showed epithelial cell differentiation of the tumor cells. Magnification: 200 ×.
- Citation: An JK, Woo JJ, Kim EK, Kwak HY. Breast adenoid cystic carcinoma arising in microglandular adenosis: A case report and review of literature. World J Clin Cases 2021; 9(25): 7579-7587
- URL: https://www.wjgnet.com/2307-8960/full/v9/i25/7579.htm
- DOI: https://dx.doi.org/10.12998/wjcc.v9.i25.7579


