Copyright
©The Author(s) 2021.
World J Clin Cases. Jun 26, 2021; 9(18): 4520-4541
Published online Jun 26, 2021. doi: 10.12998/wjcc.v9.i18.4520
Published online Jun 26, 2021. doi: 10.12998/wjcc.v9.i18.4520
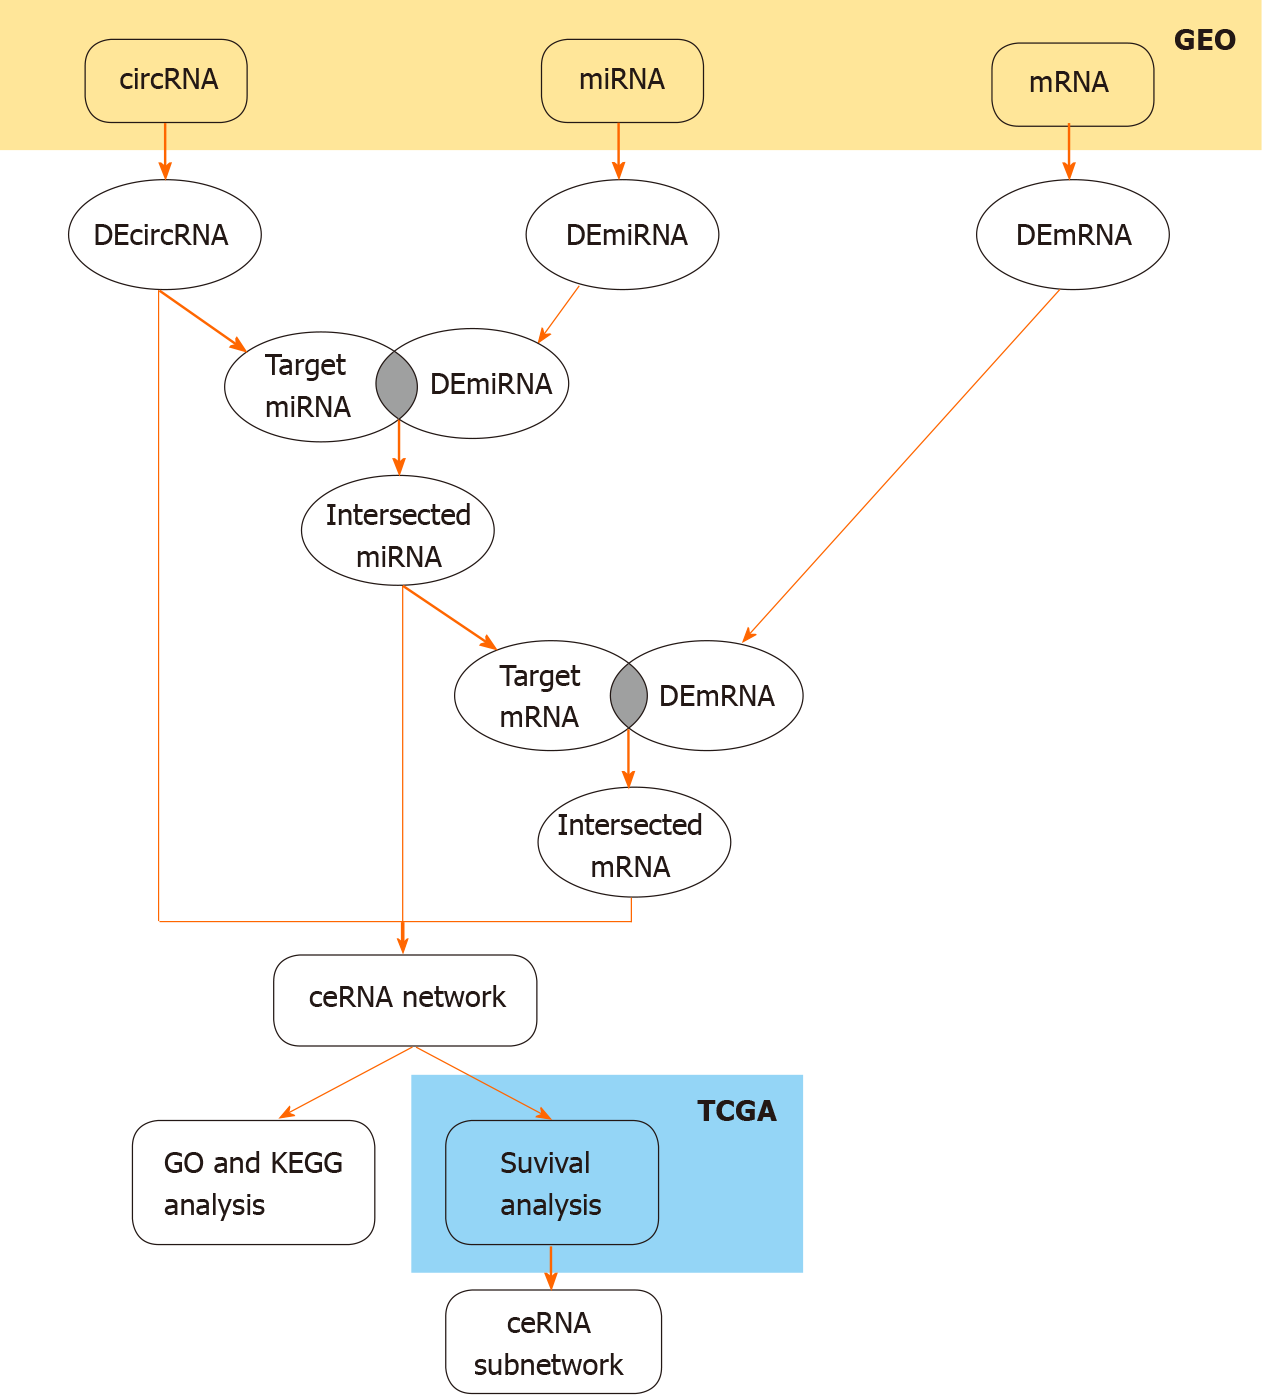
Figure 1 Flow chart of the procedure applied in this study.
We identified the differentially expressed (DE) circRNAs, DEmiRNAs and DEmRNAs and then took the intersection of DEmiRNAs and DEmRNAs with the predicted targets of DEcircRNAs and intersected miRNA to obtain the competing endogenous RNA network in the Gene Expression Omnibus (GEO) database, performed GO and KEGG enrichment analyses, and constructed a prognostic subnetwork based on survival analysis in The Cancer Genome Atlas (TCGA) database. ceRNA: Competing endogenous RNA.
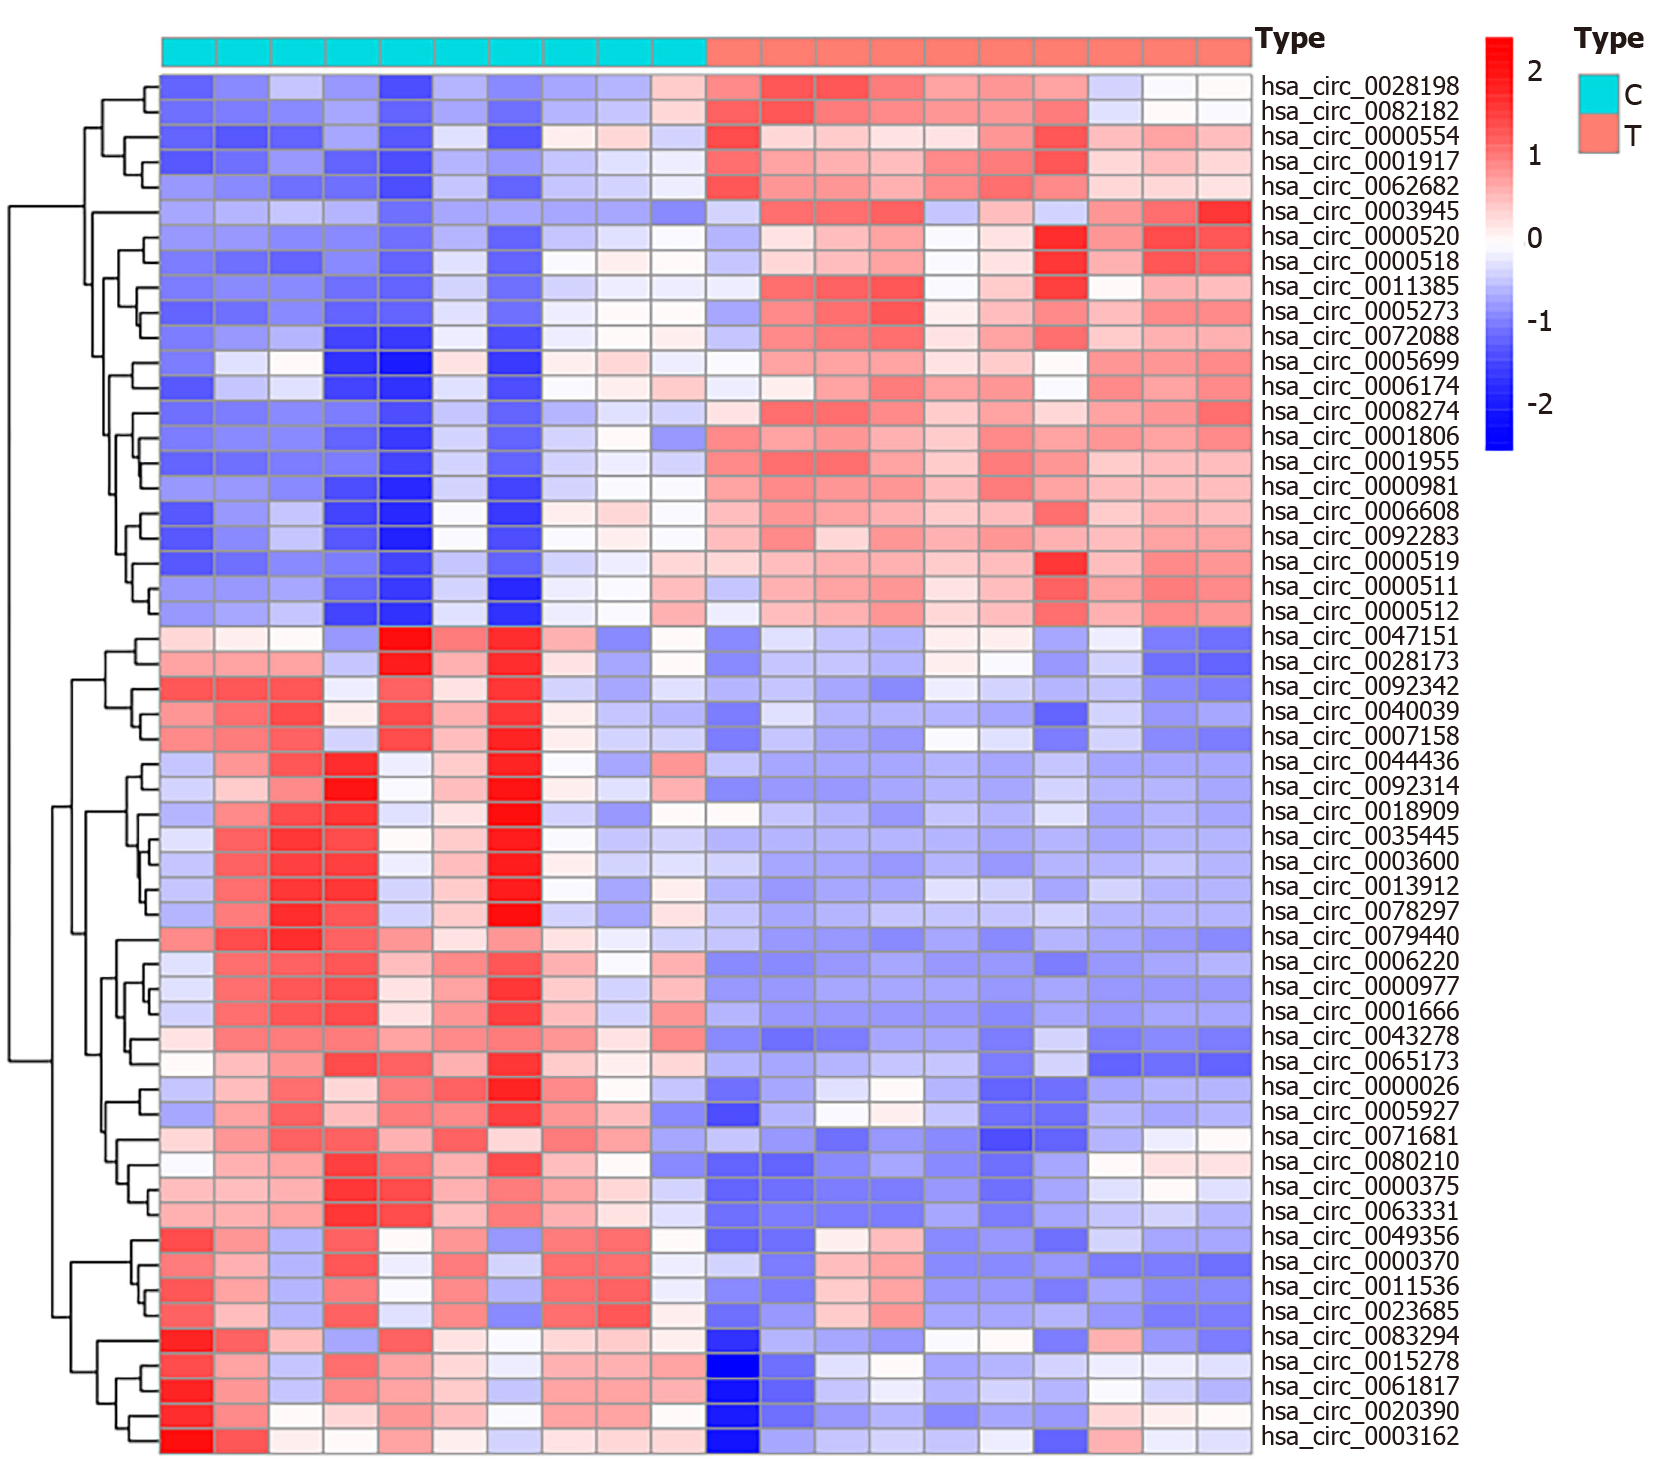
Figure 2 Heat map of circRNAs differentially expressed in GSE126095.
By analyzing the circRNA profile, 55 differentially expressed circRNAs were obtained. Red indicates high expression, while blue indicates low expression. A deeper color indicates a more significant difference. The cut-off value was a |log2 fold change| > 2 and an adjusted P < 0.05.
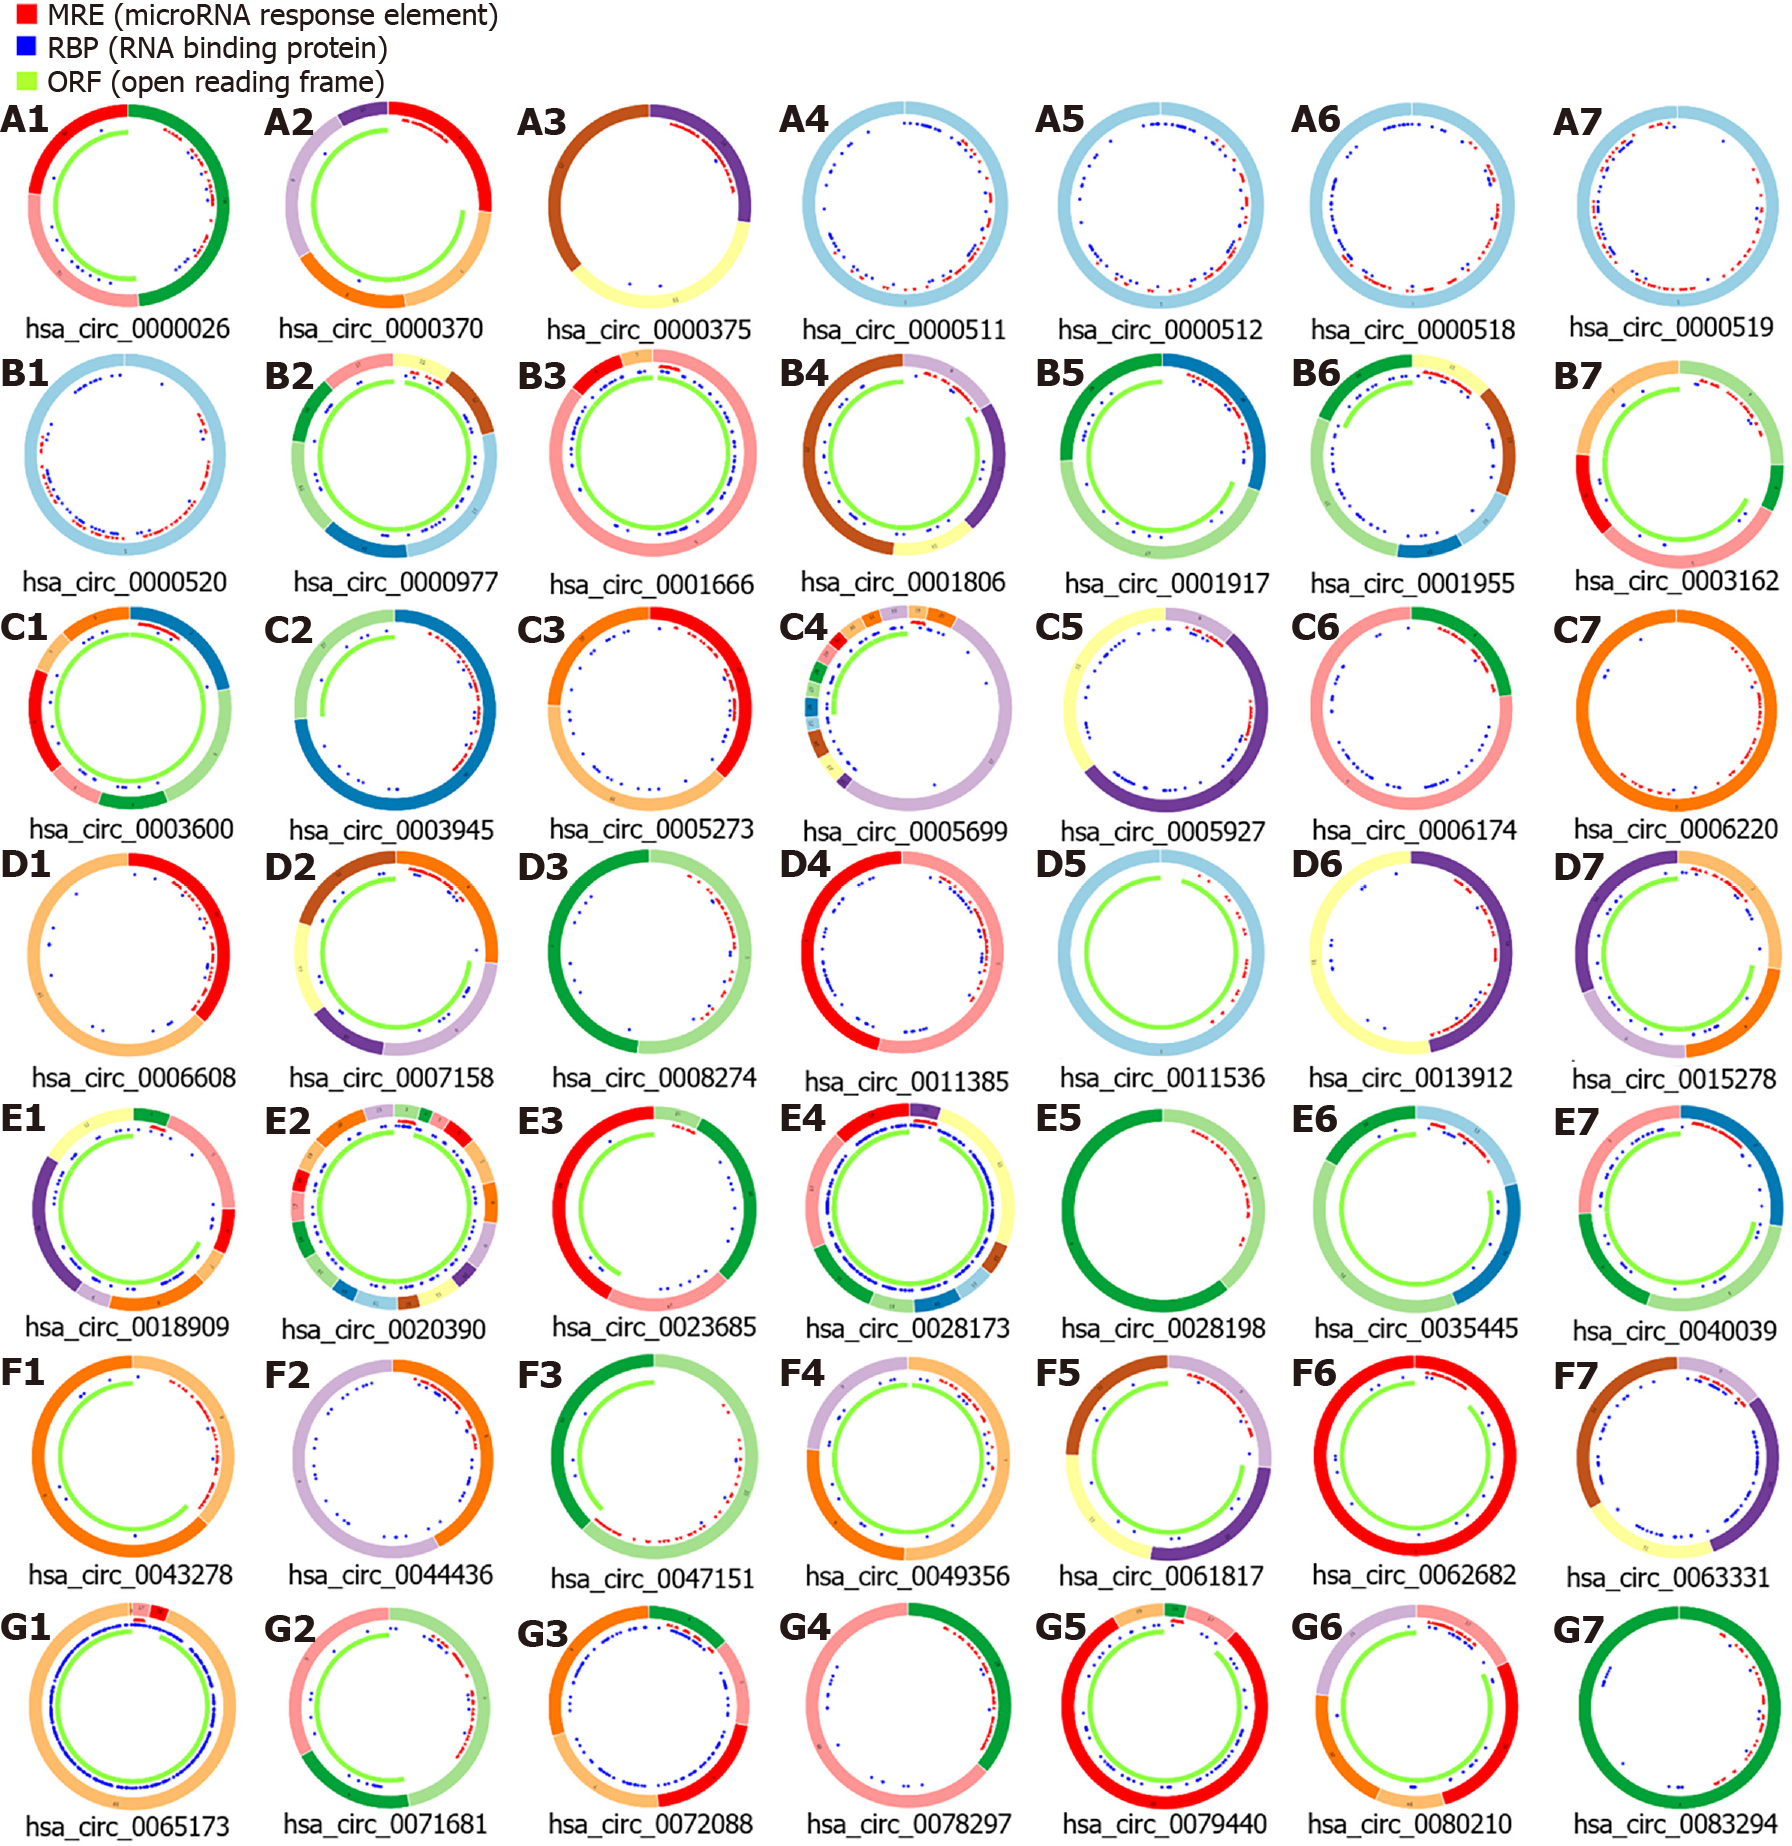
Figure 3 Structural pattern of 49 differentially expressed circRNAs obtained from Cancer-Specific CircRNA Database.
Red indicates the miRNA response element, blue indicates the RNA binding protein, and green indicates the open reading frame. CSCD: Cancer-Specific CircRNA Database (http://gb.whu.edu.cn/CSCD/).
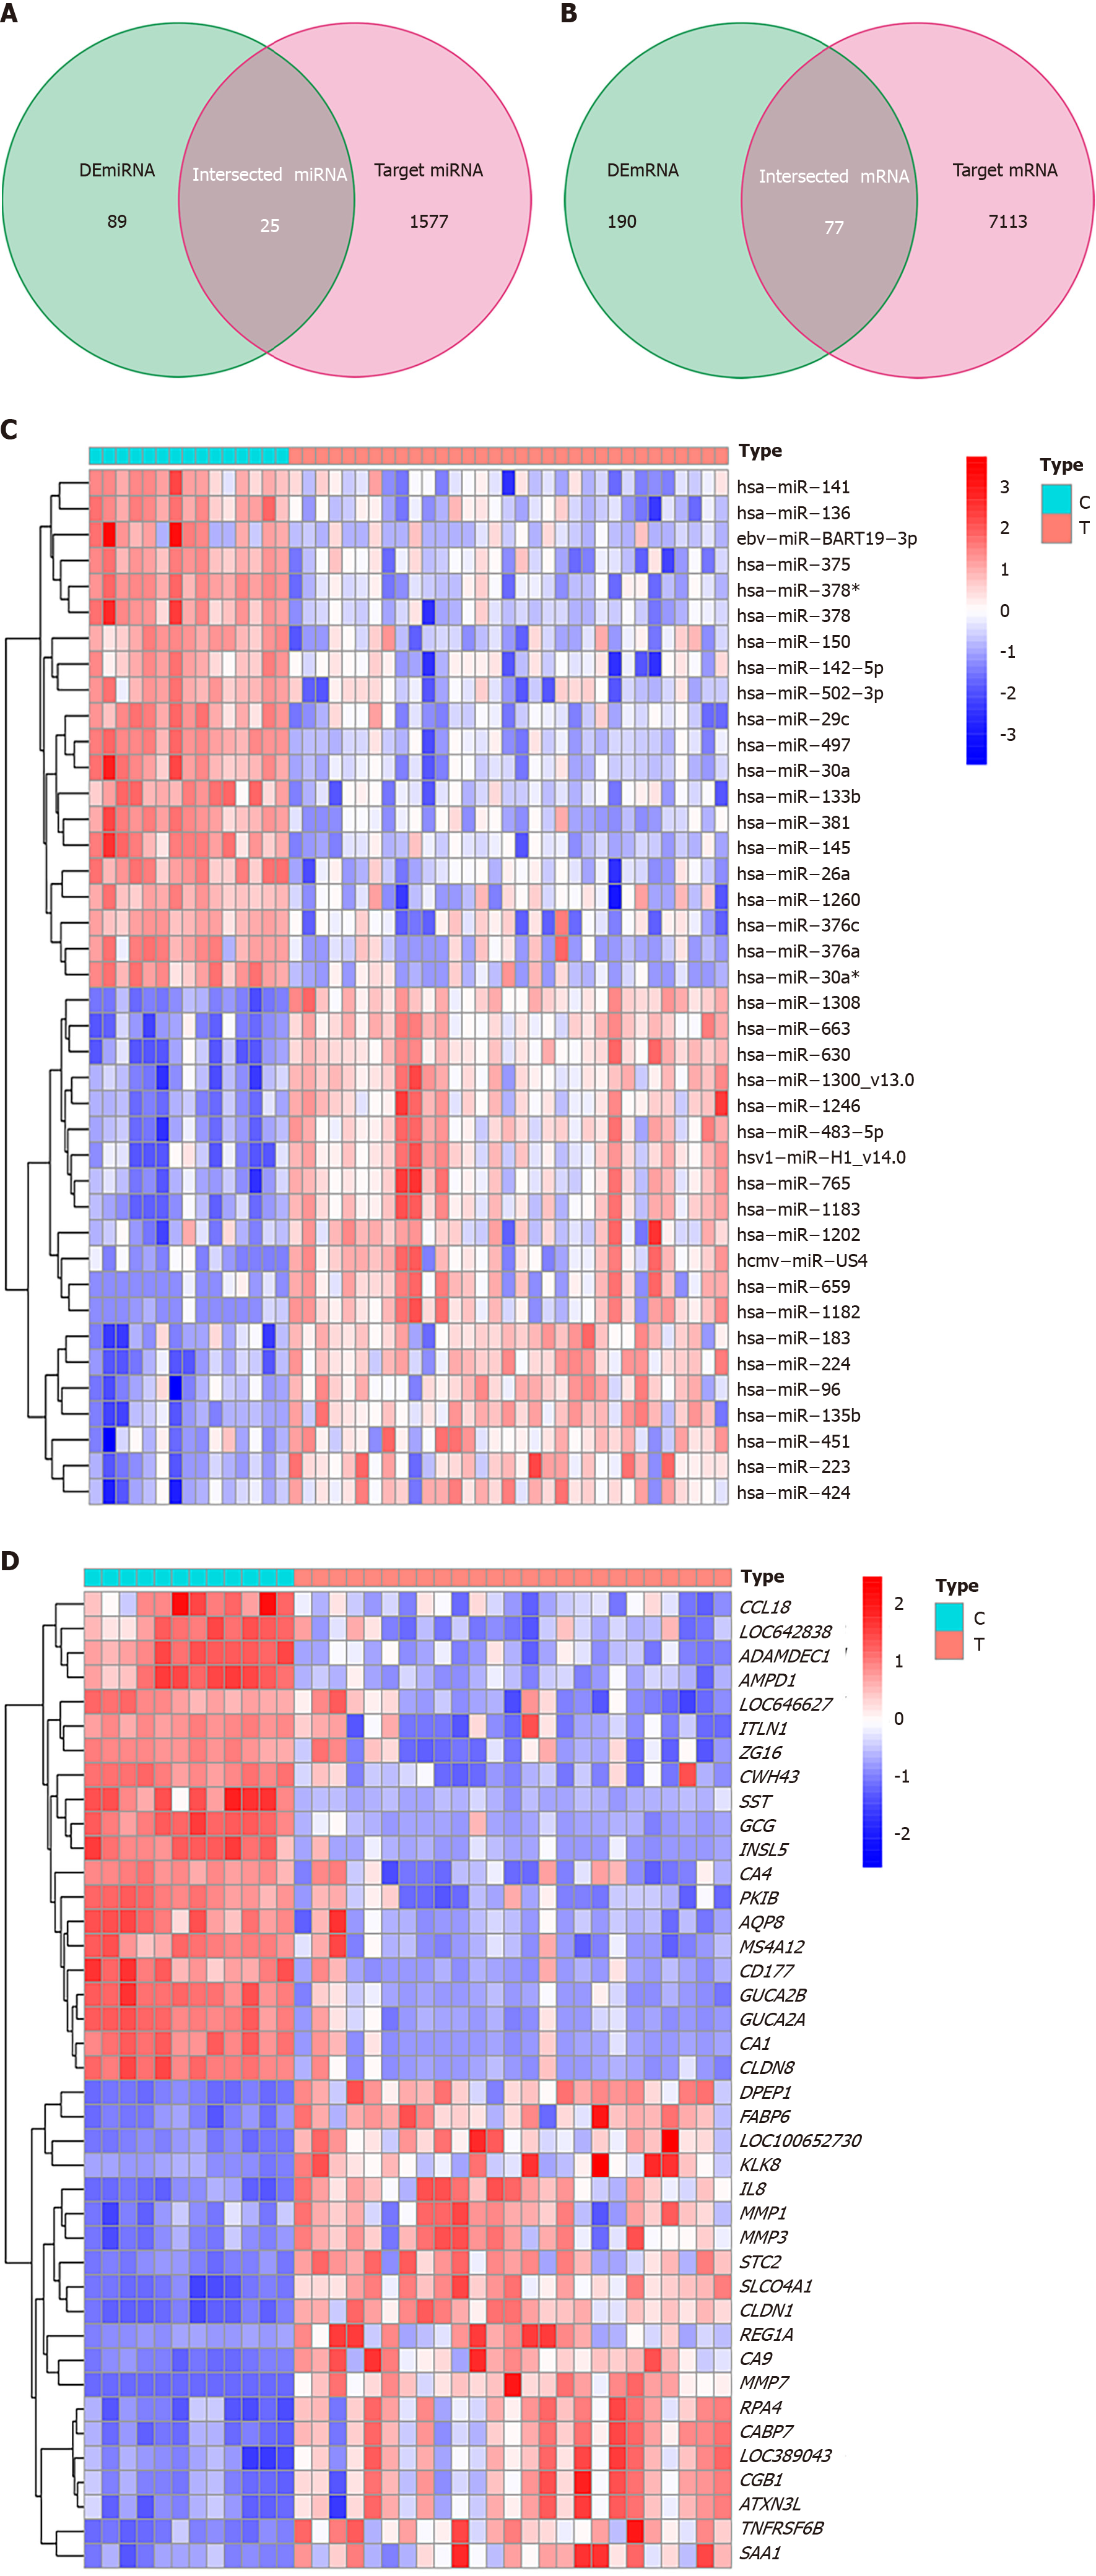
Figure 4 Venn diagrams and heat maps of miRNAs and mRNAs.
A: Twenty-five miRNAs were identified from the intersection of 114 differentially expressed (DE) miRNAs with 1602 circRNA targets predicted by the Cancer-Specific CircRNA Database; B: 77 mRNAs were obtained from the intersection of 267 DEmRNAs and 7190 miRNA targets predicted using the TargetScan and miRDB databases; The expression level of each 20 DEmiRNAs (C) and 20 mRNAs (D) expressing the most significant upregulation and downregulation between control tissues (type C) and tumor tissues (type T), respectively. |log2 fold change (FC)| > 1 and an adjusted P < 0.05 were considered the statistical criteria for DEmiRNA; adjusted P < 0.05 and |log2 FC| > 2 were considered the statistical criteria for DEmRNA.
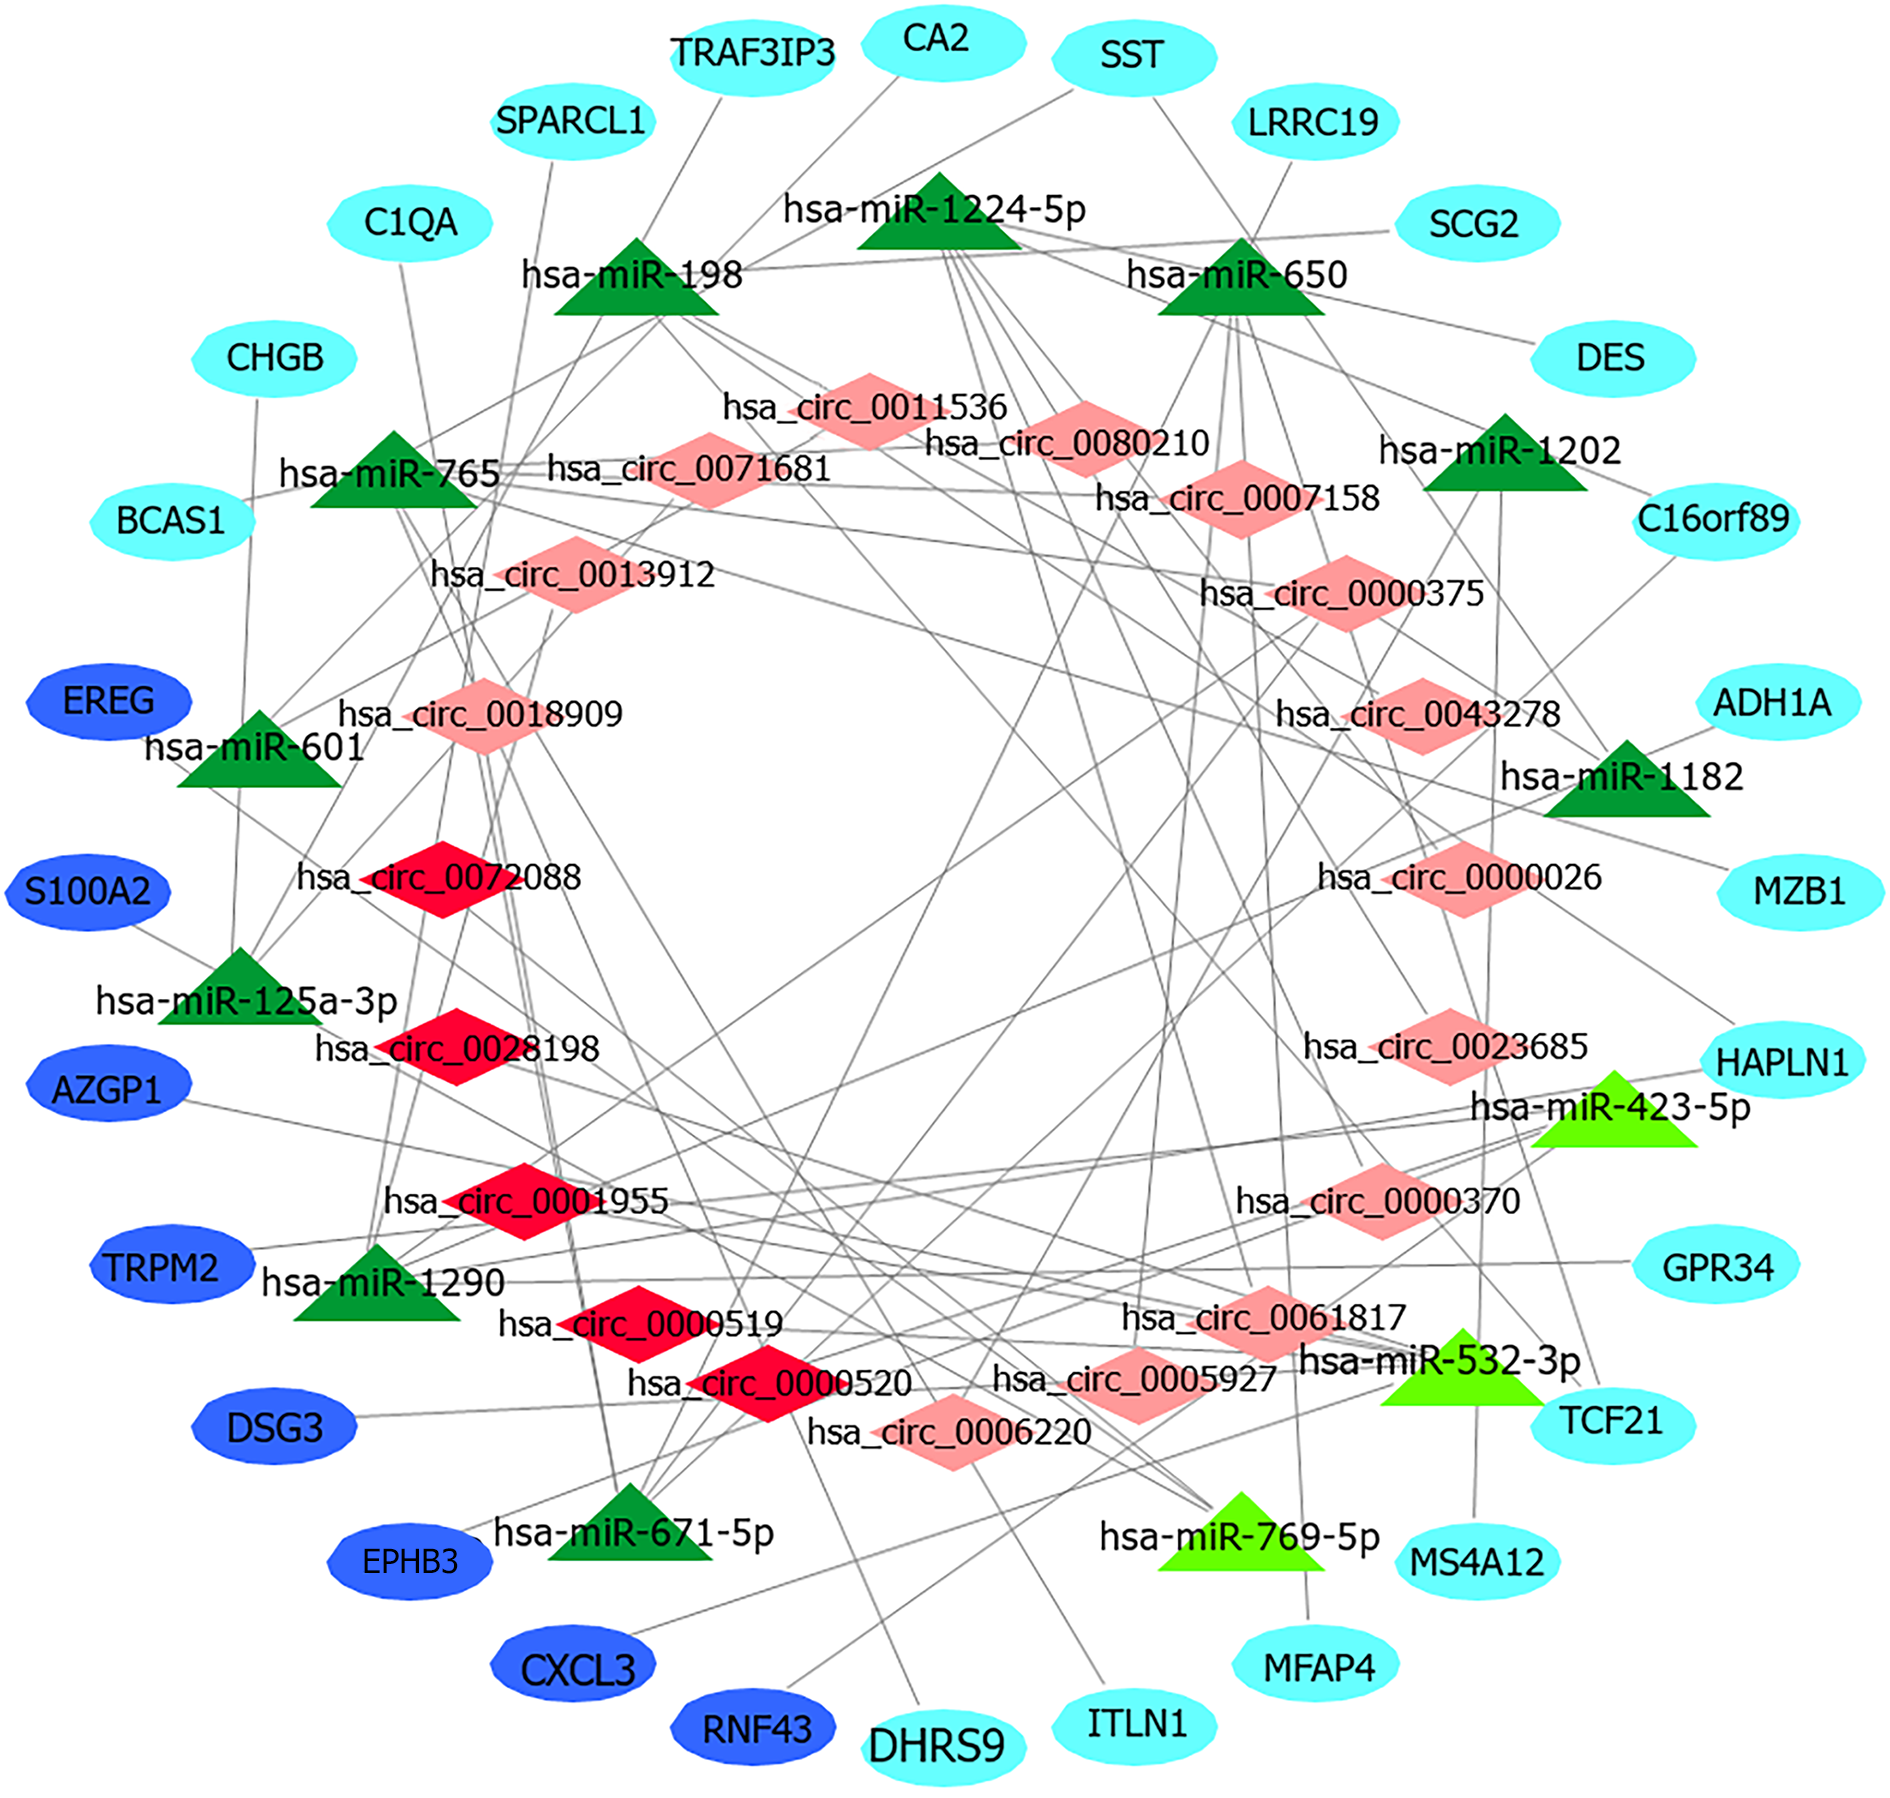
Figure 5 CircRNA-miRNA-mRNA regulatory network of colorectal cancer.
CircRNAs, miRNAs and mRNAs are represented by red diamonds, green triangles and blue ellipses, respectively. Dark colors represent overexpression, and light colors represent low expression.
Figure 6 The expression levels of circRNAs, miRNAs and mRNAs in the competing endogenous RNA (ceRNA) network.
A and B: Expression levels of 19 circRNAs in the ceRNA network; C and D: Expression levels of 13 miRNAs in the ceRNA network; E and F: Expression levels of 25 mRNAs in the ceRNA network. aP < 0.001; bP < 0.01; cP < 0.05.
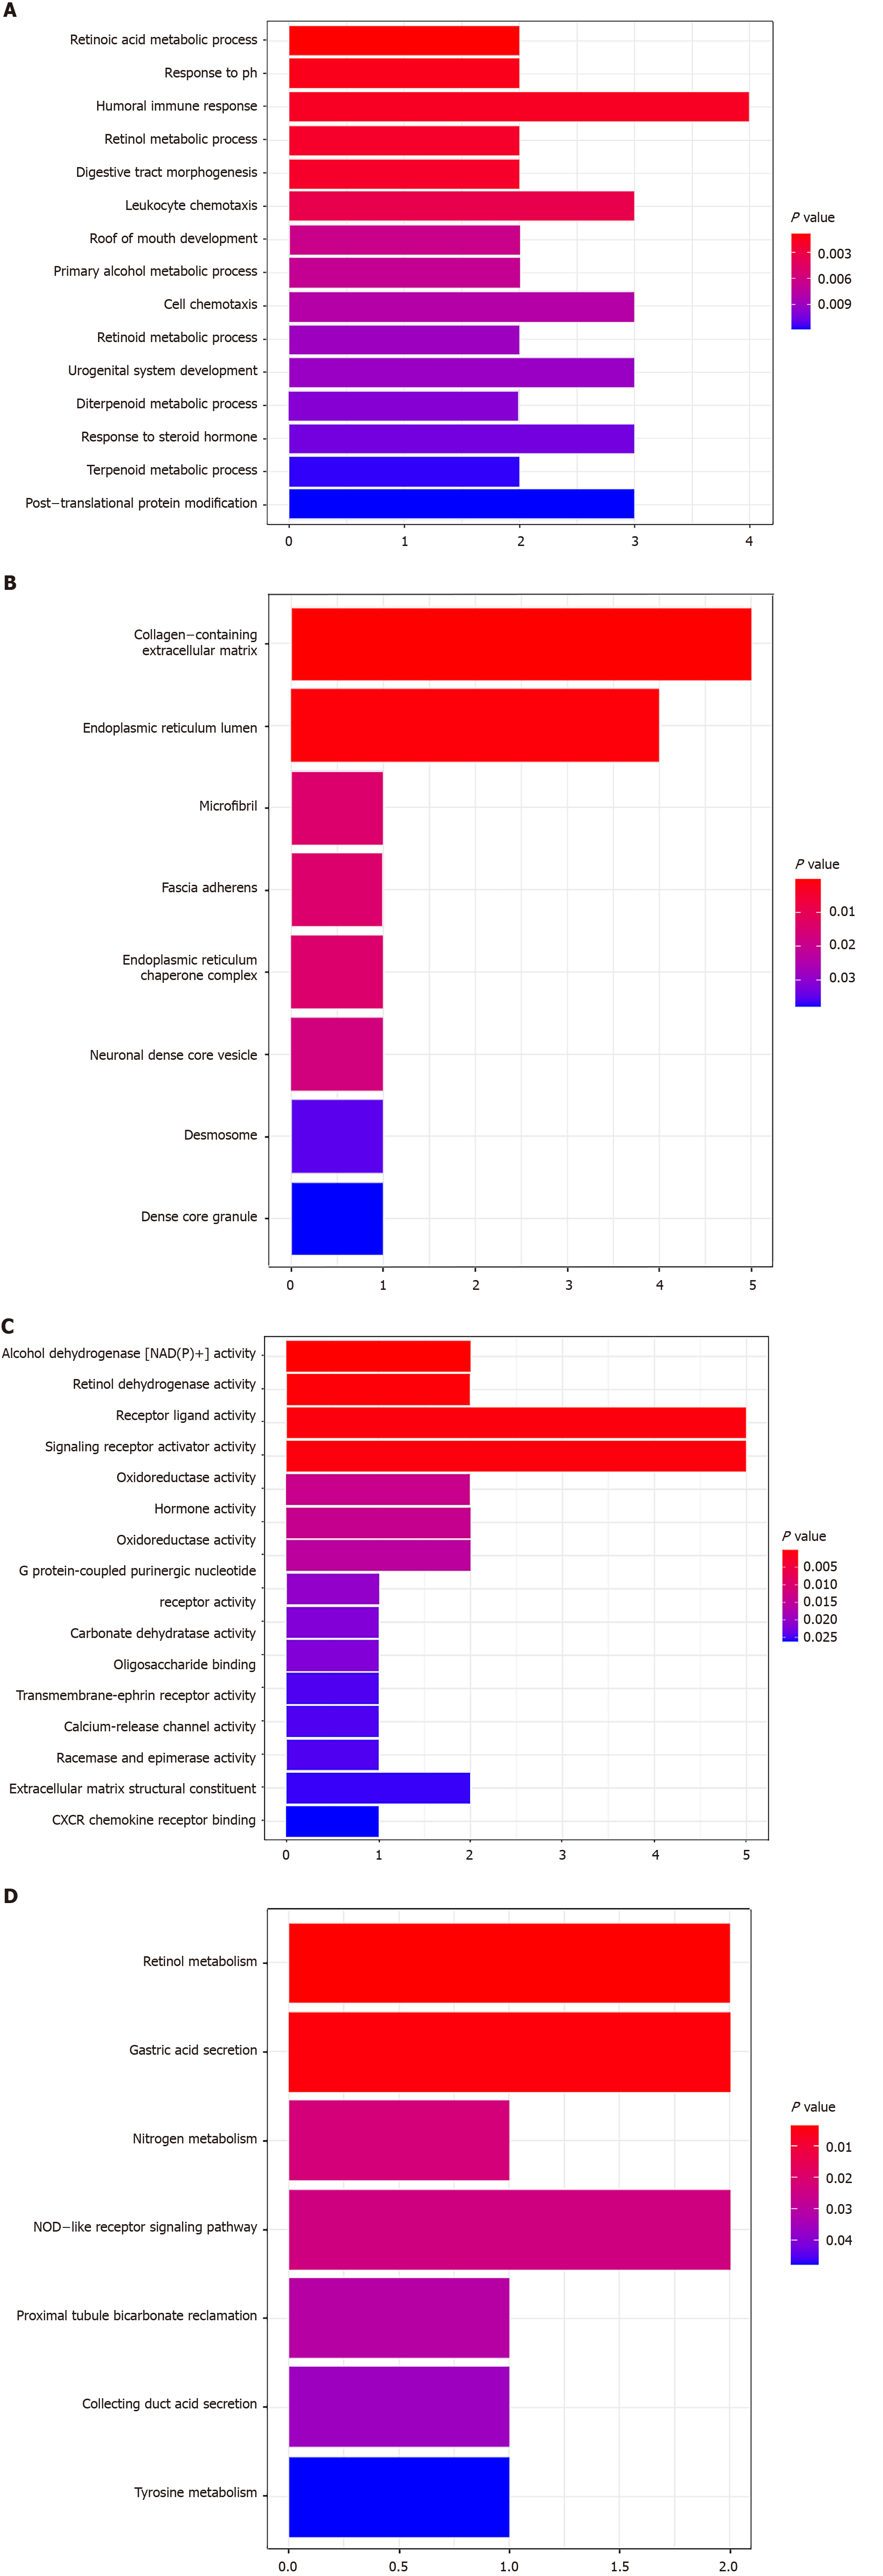
Figure 7 GO and KEGG pathway analyses of the identified mRNAs in the competing endogenous RNA network.
A: GO analysis of biological processes; B: GO analysis of cellular components; C: GO analysis of molecular functions; D: KEGG pathway analysis. P < 0.05 were considered significant.
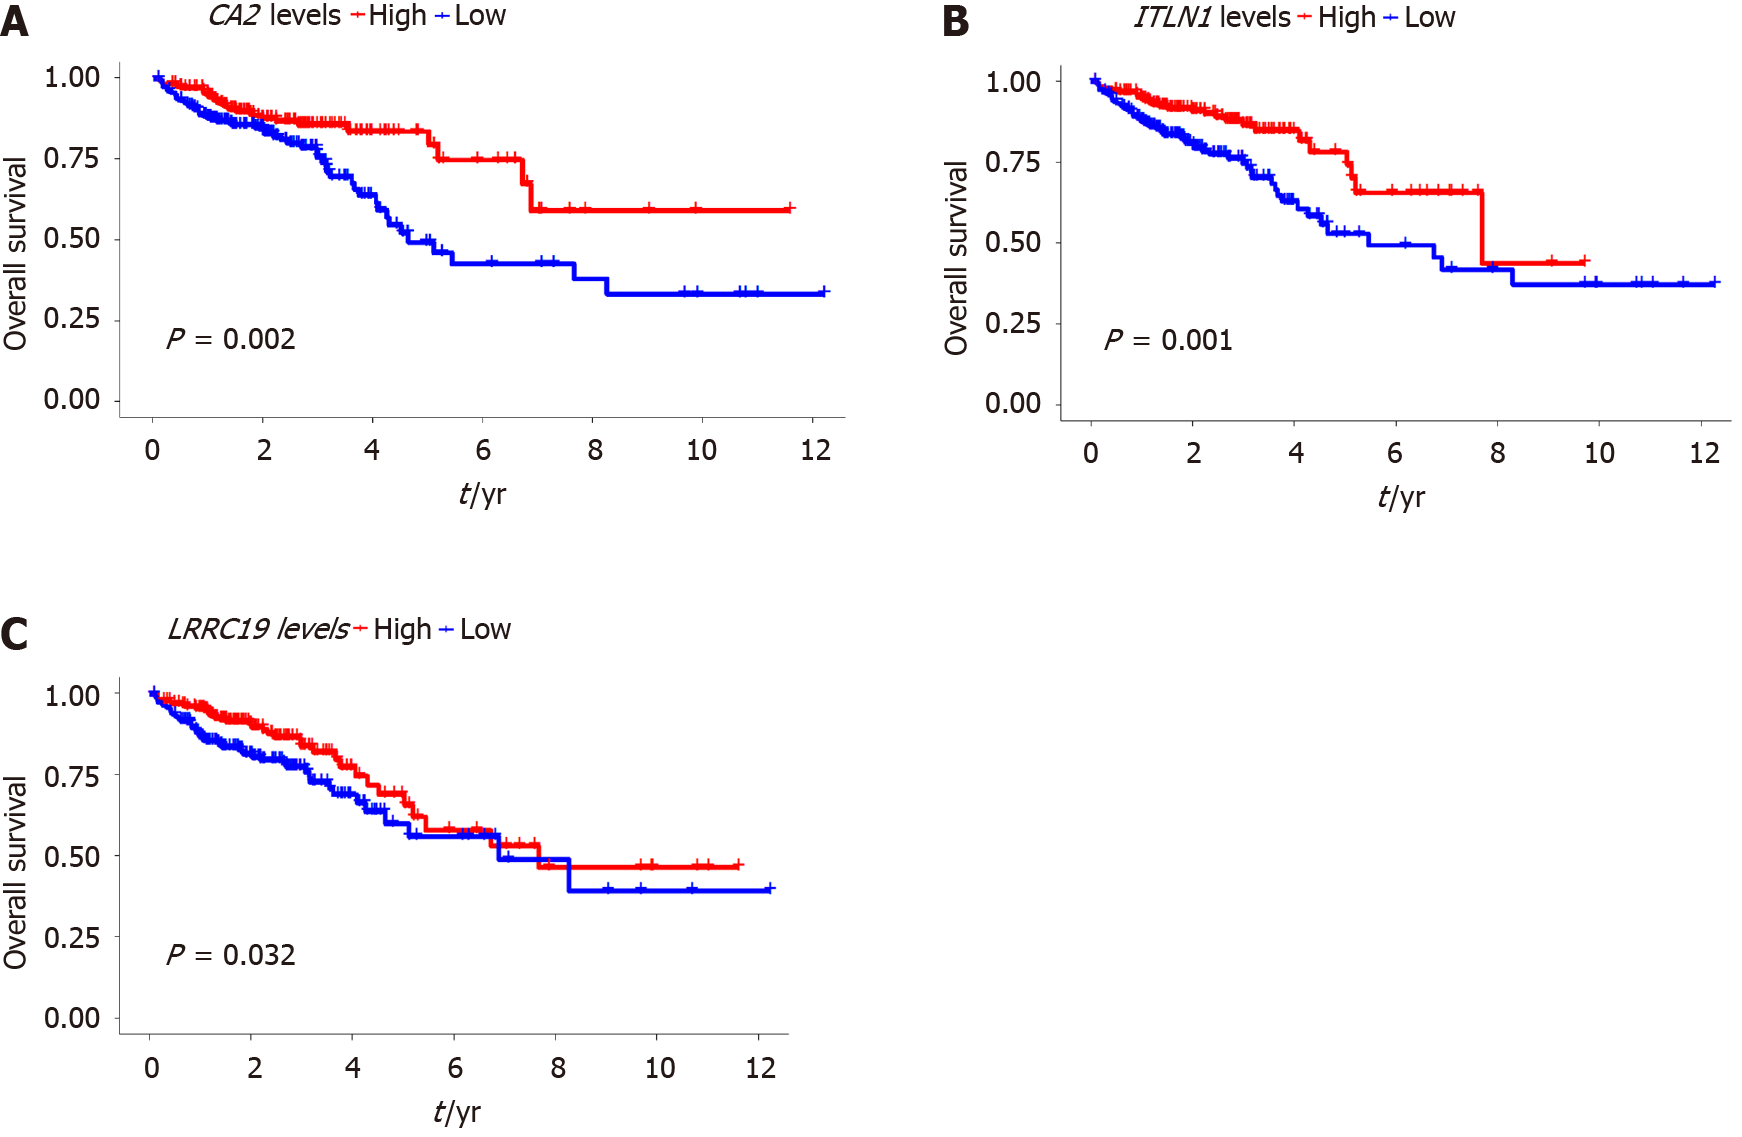
Figure 8 Survival analysis of the identified mRNAs in the circRNA-miRNA-mRNA regulatory network using The Cancer Genome Atlas database.
A: Comparison between patients with upregulation or downregulation of CA2 (P = 0.002); B: Comparison between patients with upregulation or downregulation of ITLN1 (P = 0.001); C: Comparison between patients with upregulation or downregulation of LRRC19 (P = 0.032).
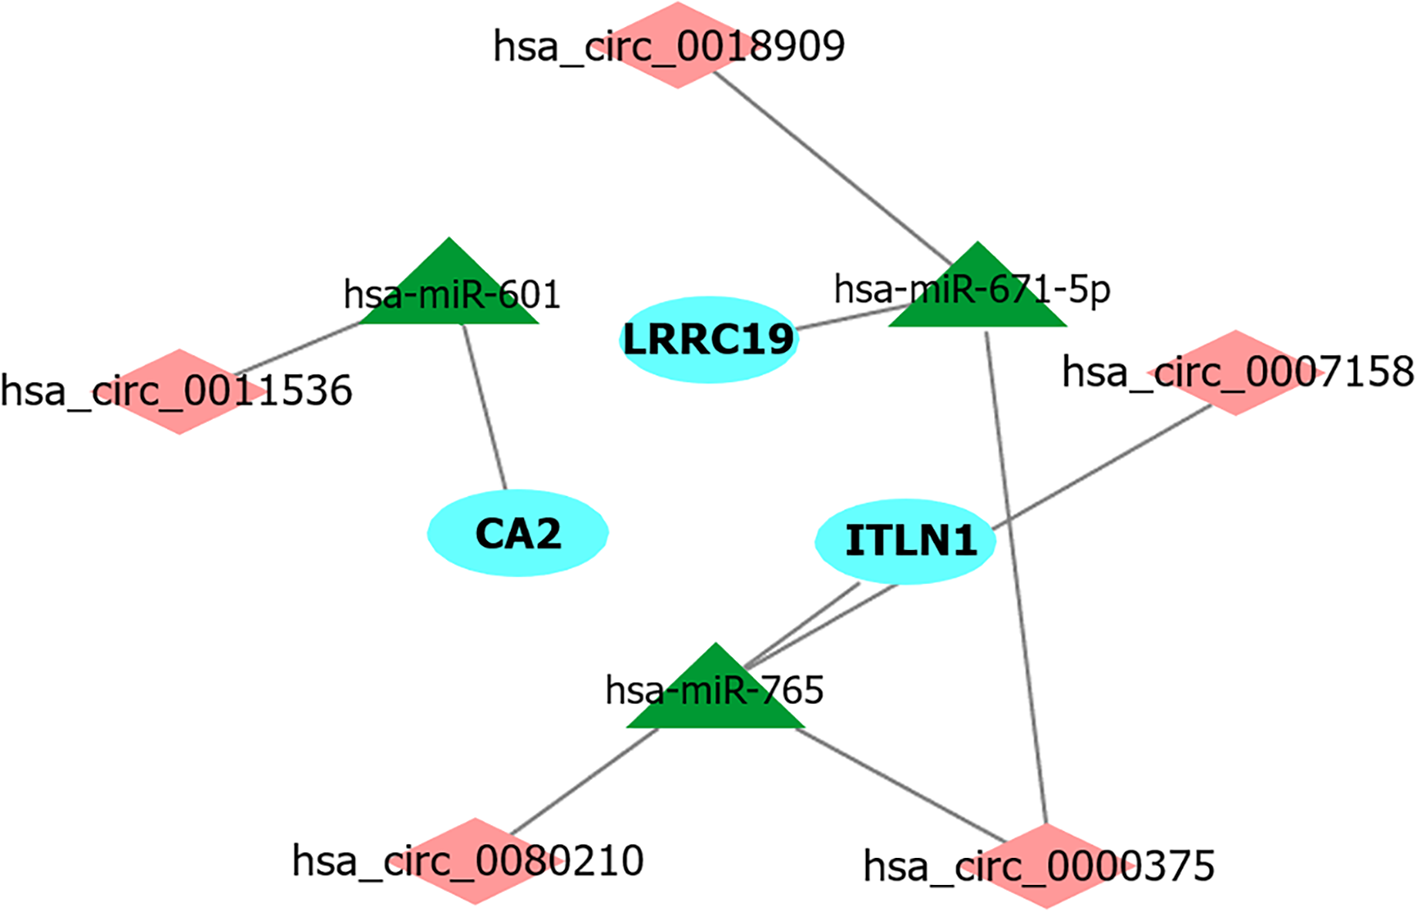
Figure 9 The competing endogenous RNA subnetwork associated with colorectal cancer prognosis.
Based on mRNAs with potential for the clinical outcome prediction of colorectal cancer, a prognostic competing endogenous RNA subnetwork was successfully developed. Diamonds, triangles and ellipses represent circRNAs, miRNAs and mRNAs, respectively.
- Citation: Yin TF, Zhao DY, Zhou YC, Wang QQ, Yao SK. Identification of the circRNA-miRNA-mRNA regulatory network and its prognostic effect in colorectal cancer. World J Clin Cases 2021; 9(18): 4520-4541
- URL: https://www.wjgnet.com/2307-8960/full/v9/i18/4520.htm
- DOI: https://dx.doi.org/10.12998/wjcc.v9.i18.4520


