Copyright
©The Author(s) 2021.
World J Clin Cases. Apr 16, 2021; 9(11): 2662-2670
Published online Apr 16, 2021. doi: 10.12998/wjcc.v9.i11.2662
Published online Apr 16, 2021. doi: 10.12998/wjcc.v9.i11.2662
Figure 1 Computed tomography images of Case 1.
The images showed an irregular calcified mass in the right temporomandibular joint with a clear boundary. The mass destroyed the skull base and extended to the middle cranial fossa (arrow).
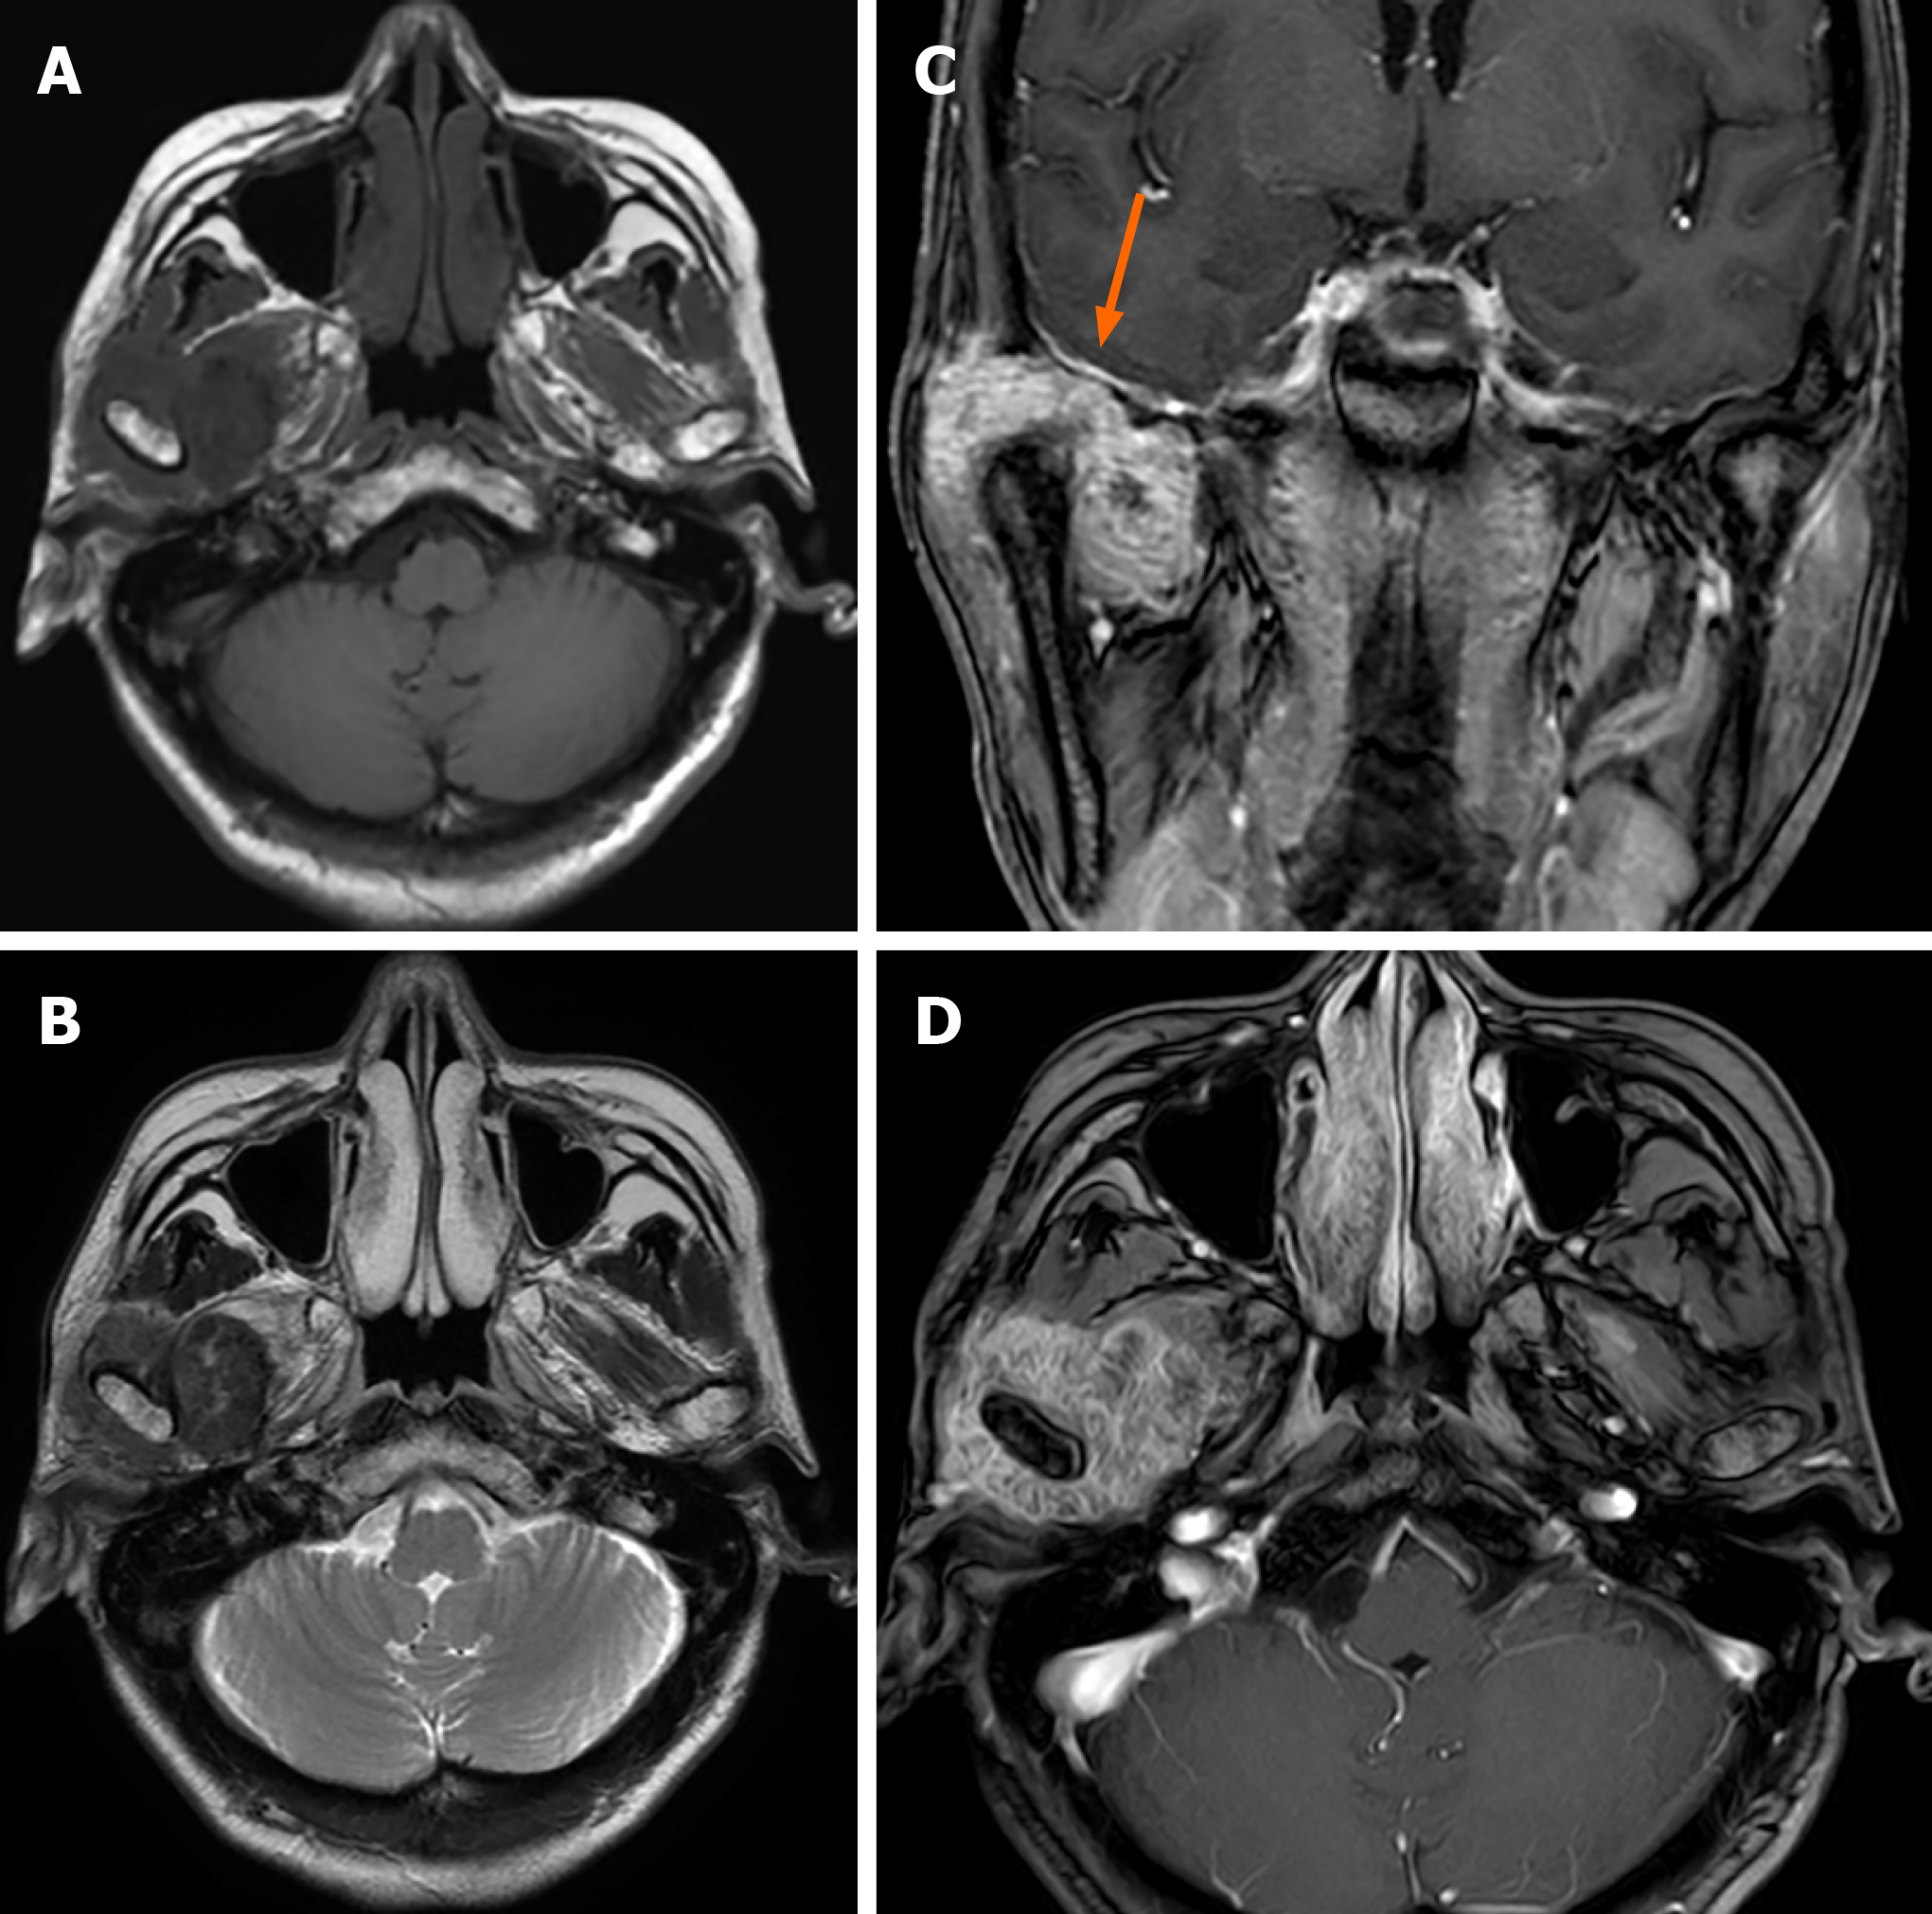
Figure 2 Magnetic resonance imaging images of Case 1.
Axial T1-weighted image (A) and T2-weighted image (B) showed a hypointense mass. The lesion was markedly enhanced after enhancement (C and D) and in contact with the dura mater on the inferior surface (C, arrow).
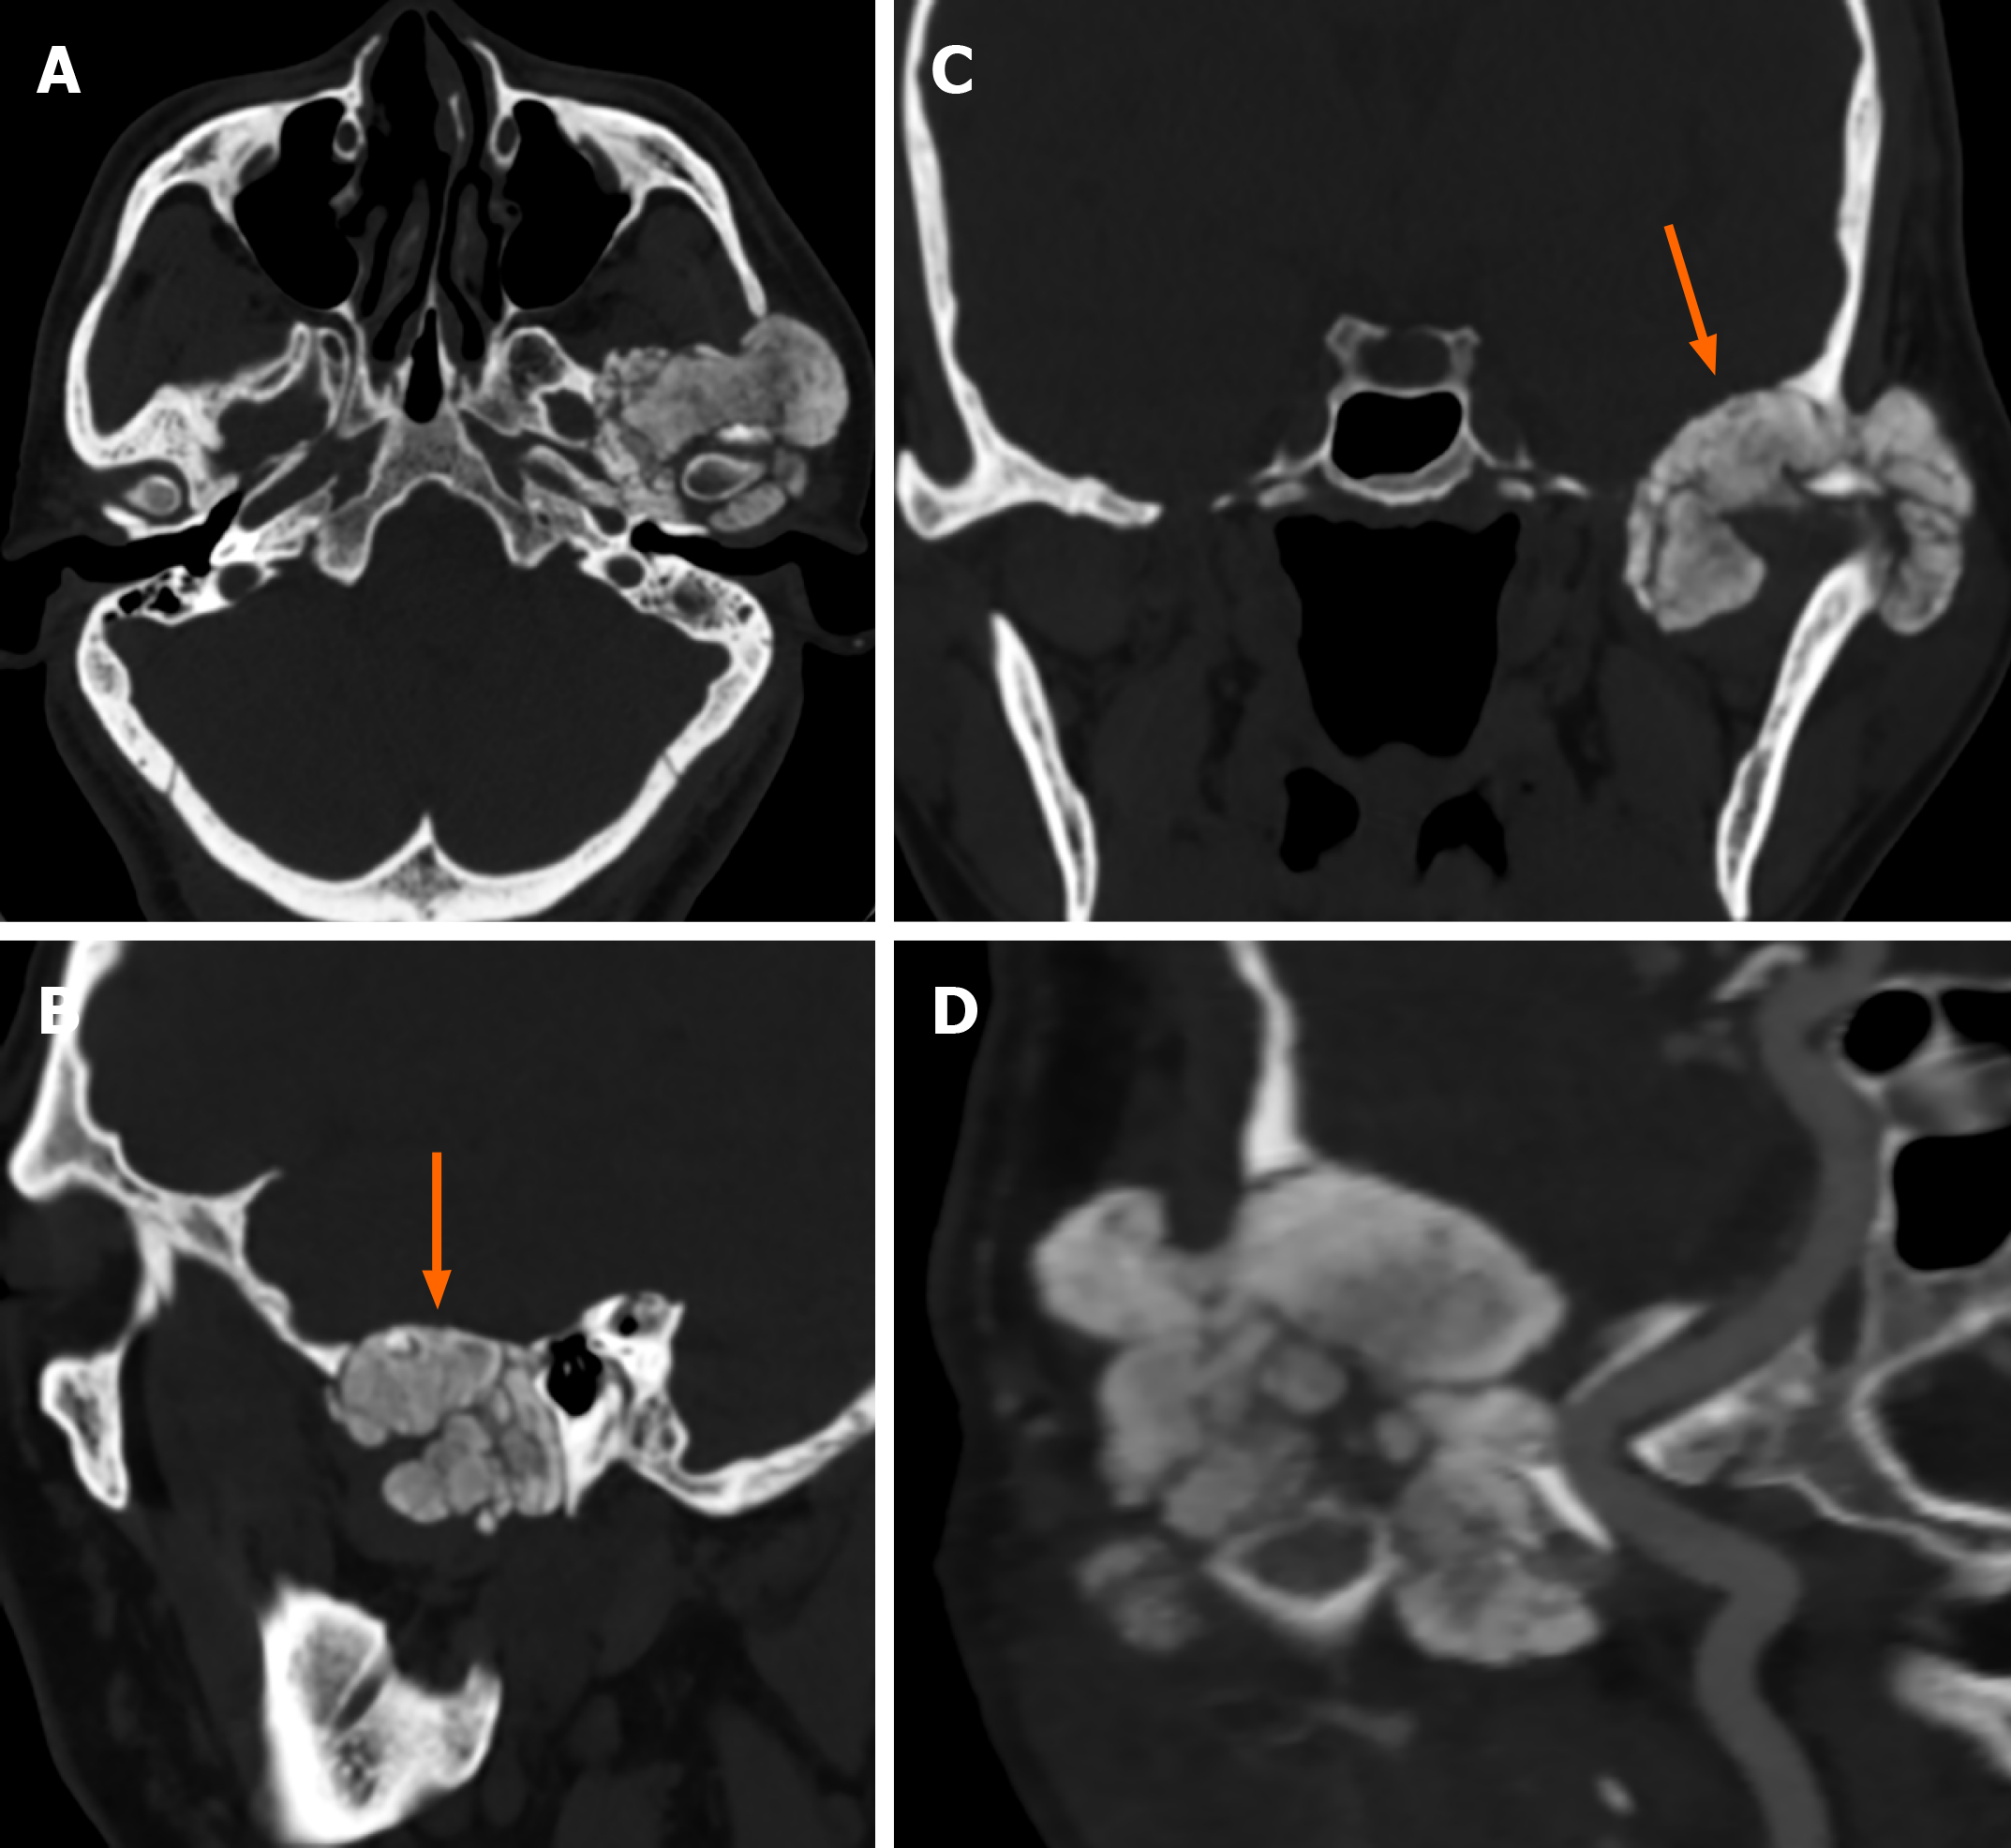
Figure 3 Computed tomography images of Case 2.
A calcified mass in the left temporomandibular joint was shown via computed tomography (A). The mass infiltrated the middle cranial fossa by destroying the skull base (B and C, arrow) and was adjacent to the left internal carotid artery (D).
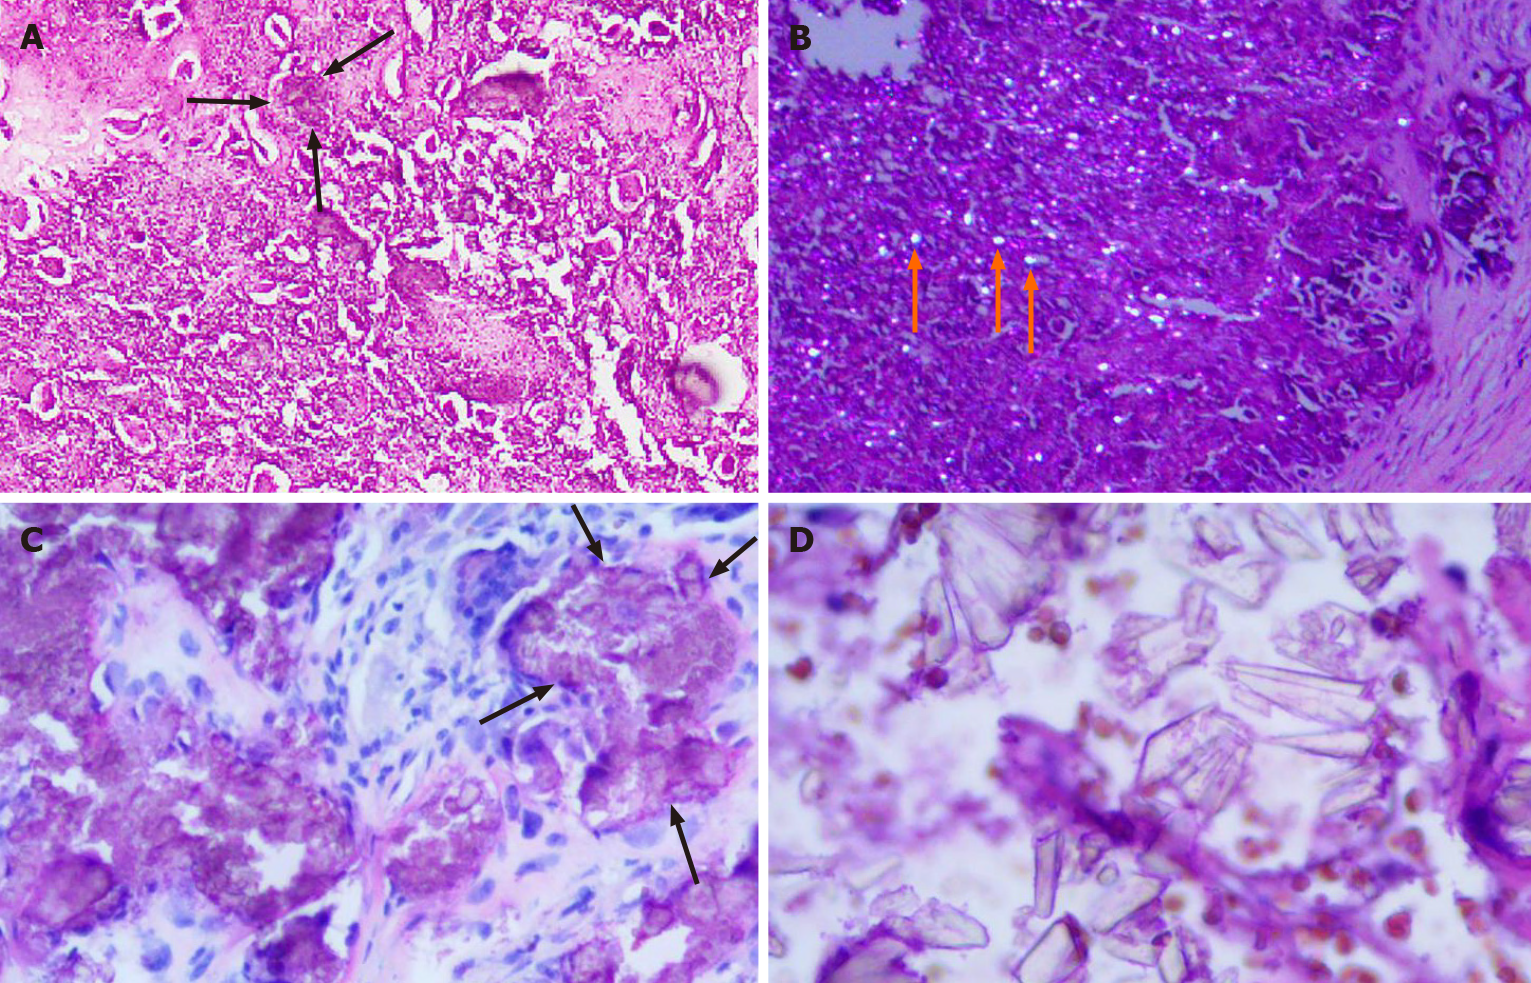
Figure 4 Histopathology of Case 1 and Case 2.
A: There are crystal deposits (black arrows) in the fibrous tissue. The crystal deposits are surrounded by foreign body type giant cells and fibroblasts (hematoxylin-eosin staining, × 100; Case 1); B: Crystalline material (orange arrows) deposits exhibiting birefringence under polarized light (hematoxylin-eosin staining, × 100; Case 1); C: Nodular clusters of calcium pyrophosphate dihydrate crystals (black arrows) could be seen (hematoxylin-eosin staining, × 200; Case 2); D: Crystals of different shapes with strong stereoscopic effect (hematoxylin-eosin staining, × 400; Case 2).
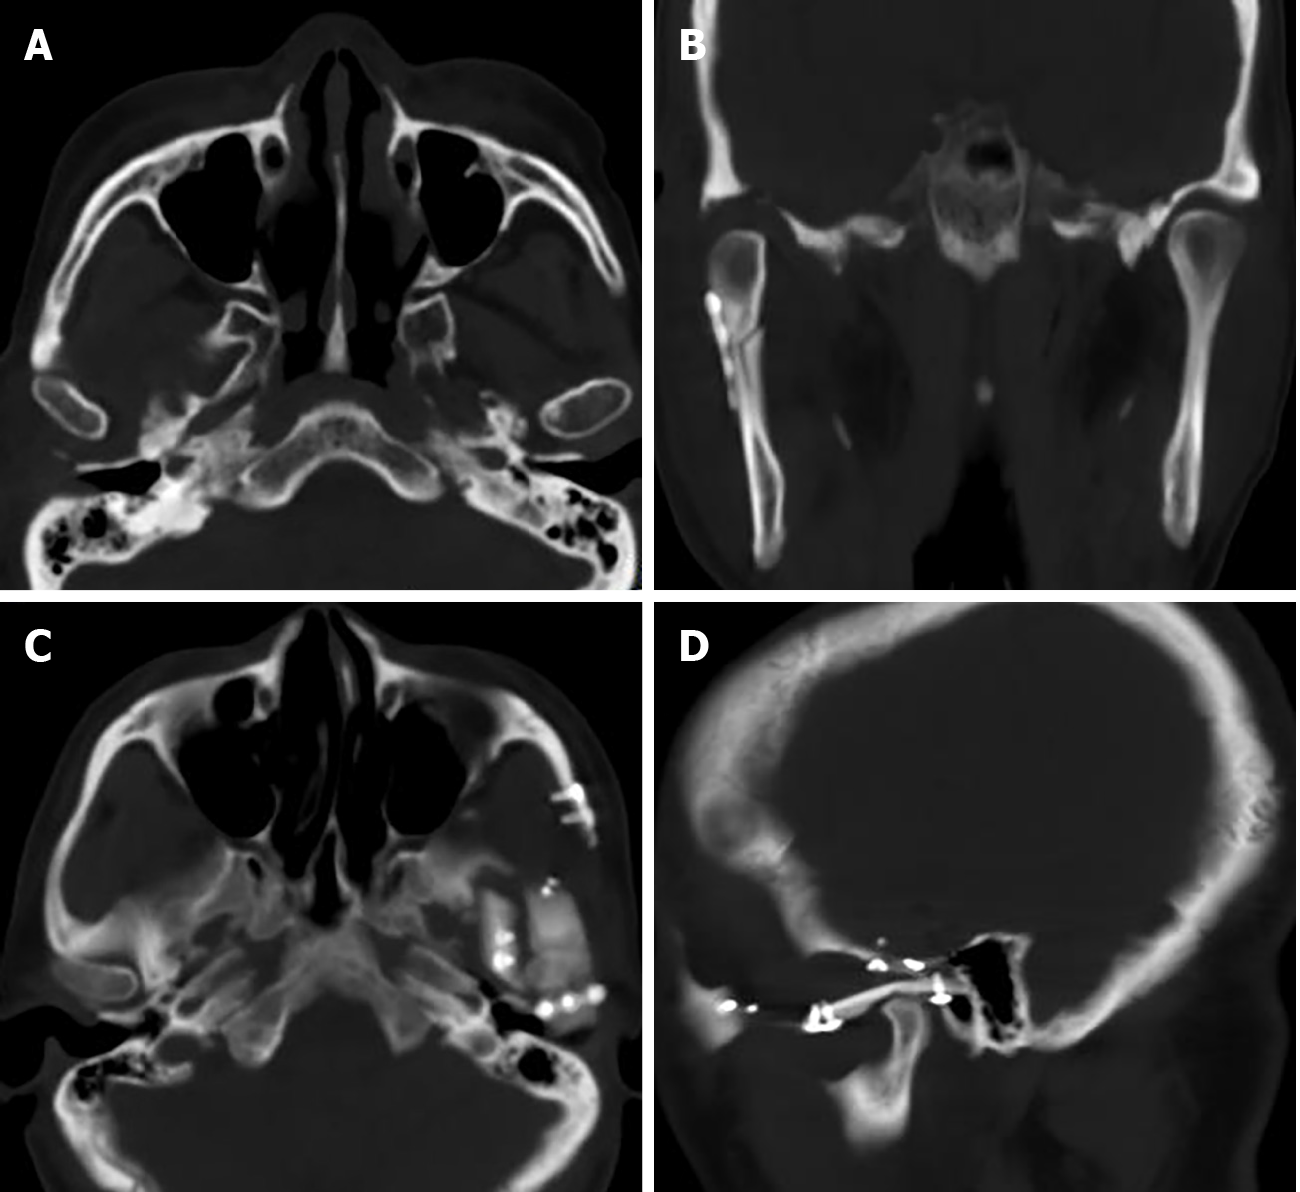
Figure 5 Computed tomography images of Case 1 and Case 2.
A and B: One week after surgery, a computed tomography scan showed that the mass in the right temporomandibular joint was completely removed (Case 1); C and D: No recurrence of the mass was observed one year after the operation (Case 2).
- Citation: Tang T, Han FG. Calcium pyrophosphate deposition disease of the temporomandibular joint invading the middle cranial fossa: Two case reports. World J Clin Cases 2021; 9(11): 2662-2670
- URL: https://www.wjgnet.com/2307-8960/full/v9/i11/2662.htm
- DOI: https://dx.doi.org/10.12998/wjcc.v9.i11.2662


