Copyright
©The Author(s) 2020.
World J Clin Cases. Jan 26, 2020; 8(2): 343-352
Published online Jan 26, 2020. doi: 10.12998/wjcc.v8.i2.343
Published online Jan 26, 2020. doi: 10.12998/wjcc.v8.i2.343
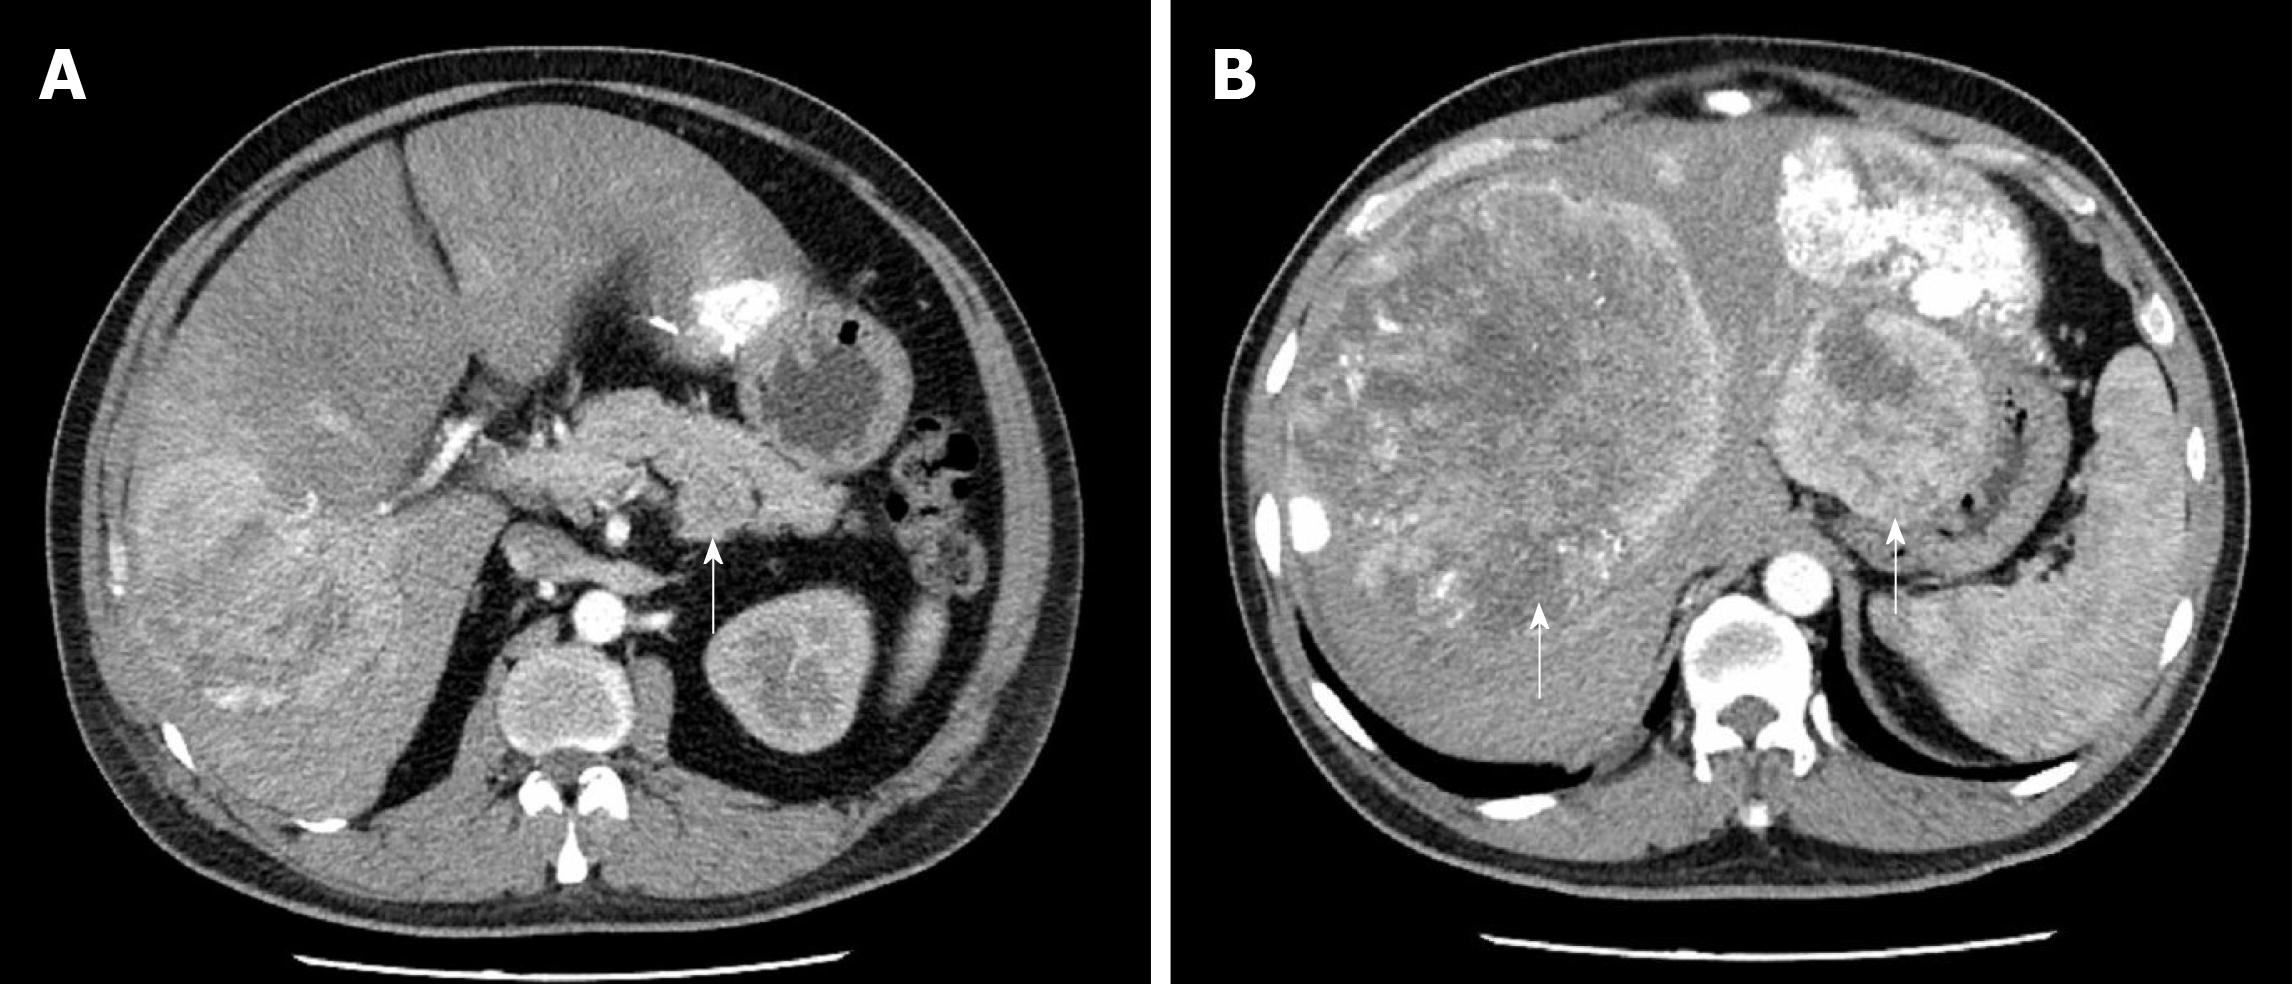
Figure 1 Computed tomography imaging of the abdomen.
A: A 4.7 cm × 4.4 cm mass (white arrow) located in the body of pancreas. Non-uniform enhancement was observed from the arterial phase [computed tomography (CT) value = 68 Hu] to portal venous phase (CT value = 59 Hu); B: Numerous liver metastatic tumors (white arrows). Enhanced scanning showed irregular enhancement and the largest one located in segment VIII measured 15.9 cm.
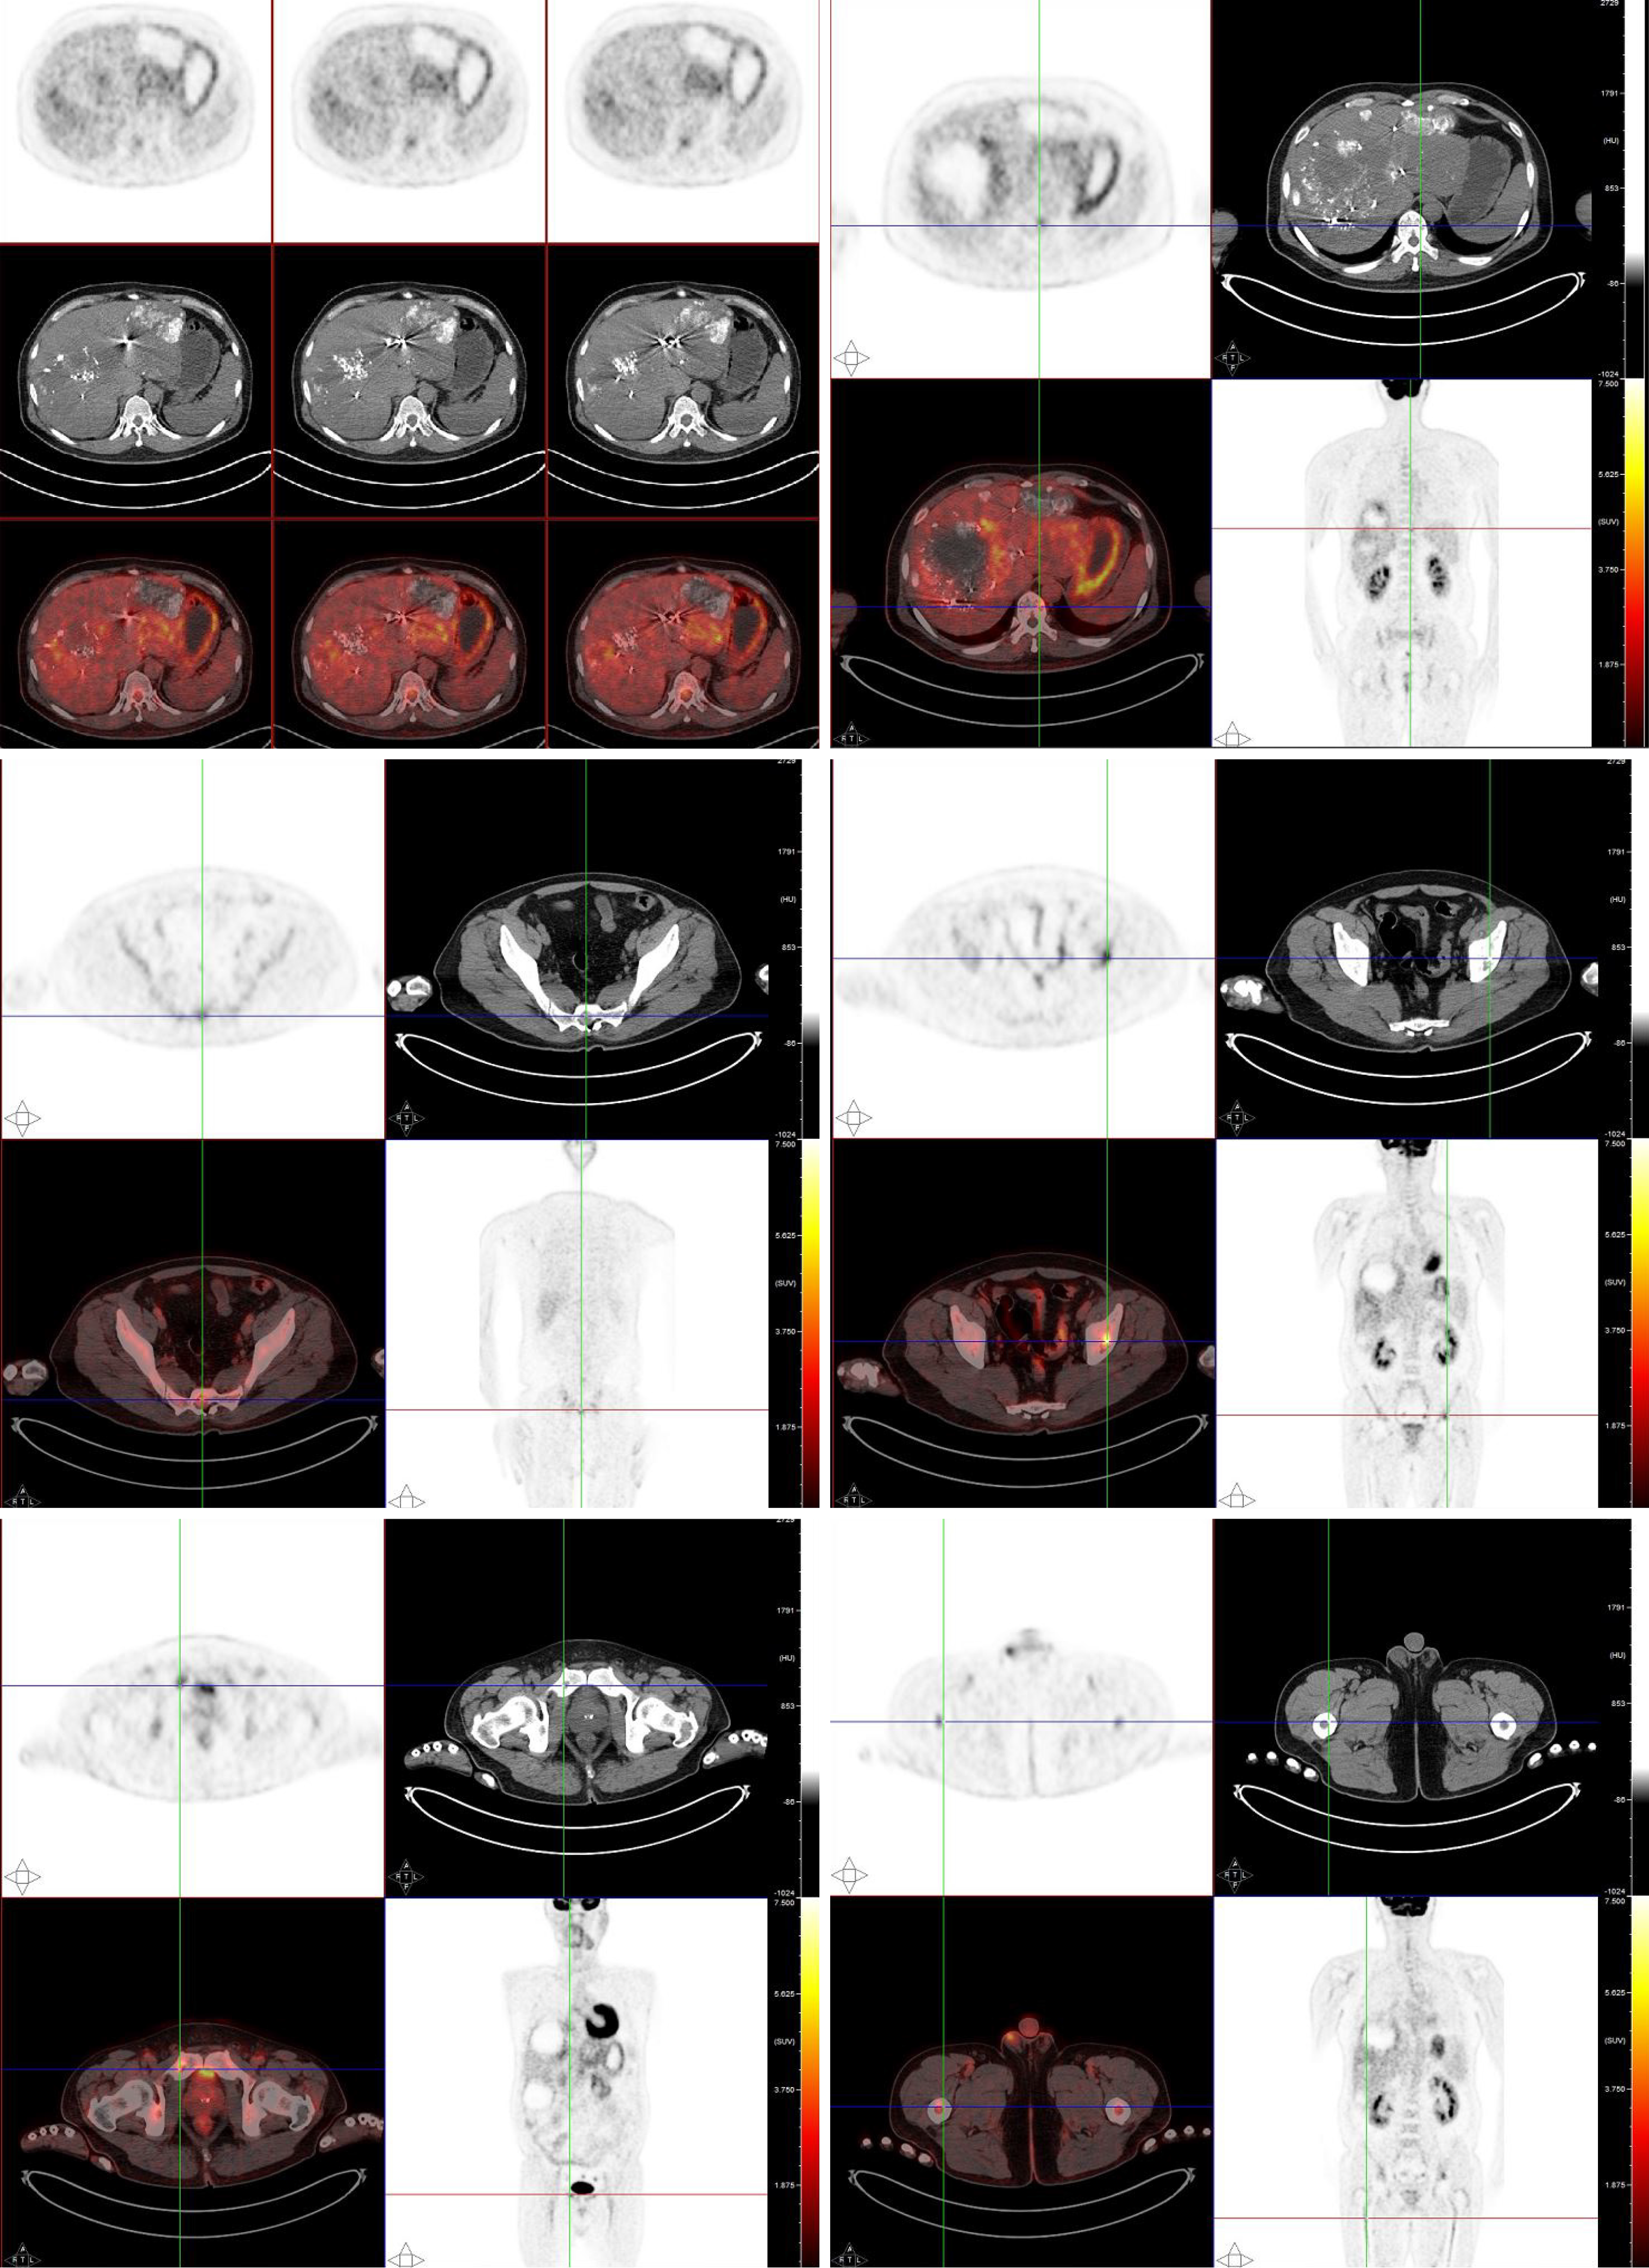
Figure 2 Systemic fluorine-18 fluorodeoxyglucose positron emission tomography/computed tomography scan.
The positron emission tomography/computed tomography scan revealed an increased uptake of fluorodeoxyglucose in the liver and heterogeneous fluorodeoxyglucose uptake in multiple bones.
Figure 3 Photographs of cut surface of surgical specimens.
A: A soft mass located in the body of pancreas. Hemorrhage and necrosis changes can be seen in the cut surface; B: The pale-yellow cut surface of the hepatic metastasis.
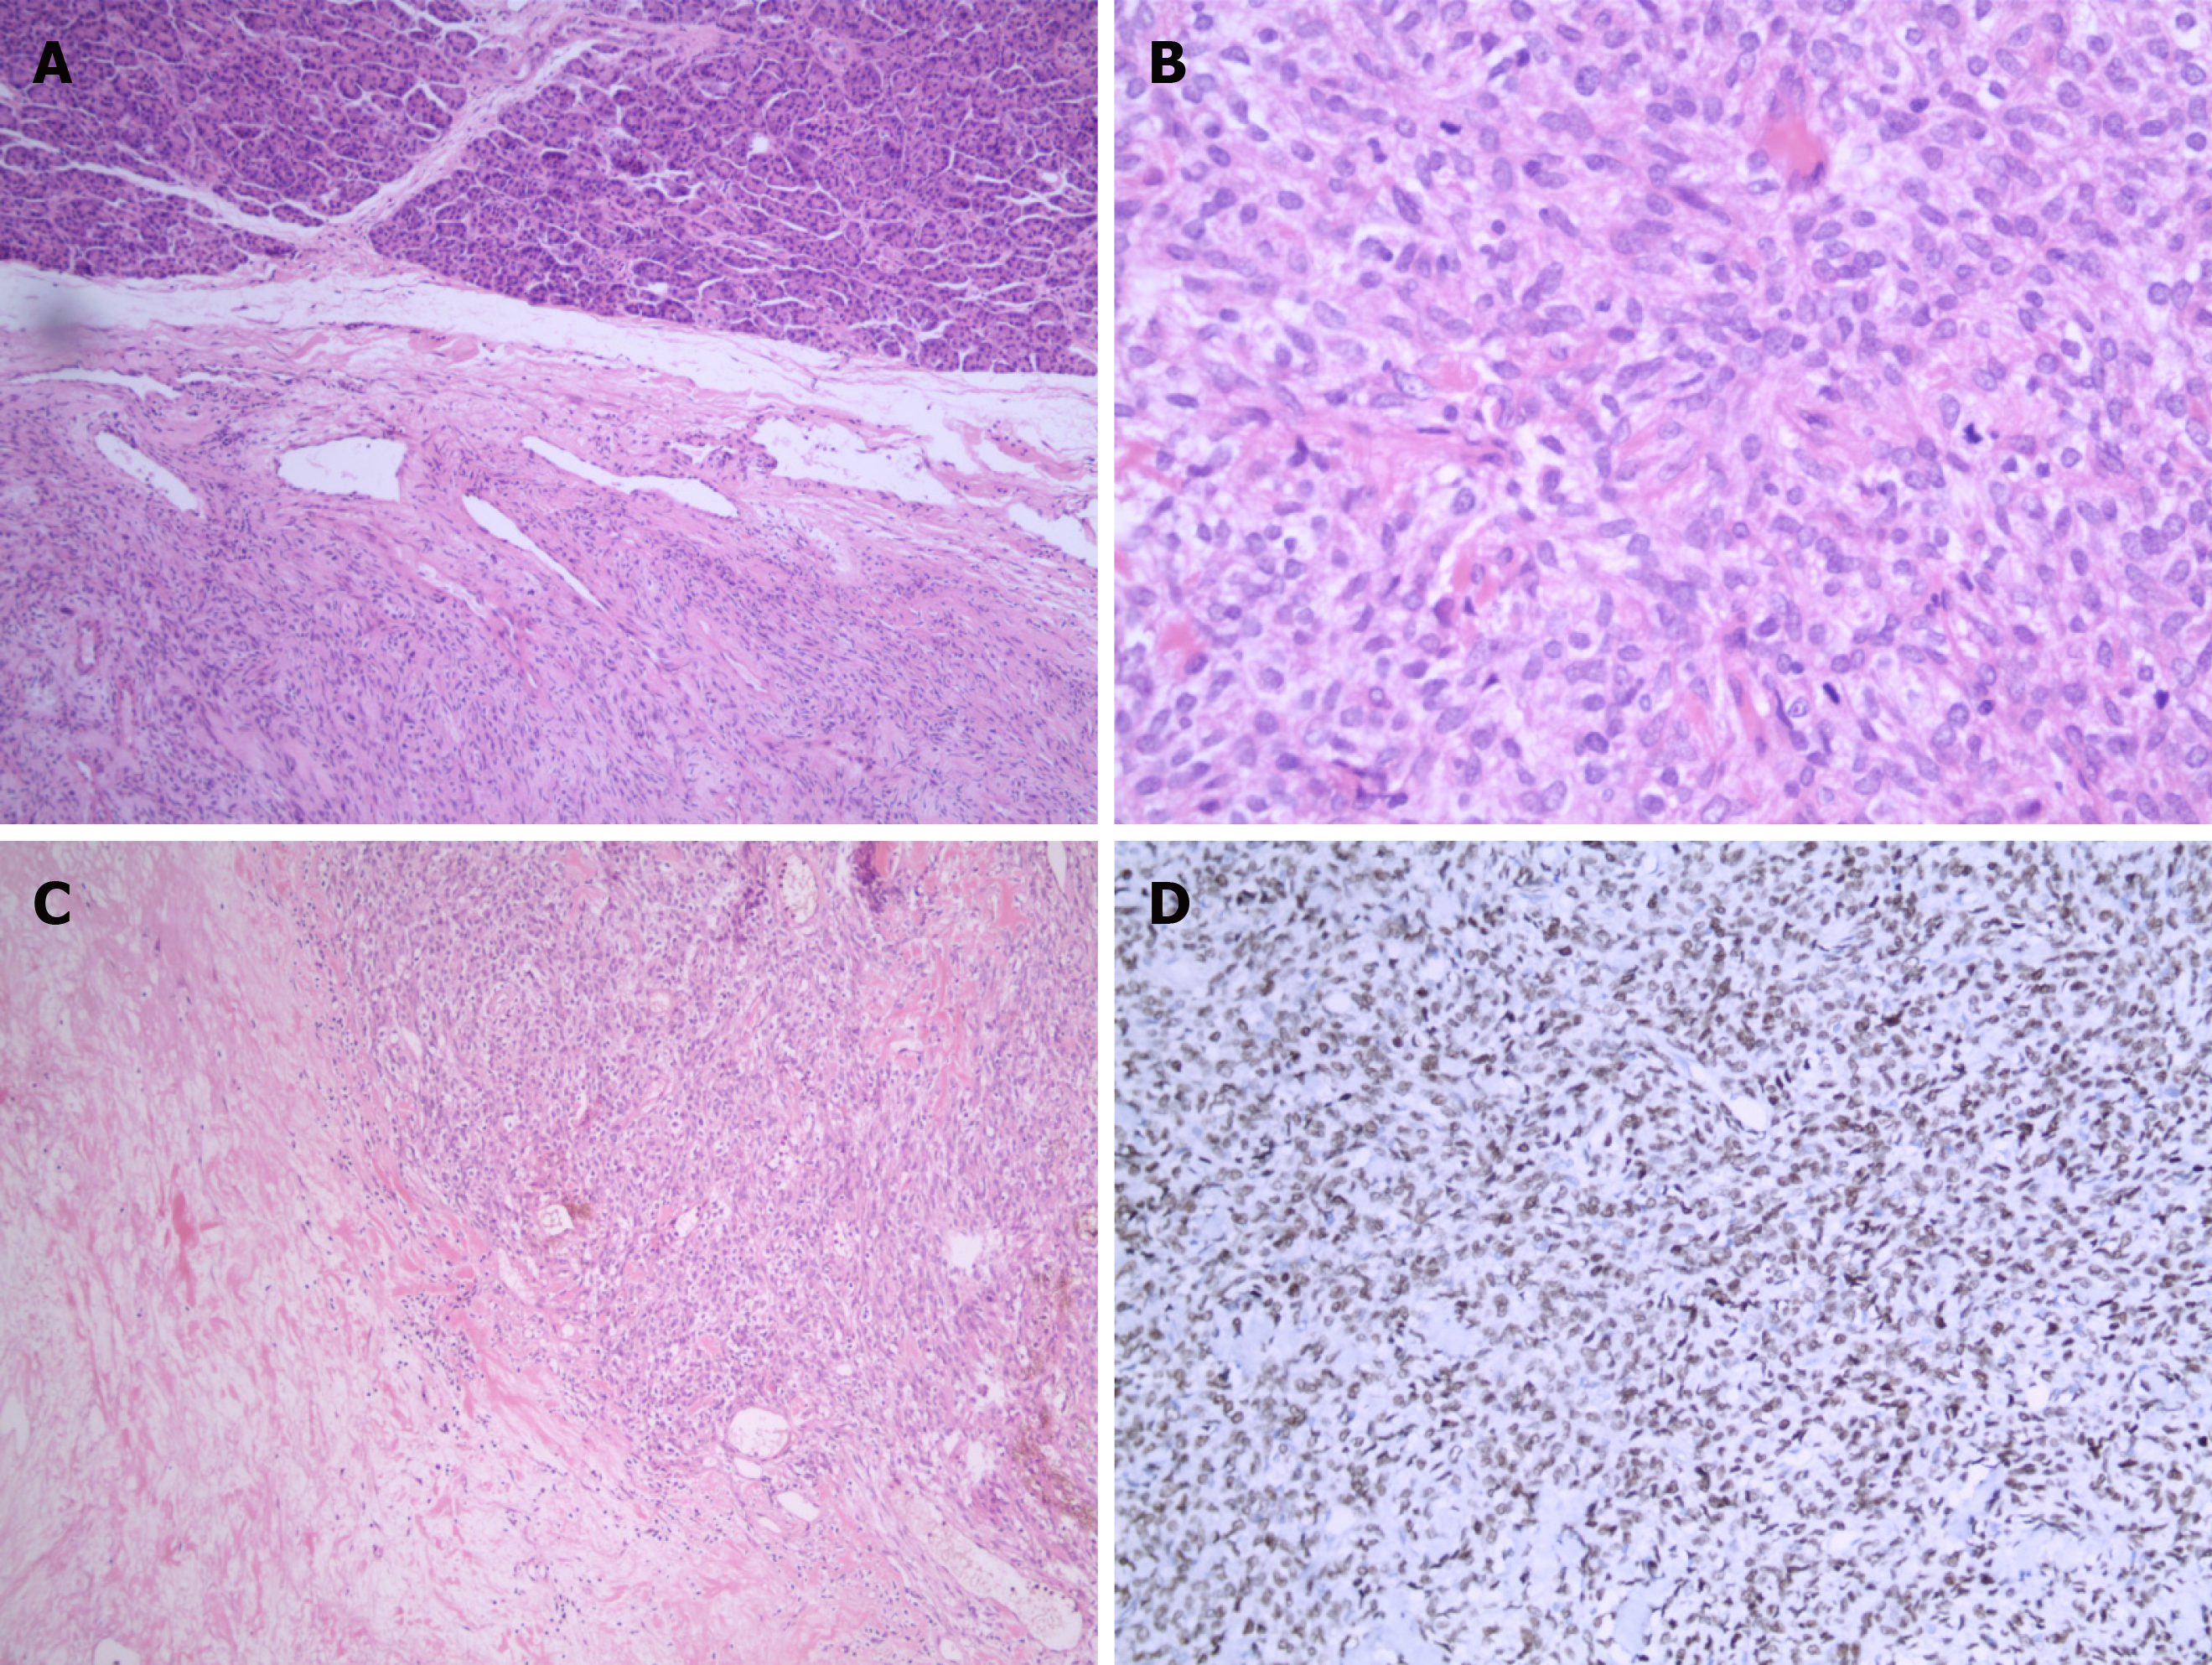
Figure 4 Photomicrographs of histologic and immunohistochemical staining.
A: Various atypical spindled cells irregularly arranged in the stroma [hematoxylin-eosin (HE) staining; magnification: ×50]; B: Histologic demonstration of mitotic activity (HE staining; magnification: ×200); C: Presence of necrosis (HE staining; magnification: ×100); D: Immunohistochemical staining for STAT6 showed diffused positivity in tumor cells (magnification: ×100).
Figure 5 Timeline.
A brief summary of the patient’s medical history is presented. TACE: Transcatheter arterial chemoembolization.
- Citation: Geng H, Ye Y, Jin Y, Li BZ, Yu YQ, Feng YY, Li JT. Malignant solitary fibrous tumor of the pancreas with systemic metastasis: A case report and review of the literature. World J Clin Cases 2020; 8(2): 343-352
- URL: https://www.wjgnet.com/2307-8960/full/v8/i2/343.htm
- DOI: https://dx.doi.org/10.12998/wjcc.v8.i2.343


