Copyright
©The Author(s) 2020.
World J Clin Cases. Jan 26, 2020; 8(2): 325-330
Published online Jan 26, 2020. doi: 10.12998/wjcc.v8.i2.325
Published online Jan 26, 2020. doi: 10.12998/wjcc.v8.i2.325
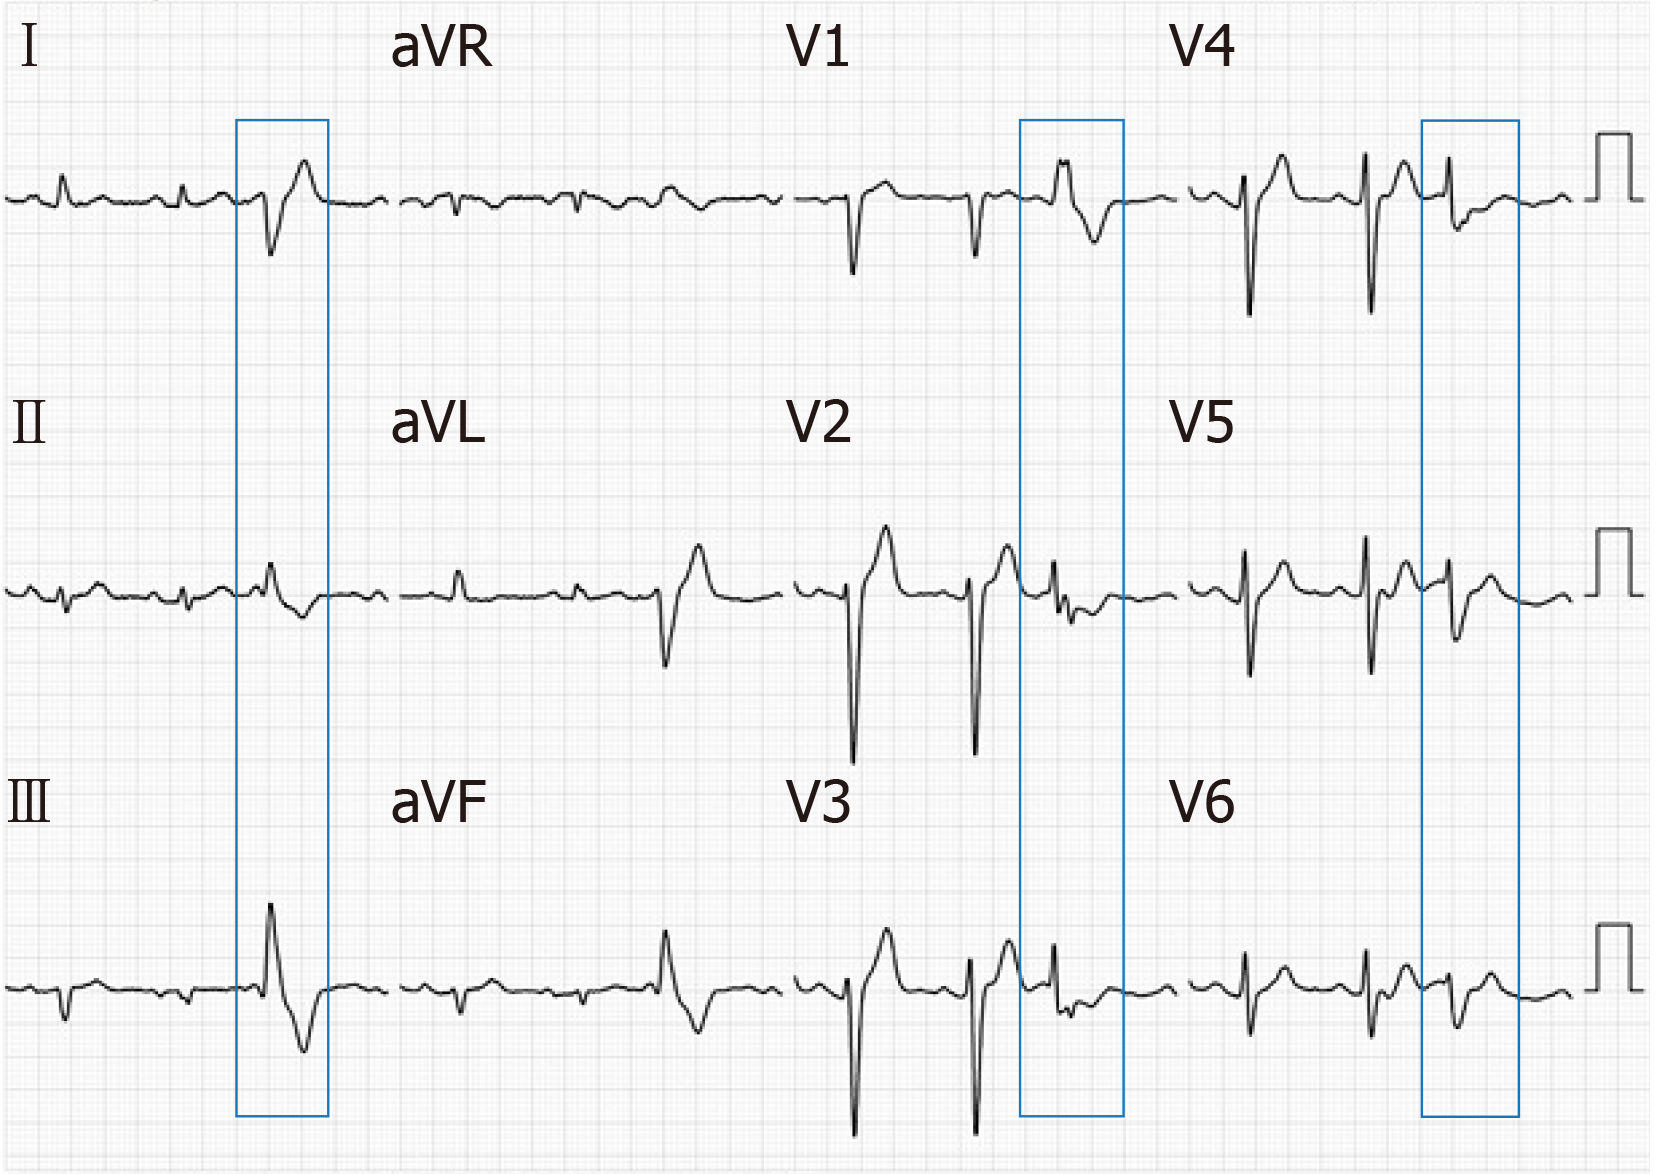
Figure 1 12-lead Electrocardiograph of the patient, the blue frame shows premature ventricular complexes.
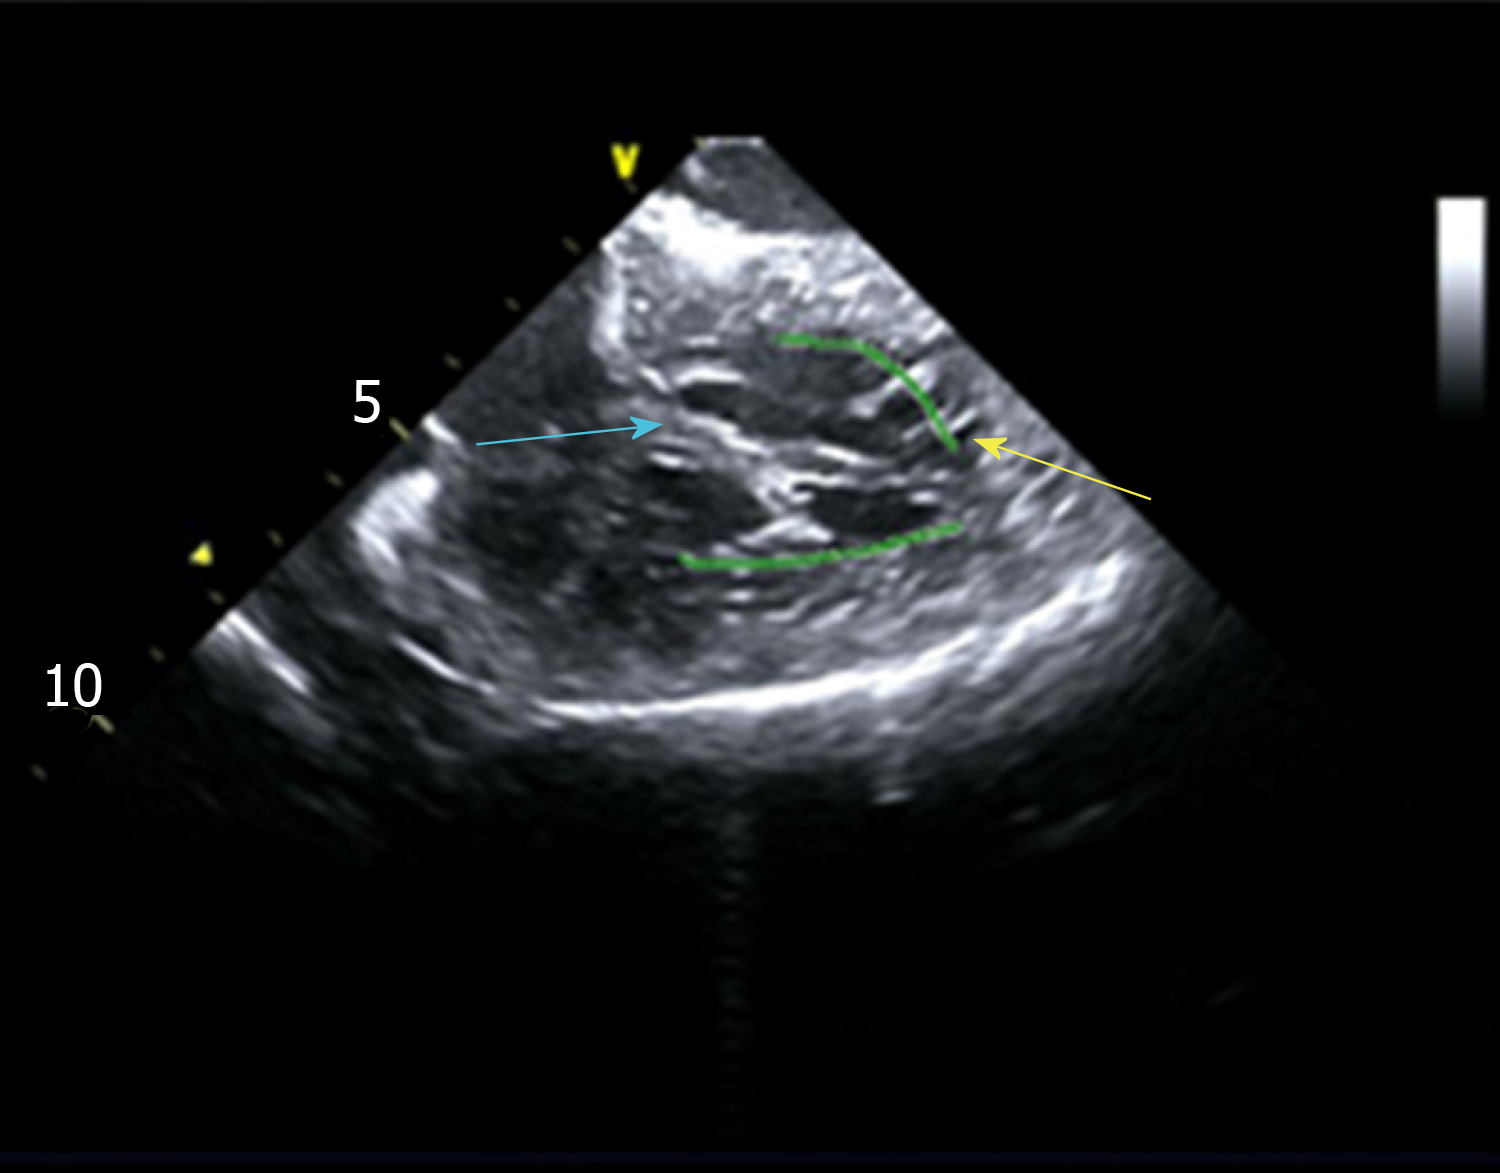
Figure 2 Left ventricular false tendons were detected by intracardiac two-dimensional echocardiography.
The yellow arrow indicates the ventricular apex attachment spot of the left ventricular false tendon, and the biue arrow indicates the basal side of the interventricular septum attachment spot of the left ventricular false tendon.
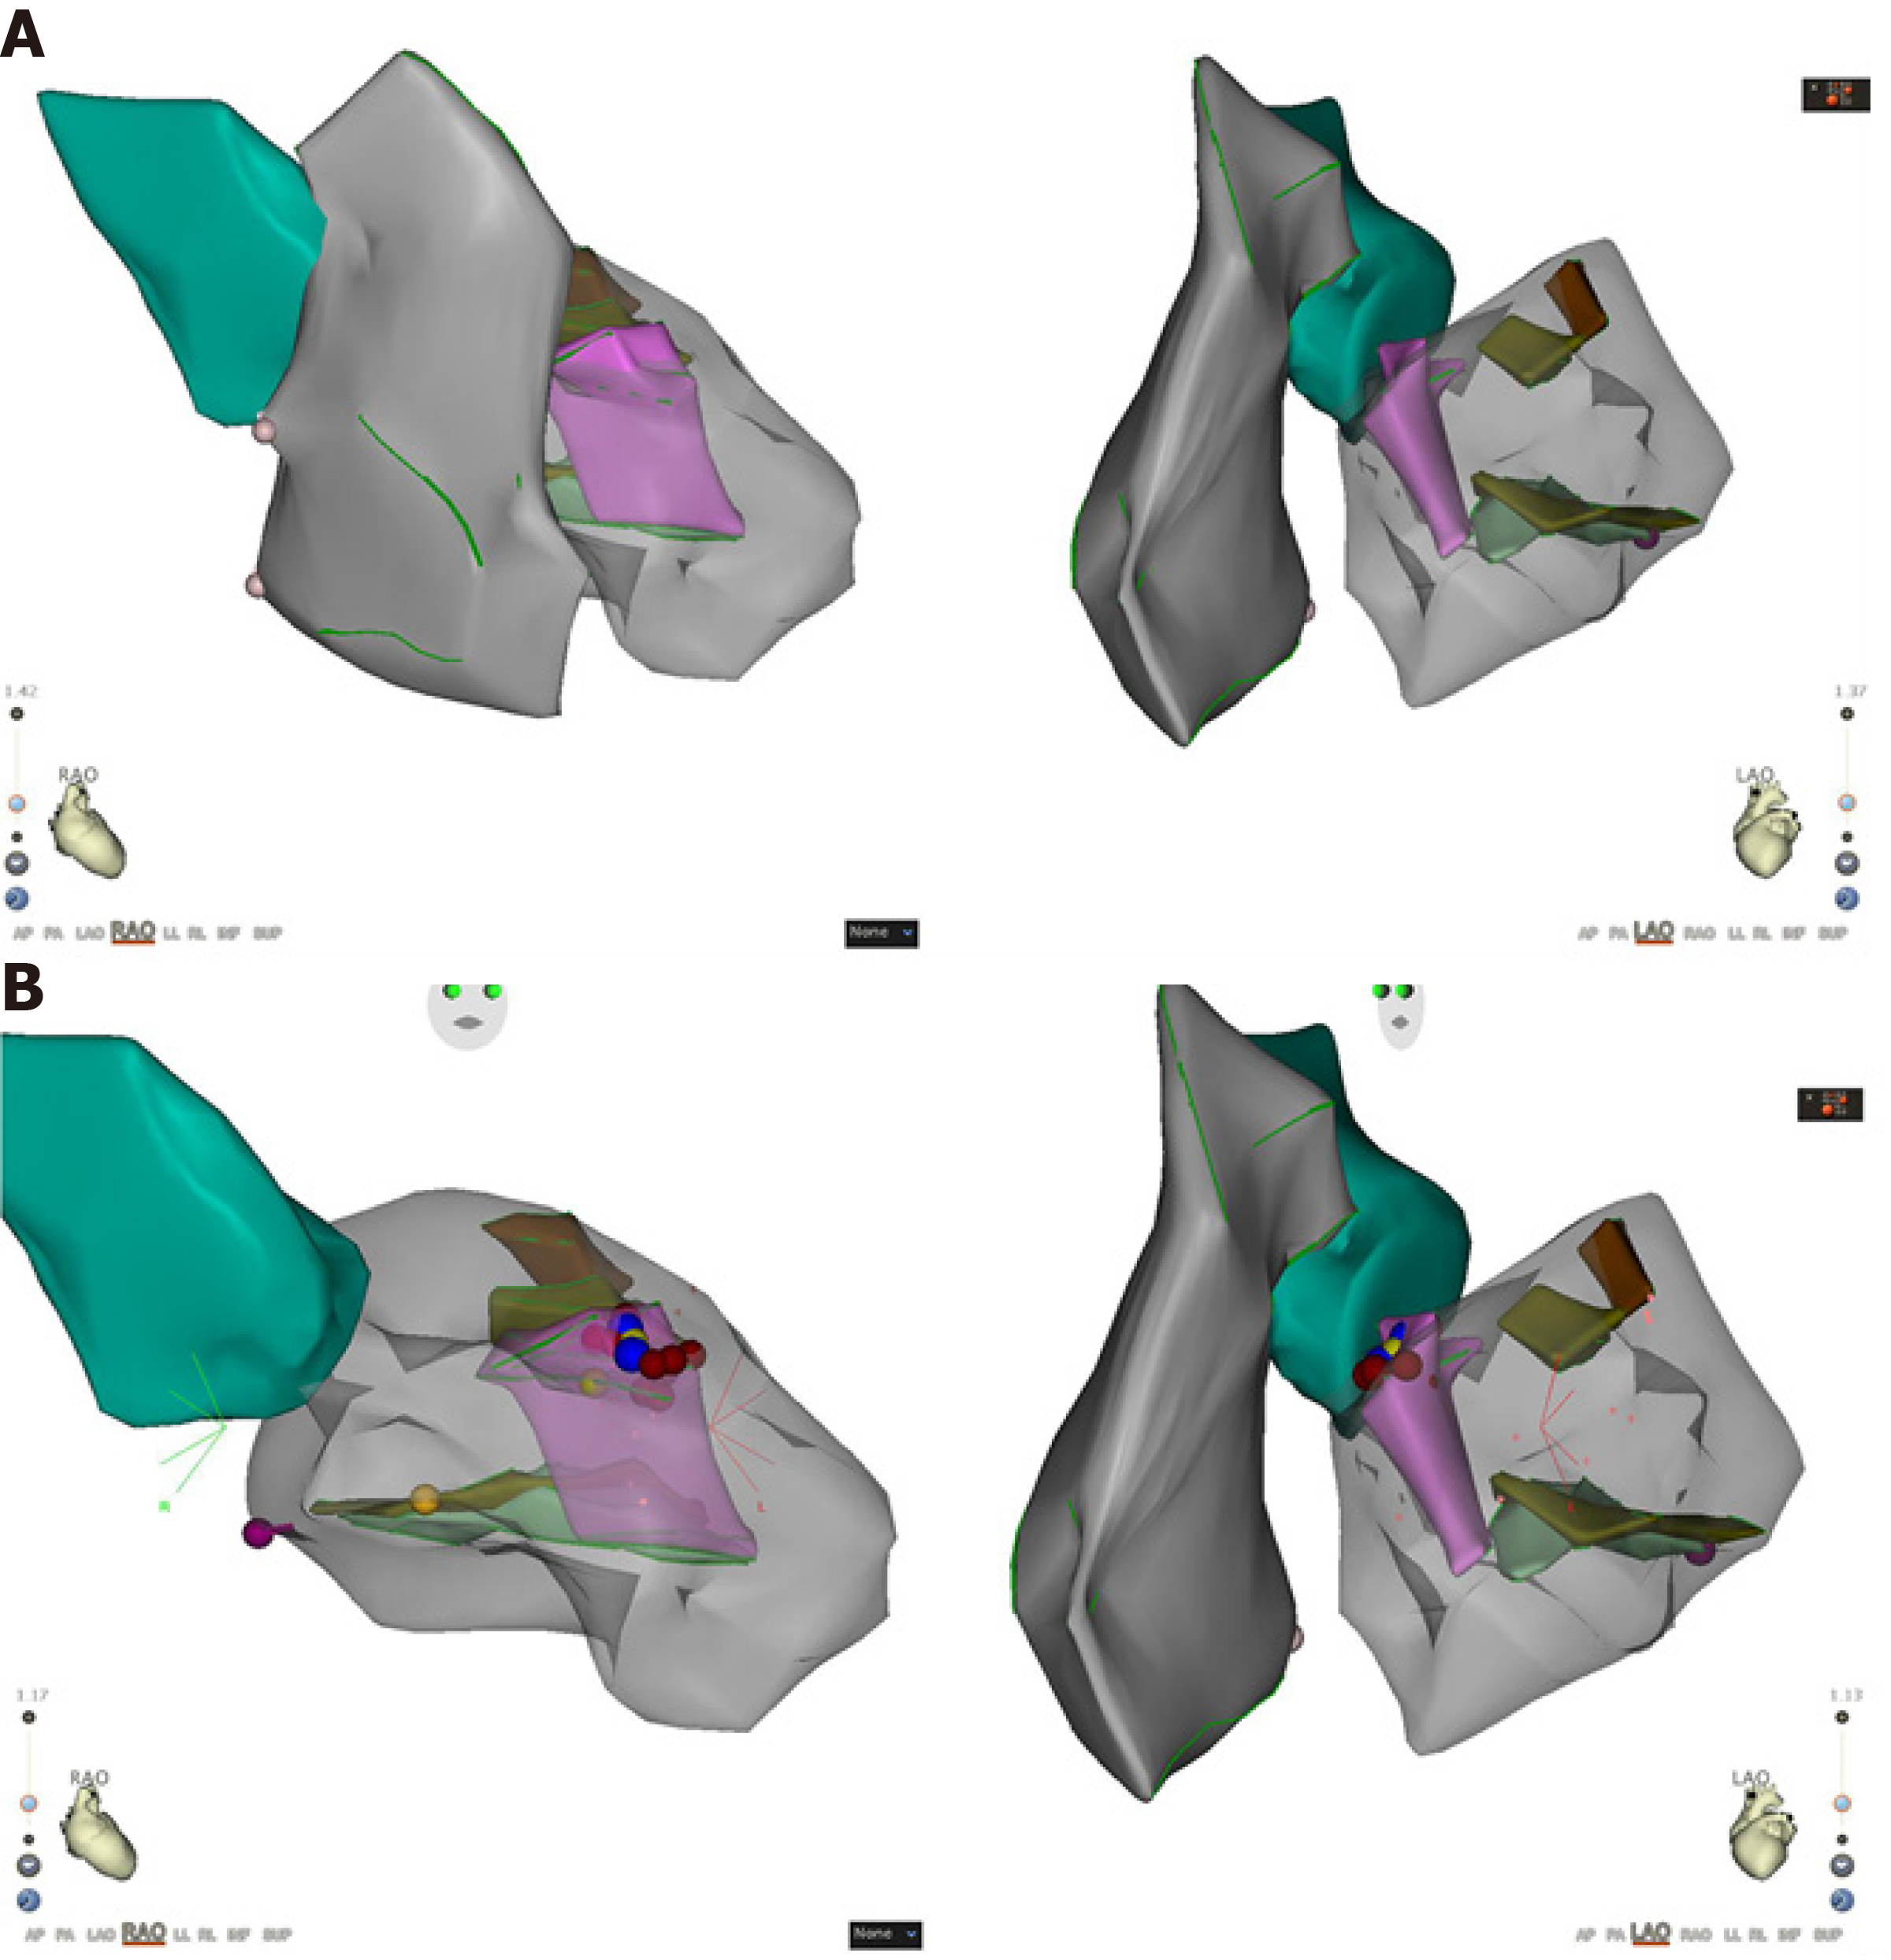
Figure 3 Three-dimensional structure model.
A: Left ventricular model established with an intracardiac ultrasound catheter and target map marked by the ST catheter in the left ventricle. In the model, pink represents a false tendon, brown represents the anterior papillary muscle, and green represents the posterior papillary muscle; B: The three-dimensional model during ablation and intracardiac ultrasound indicates that the target point is located at the attachment of the false tendon near the basal side of the interventricular septum.
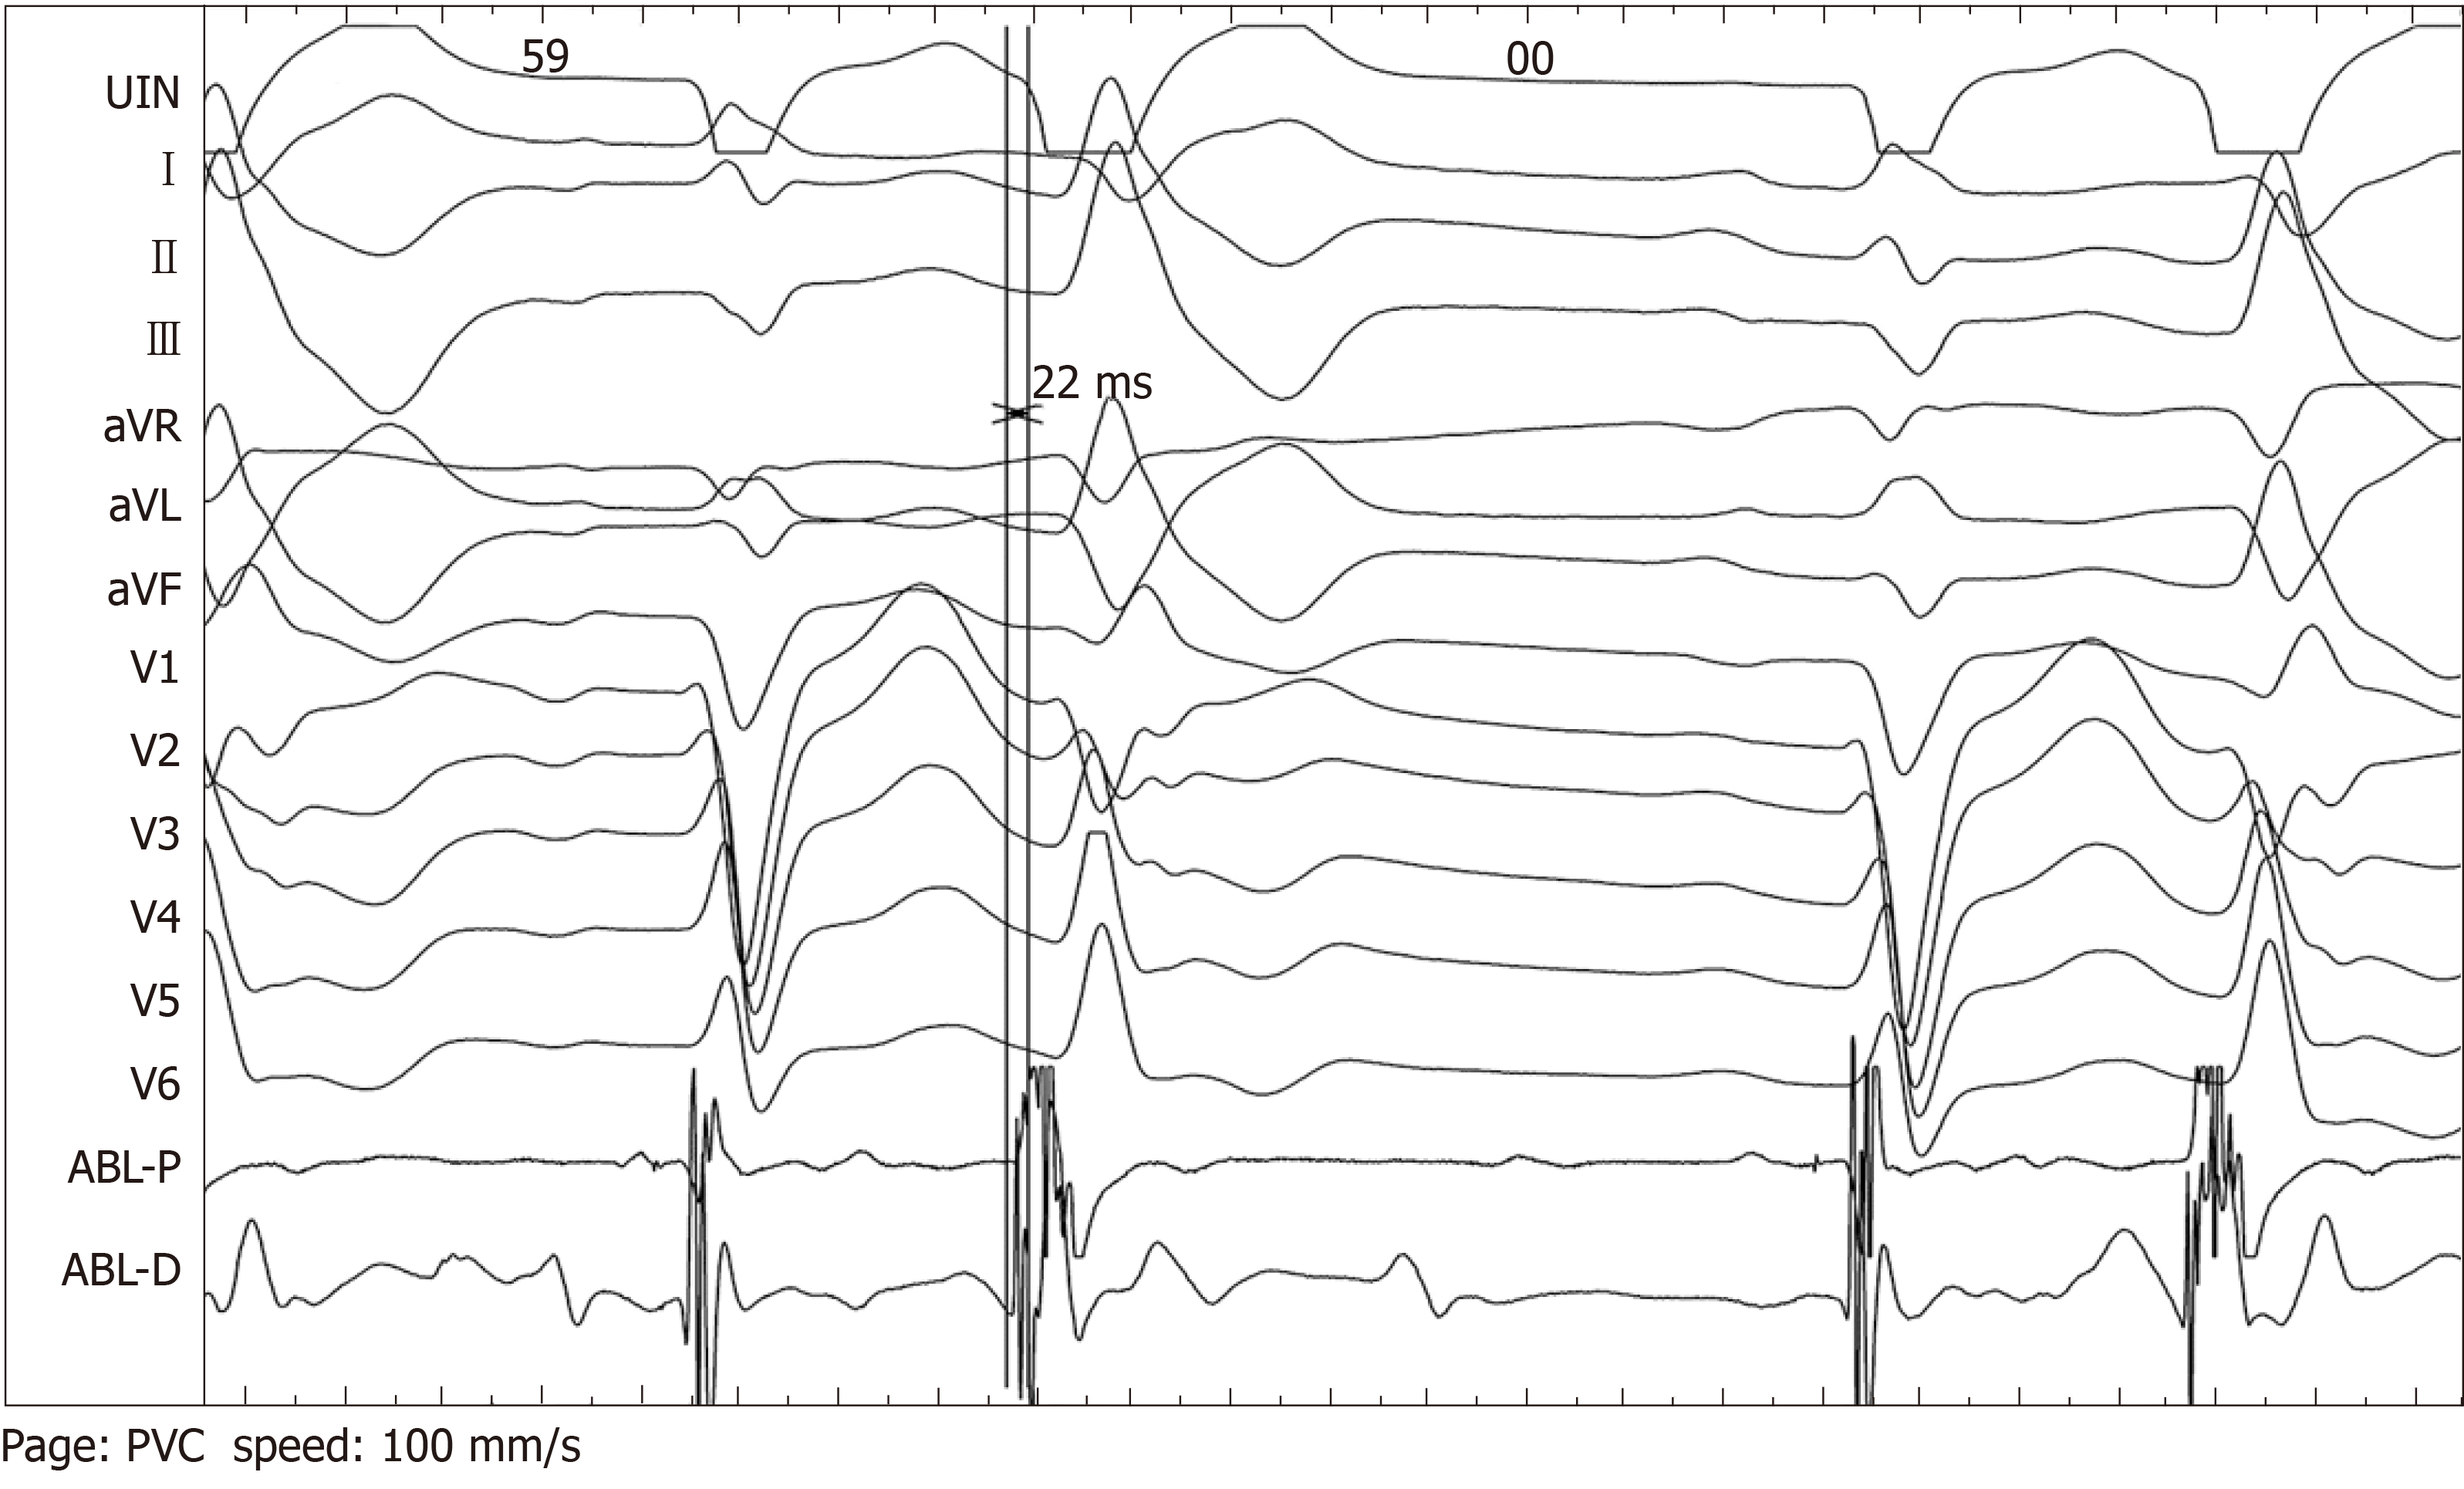
Figure 4 The earliest activation site of the premature ventricular complexes were mapped 22 ms prior to the onset of surface electrocardiography and unipolar endoelectrography at the interventricular septum attachment of false tendons and were successfully ablated.
- Citation: Yang YB, Li XF, Guo TT, Jia YH, Liu J, Tang M, Fang PH, Zhang S. Catheter ablation of premature ventricular complexes associated with false tendons: A case report. World J Clin Cases 2020; 8(2): 325-330
- URL: https://www.wjgnet.com/2307-8960/full/v8/i2/325.htm
- DOI: https://dx.doi.org/10.12998/wjcc.v8.i2.325


