Copyright
©The Author(s) 2020.
World J Clin Cases. Oct 6, 2020; 8(19): 4615-4623
Published online Oct 6, 2020. doi: 10.12998/wjcc.v8.i19.4615
Published online Oct 6, 2020. doi: 10.12998/wjcc.v8.i19.4615
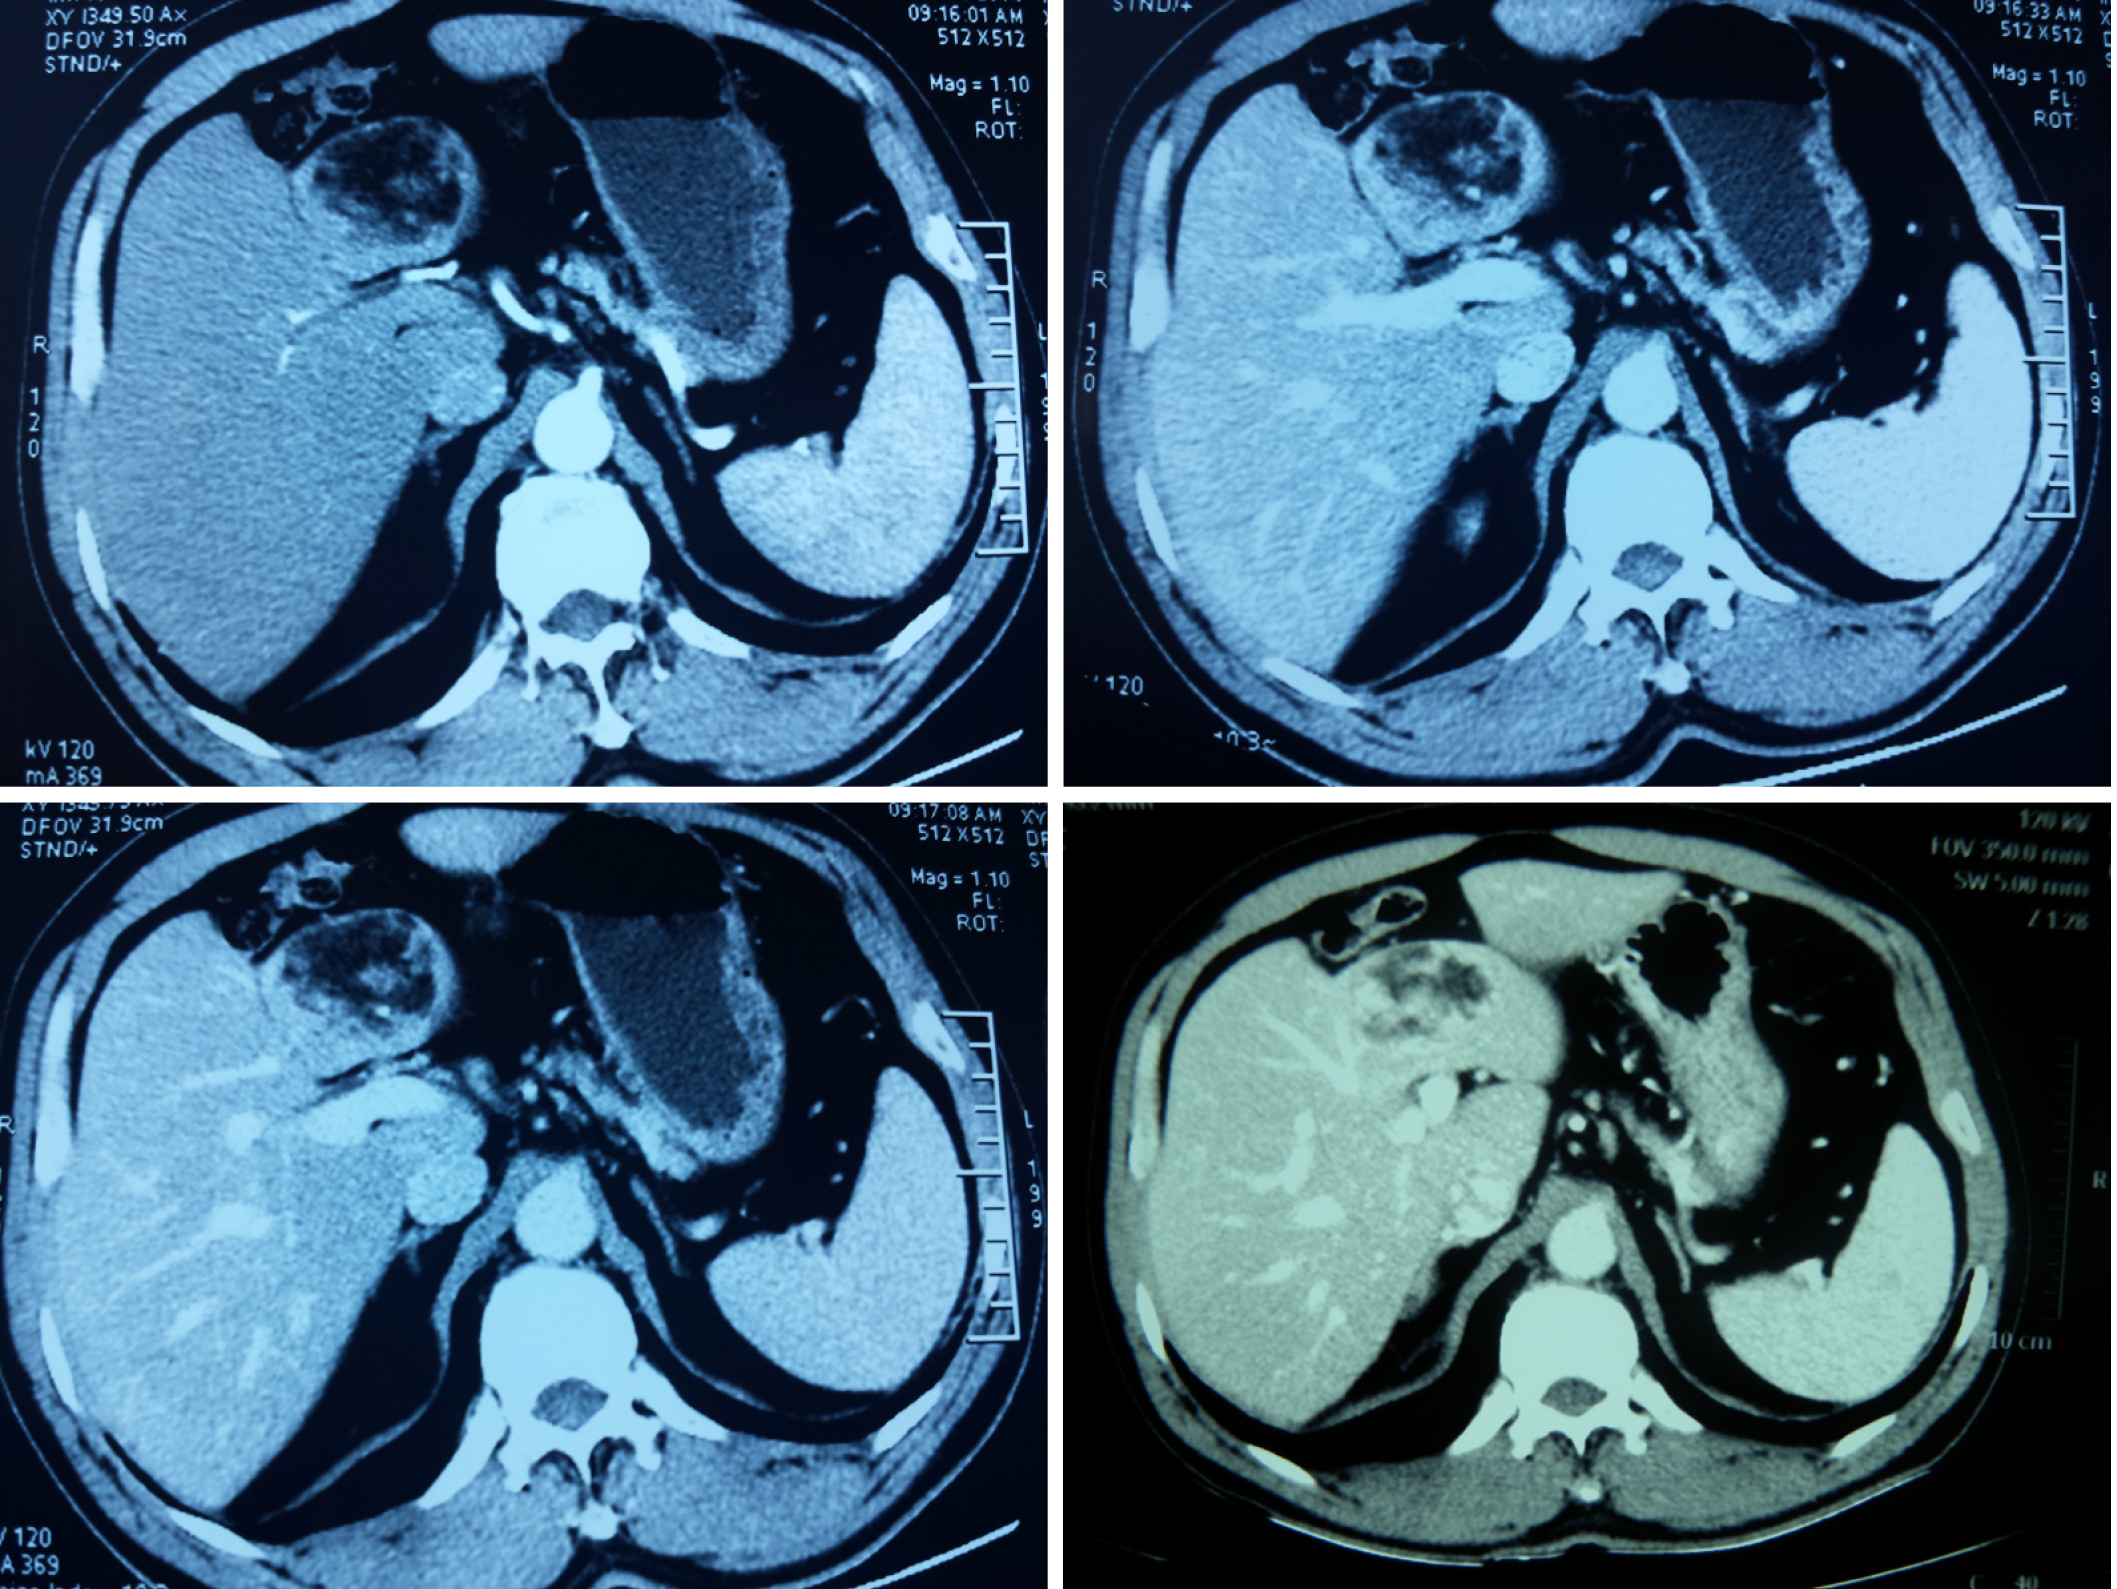
Figure 1 Computed tomography images of hepatic myelolipoma.
A quasi-circular mass with mixed density was presented via a computed tomography scan. The mass was about 5.0 cm × 6.0 cm × 5.0 cm in size, located on the left lobe of the liver. In the image from a contrast-enhanced computed tomography scan, an oval mass of mixed density was detected, with the edge and some parts intensified.
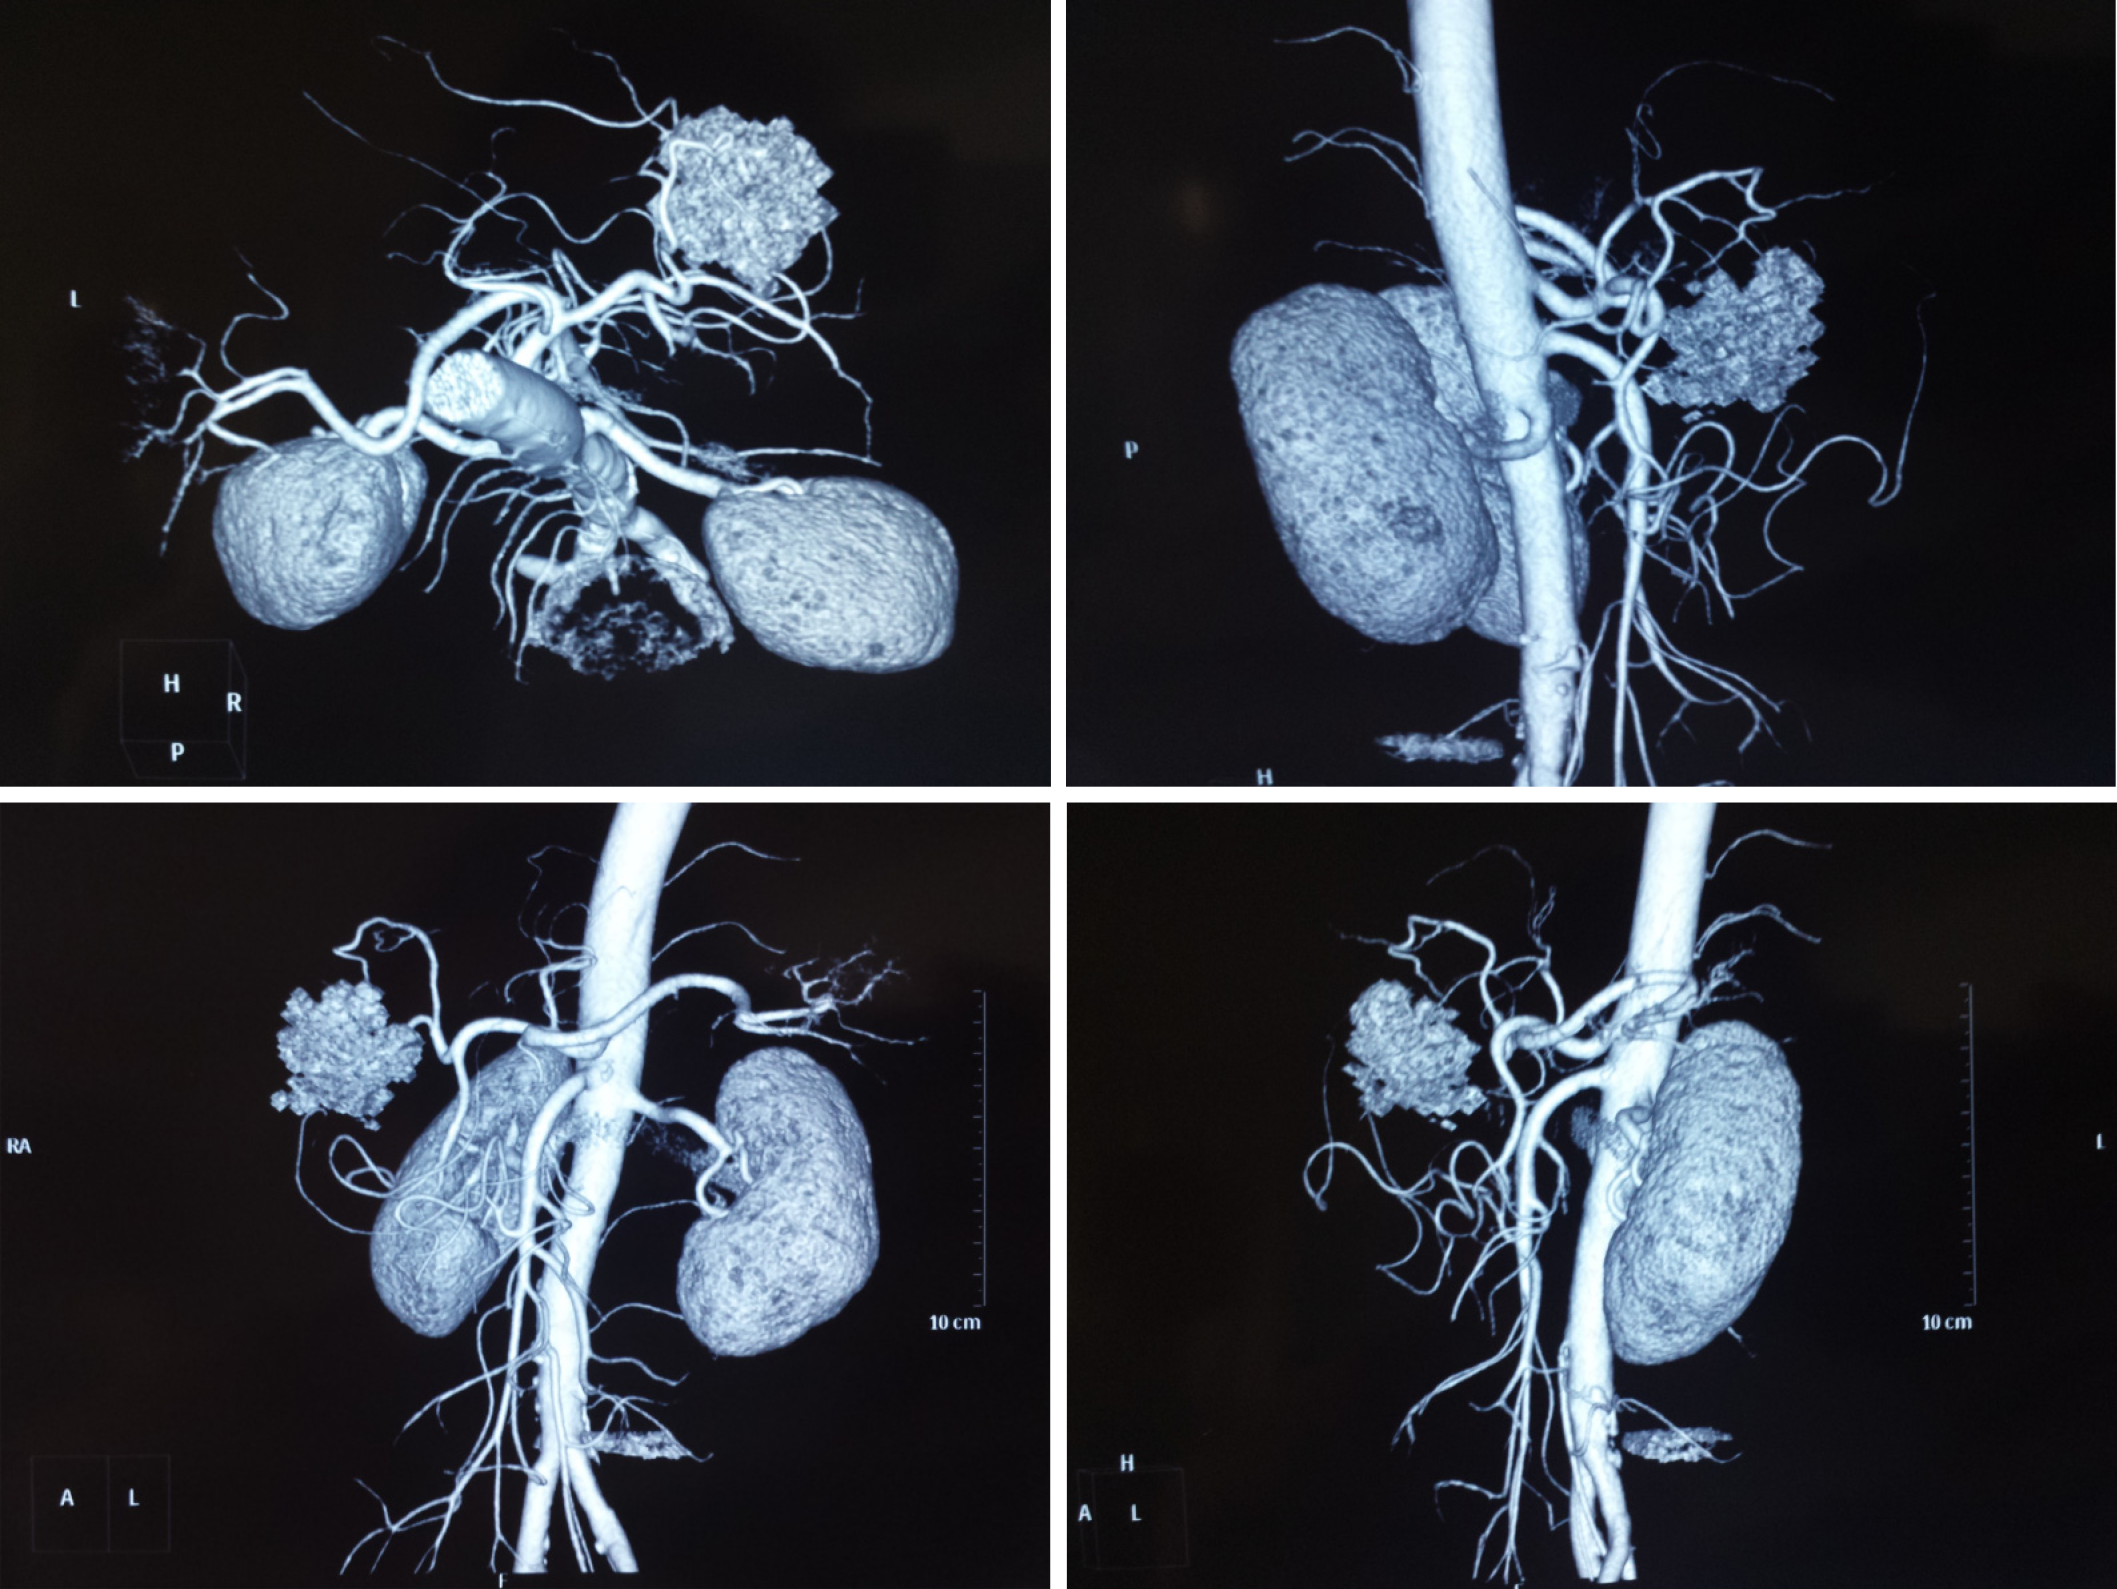
Figure 2 Imaging of hepatic myelolipoma by computed tomography angiography.
Angiography imaging presented a mass in the liver with a rich blood supply that did not correlate to the main branches of the hepatic arteries.
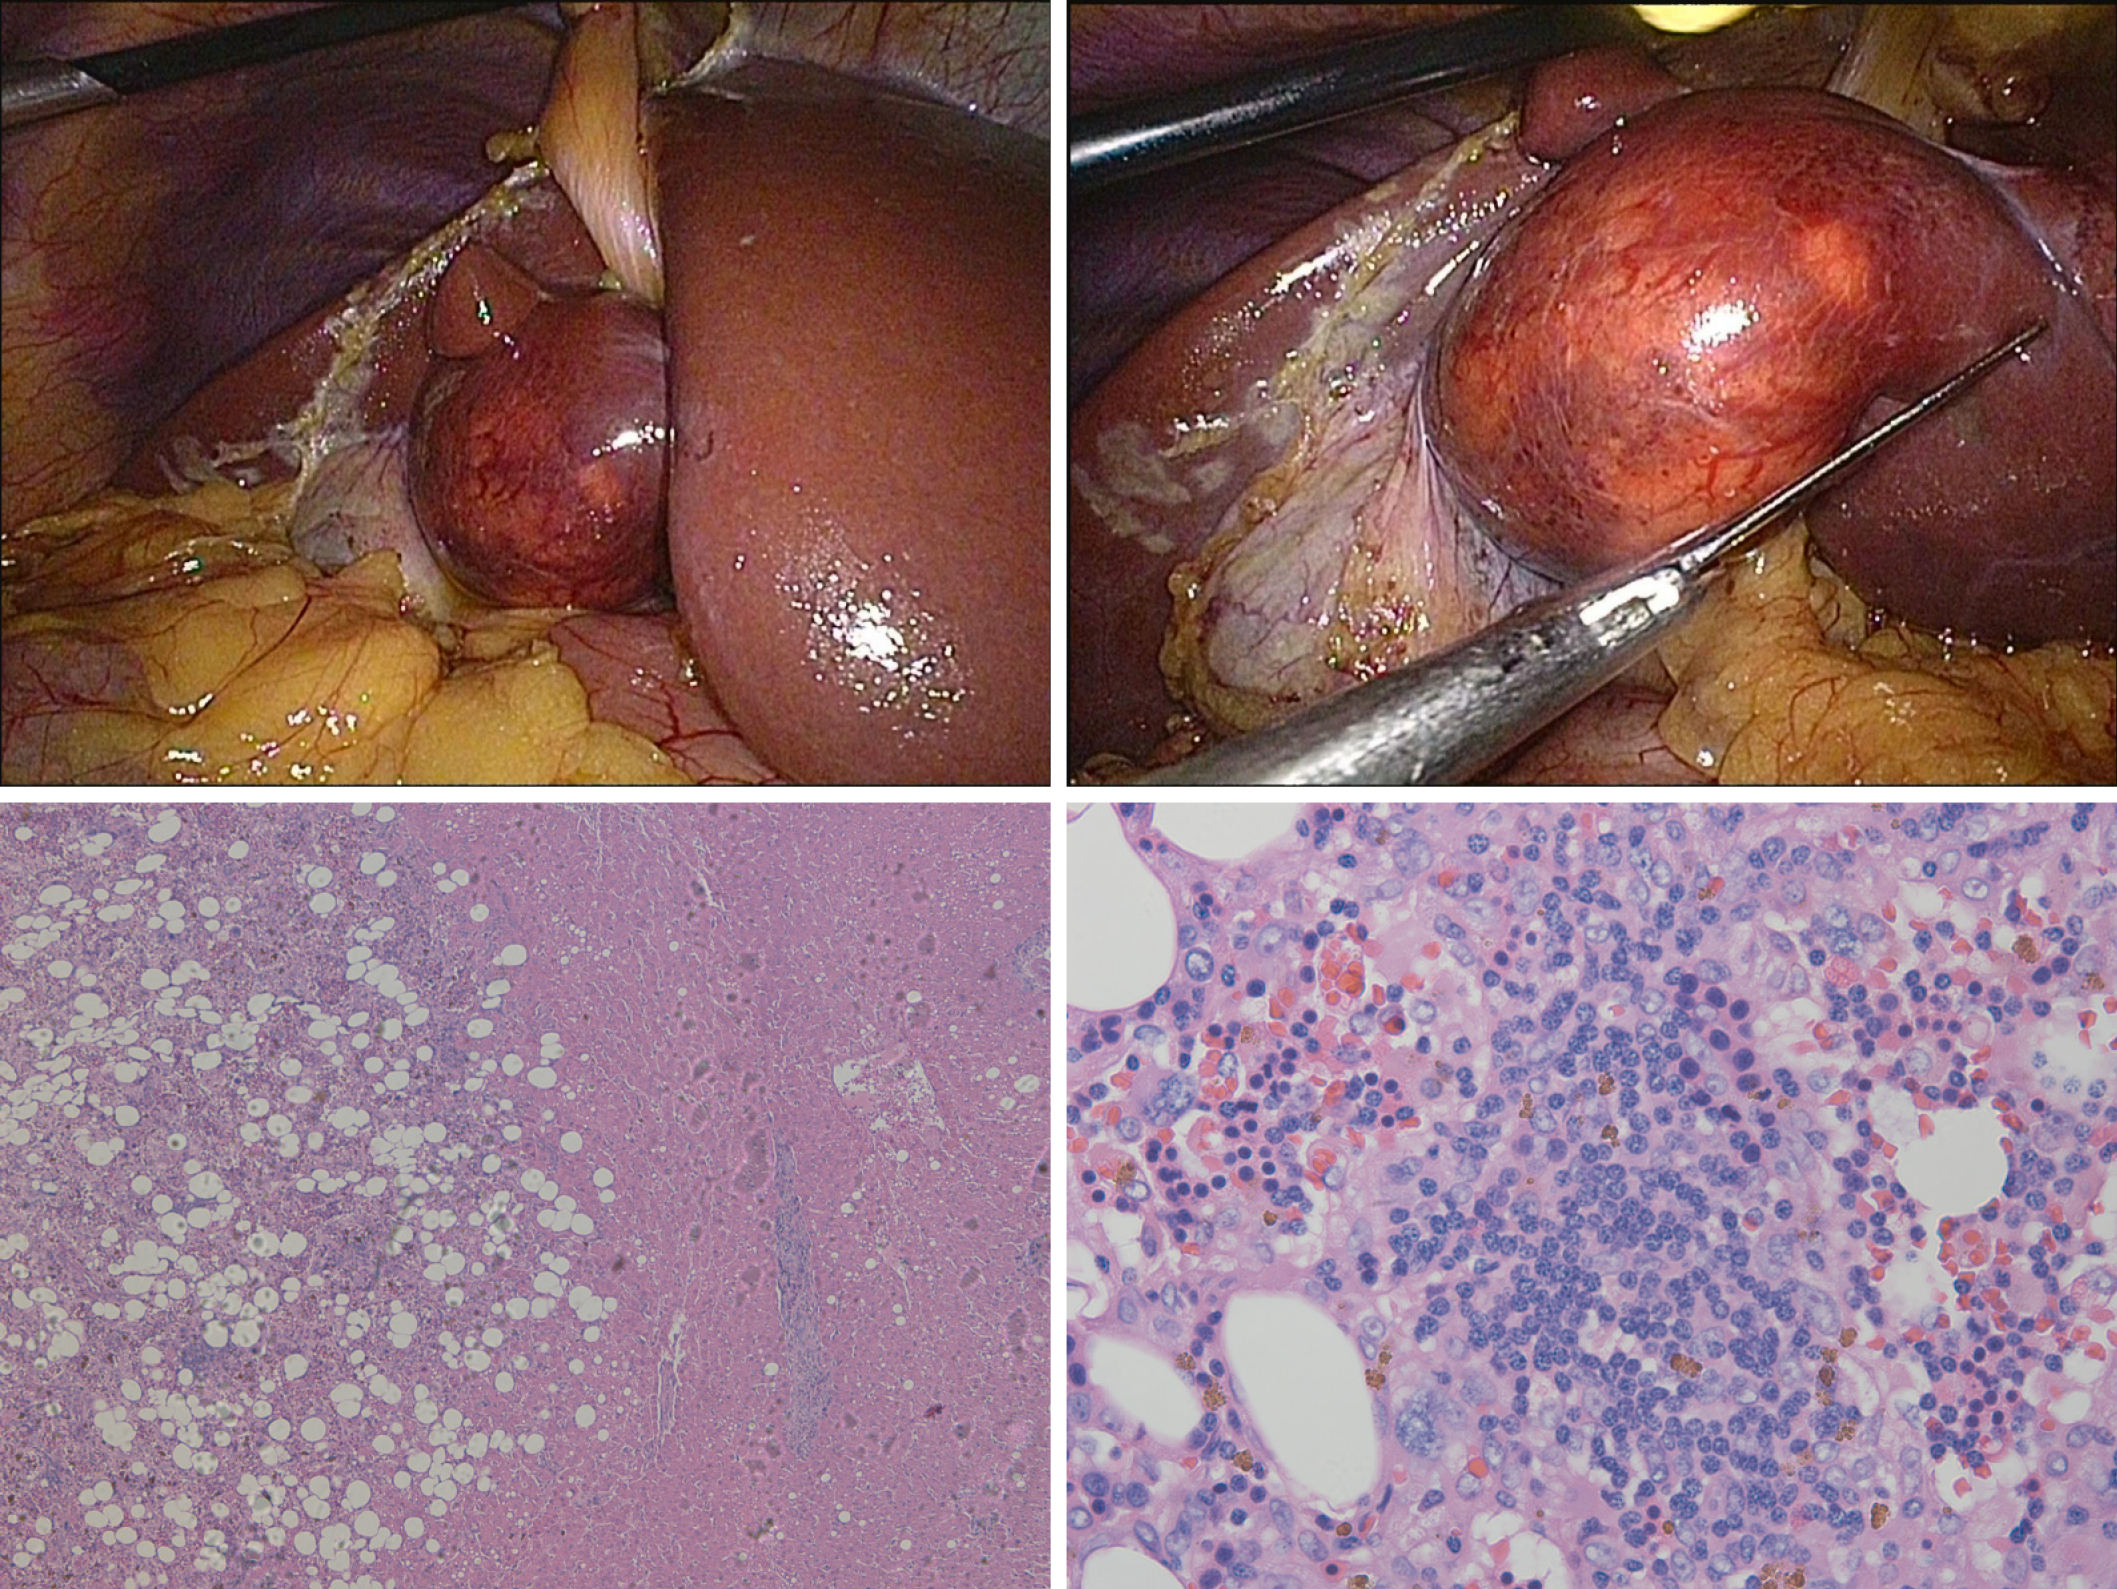
Figure 3 Visual and pathological view of hepatic myelolipoma.
The quasi-circular mass on the right hepatic lobe consisted of some yellow adipose tissue with clear blood vessels through the laparoscopic view. Under a microscope, a variable proportion of myeloid tissues scattered throughout irregularly mature fibrotic adipose tissues (hematoxylin-eosin staining, 20 × 10), in which myeloid, erythroid, and megakaryocytic cells can be found in magnified view (hematoxylin-eosin staining, 50 × 10).
- Citation: Li KY, Wei AL, Li A. Primary hepatic myelolipoma: A case report and review of the literature. World J Clin Cases 2020; 8(19): 4615-4623
- URL: https://www.wjgnet.com/2307-8960/full/v8/i19/4615.htm
- DOI: https://dx.doi.org/10.12998/wjcc.v8.i19.4615


