Copyright
©The Author(s) 2020.
World J Clin Cases. Oct 6, 2020; 8(19): 4527-4534
Published online Oct 6, 2020. doi: 10.12998/wjcc.v8.i19.4527
Published online Oct 6, 2020. doi: 10.12998/wjcc.v8.i19.4527
Figure 1 Imaging before and after treatment.
A: Computed tomography scans of the sacroiliac joints revealed bone hyperplasia, and osteosclerosis; B and C: Computed tomography scans of the sternoclavicular joints revealed hyperostosis and lesions; D-G: Magnetic resonance imaging scans of the cervical and thoracic spine showed a herniated disc at C4/5 and C5/6, abnormal signal intensity at C5, T2 and T3, and end-plate inflammation at C6/7; H-J: Magnetic resonance imaging scans of the thoracic and lumbar spine: multiple vertebral bone marrow edema and mild pathological fractures (T10 and L1 vertebral bodies), end-plate inflammation (T10/11, T12/L1 and L5/S1) and paravertebral ossification; K and L: End-plate inflammation in L5/S1 and paravertebral ossification, no other obvious abnormality.
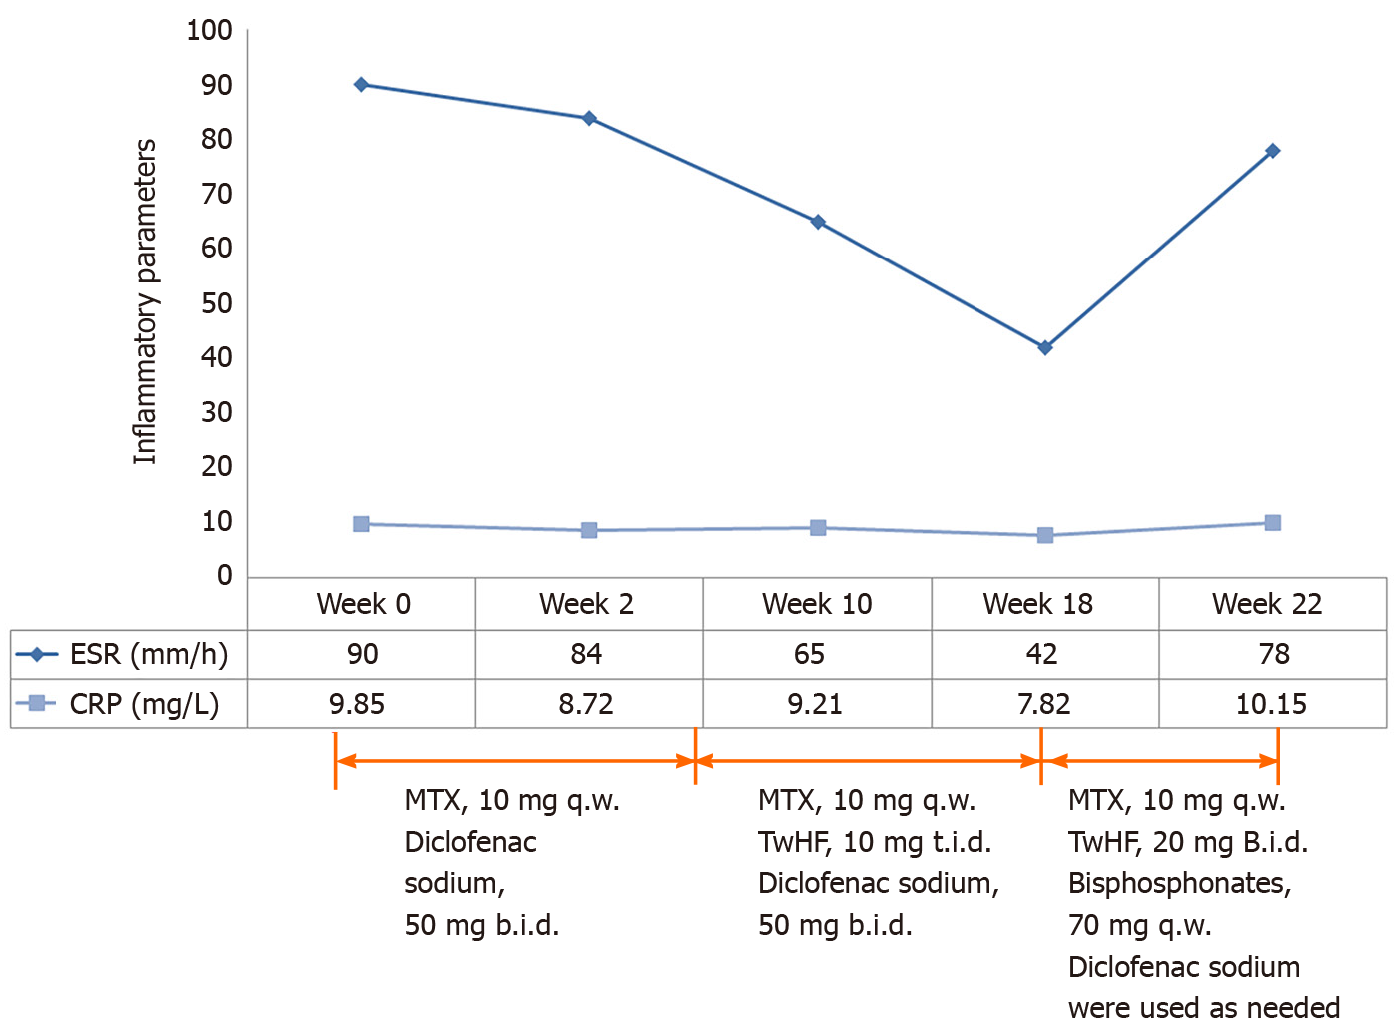
Figure 2 Dosage, frequency, duration of different treatments and levels of serum inflammatory parameters before initiation of tofacitinib treatment.
ESR: Erythrocyte sedimentation rate; CRP: C-reactive protein; MTX: Methotrexate, TwHF: Tripterygium wilfordii hook f; t.i.d.: Three times per day; b.i.d.: Twice per day; q.w.: Once per week.
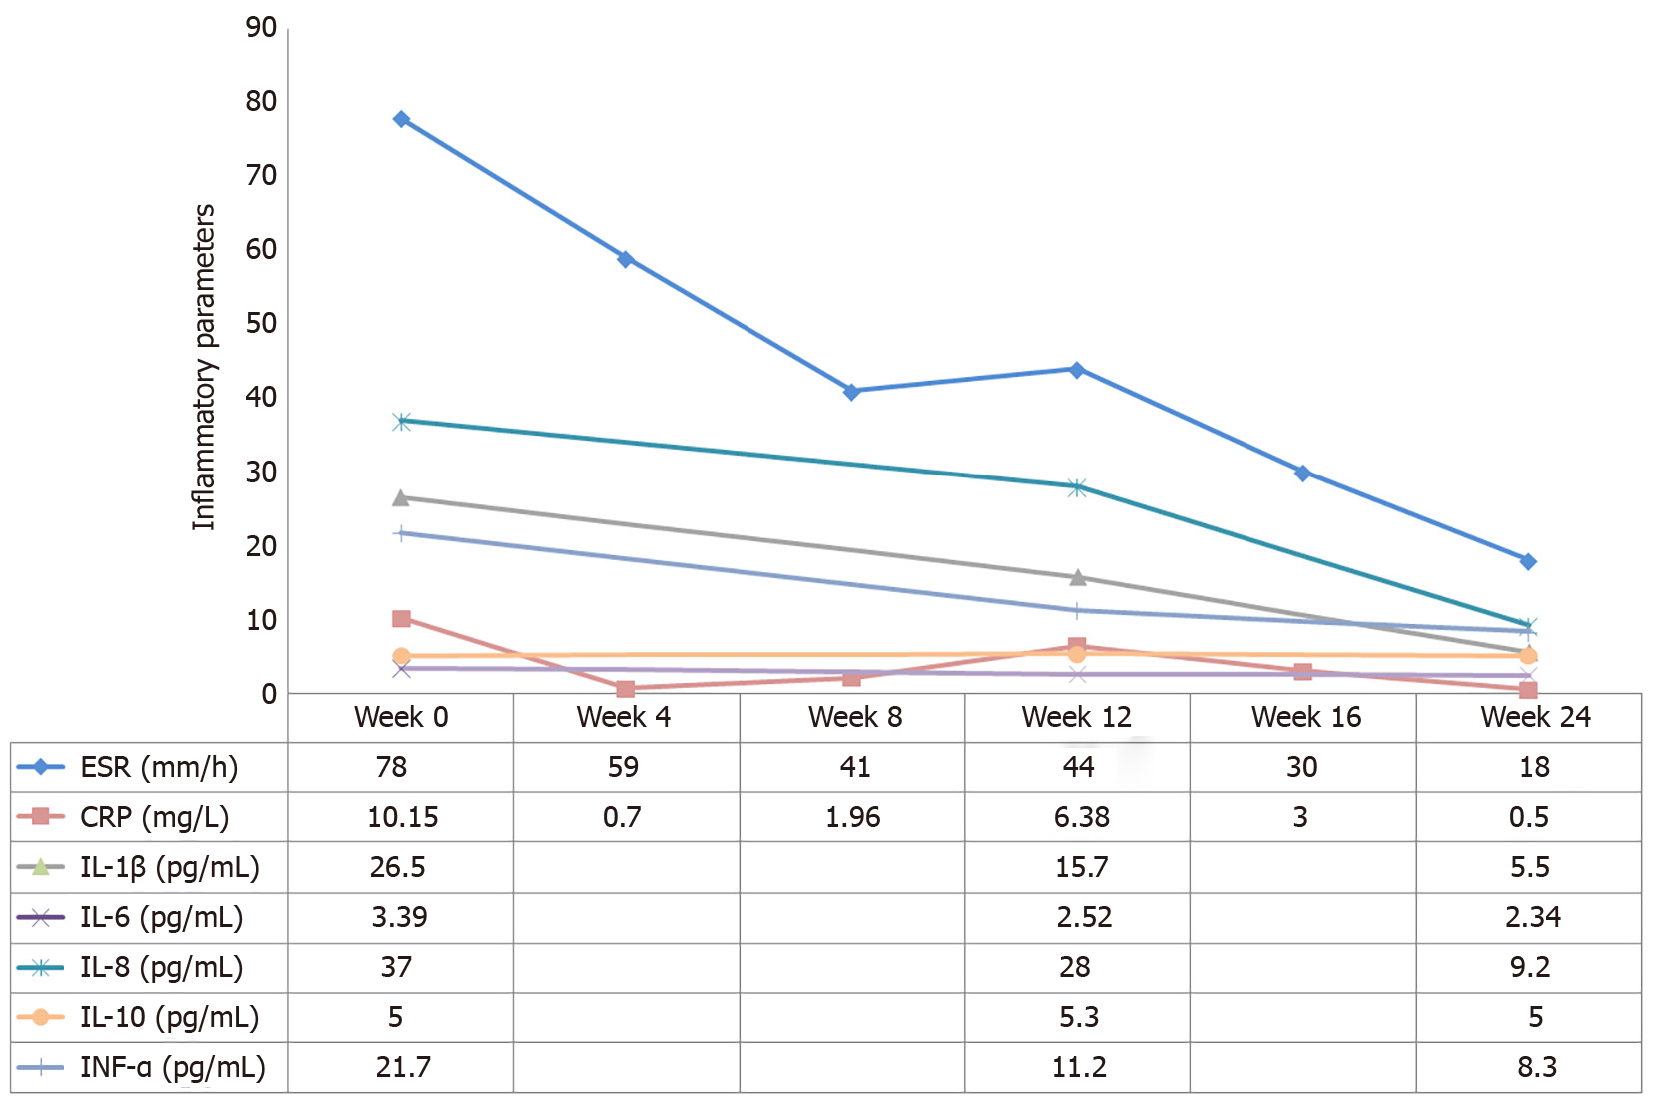
Figure 3 Levels of serum inflammatory parameters after initiation of tofacitinib treatment.
IL: Interleukin; TNF: Tumor necrosis factor.
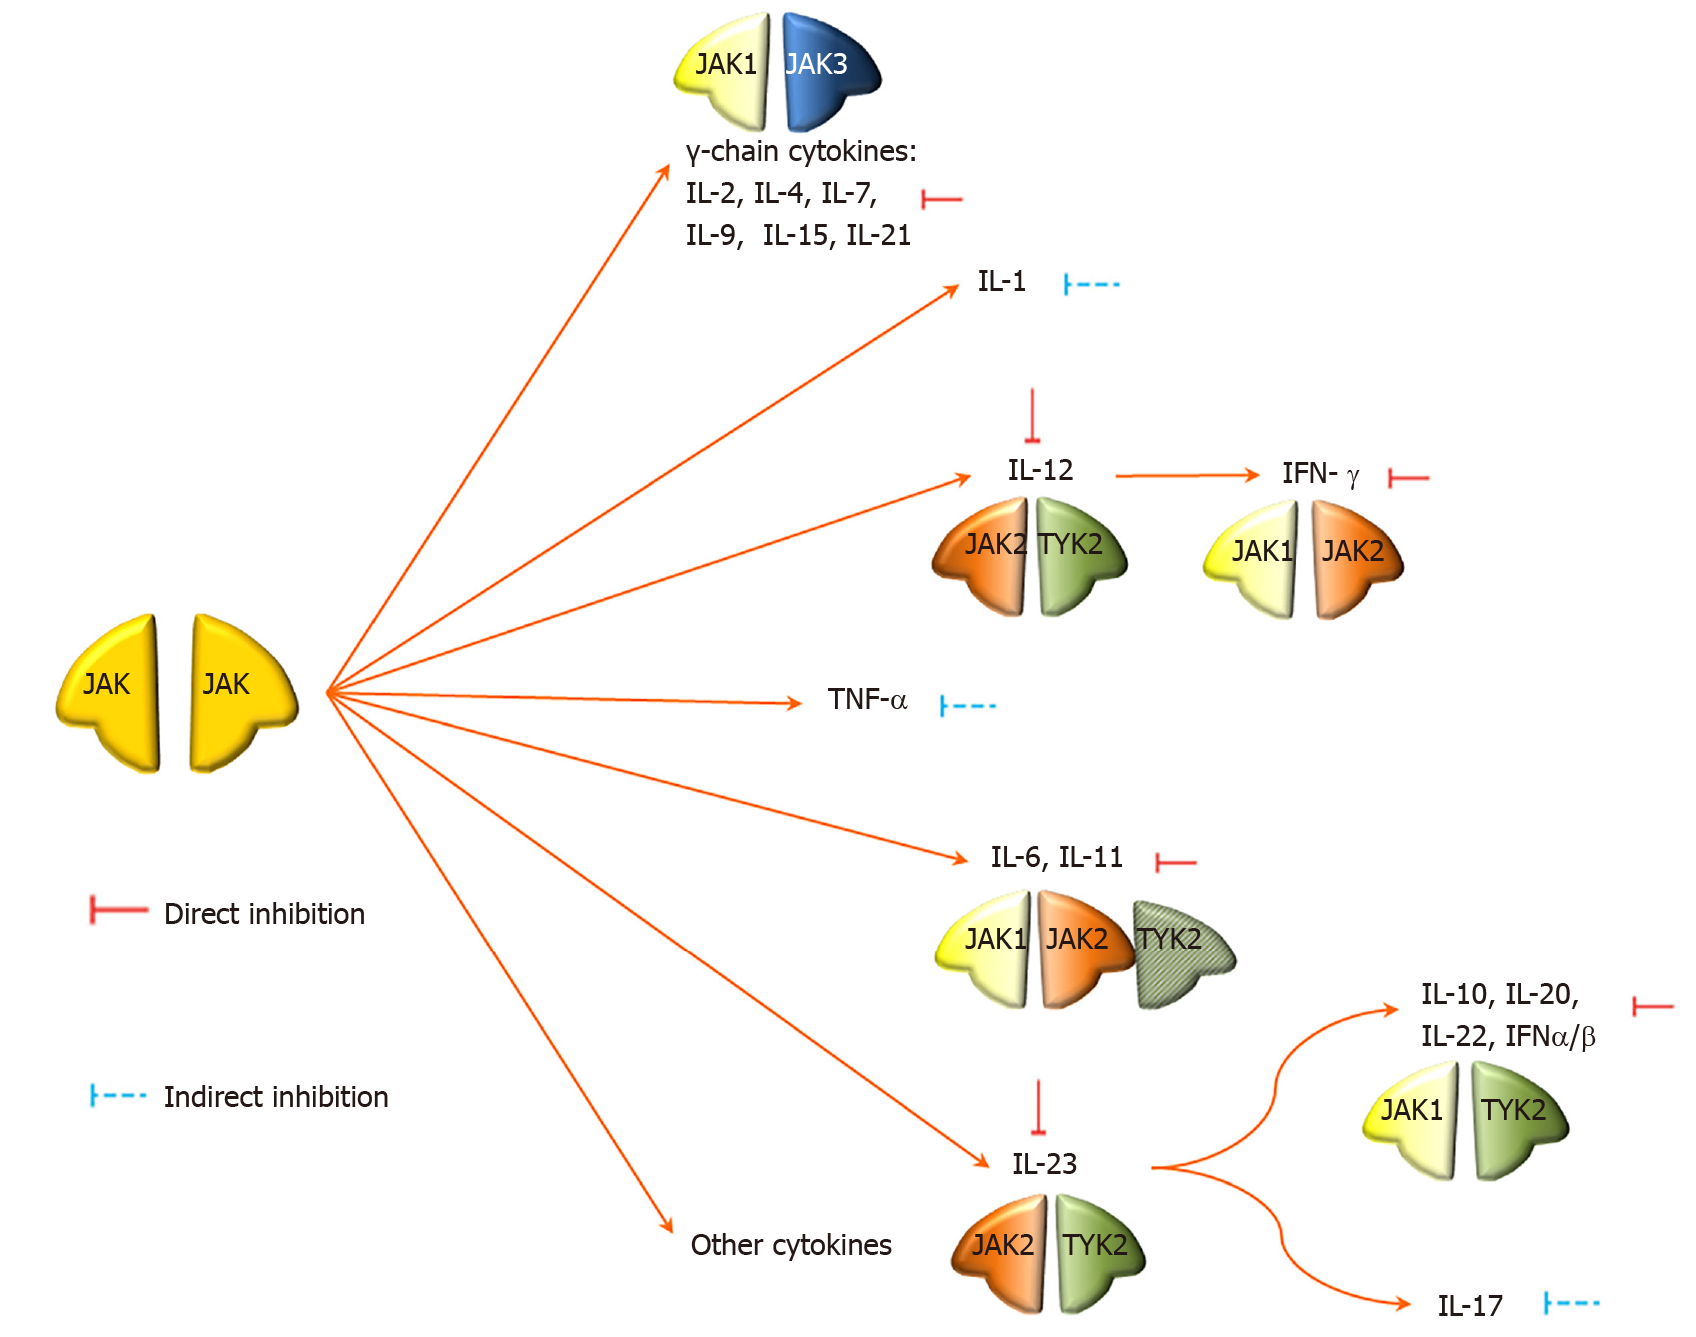
Figure 4 The mechanism of action of Janus kinases.
JAK: Janus kinase; IL: Interleukin.
- Citation: Li B, Li GW, Xue L, Chen YY. Rapid remission of refractory synovitis, acne, pustulosis, hyperostosis, and osteitis syndrome in response to the Janus kinase inhibitor tofacitinib: A case report. World J Clin Cases 2020; 8(19): 4527-4534
- URL: https://www.wjgnet.com/2307-8960/full/v8/i19/4527.htm
- DOI: https://dx.doi.org/10.12998/wjcc.v8.i19.4527


