Copyright
©The Author(s) 2020.
World J Clin Cases. Oct 6, 2020; 8(19): 4360-4369
Published online Oct 6, 2020. doi: 10.12998/wjcc.v8.i19.4360
Published online Oct 6, 2020. doi: 10.12998/wjcc.v8.i19.4360
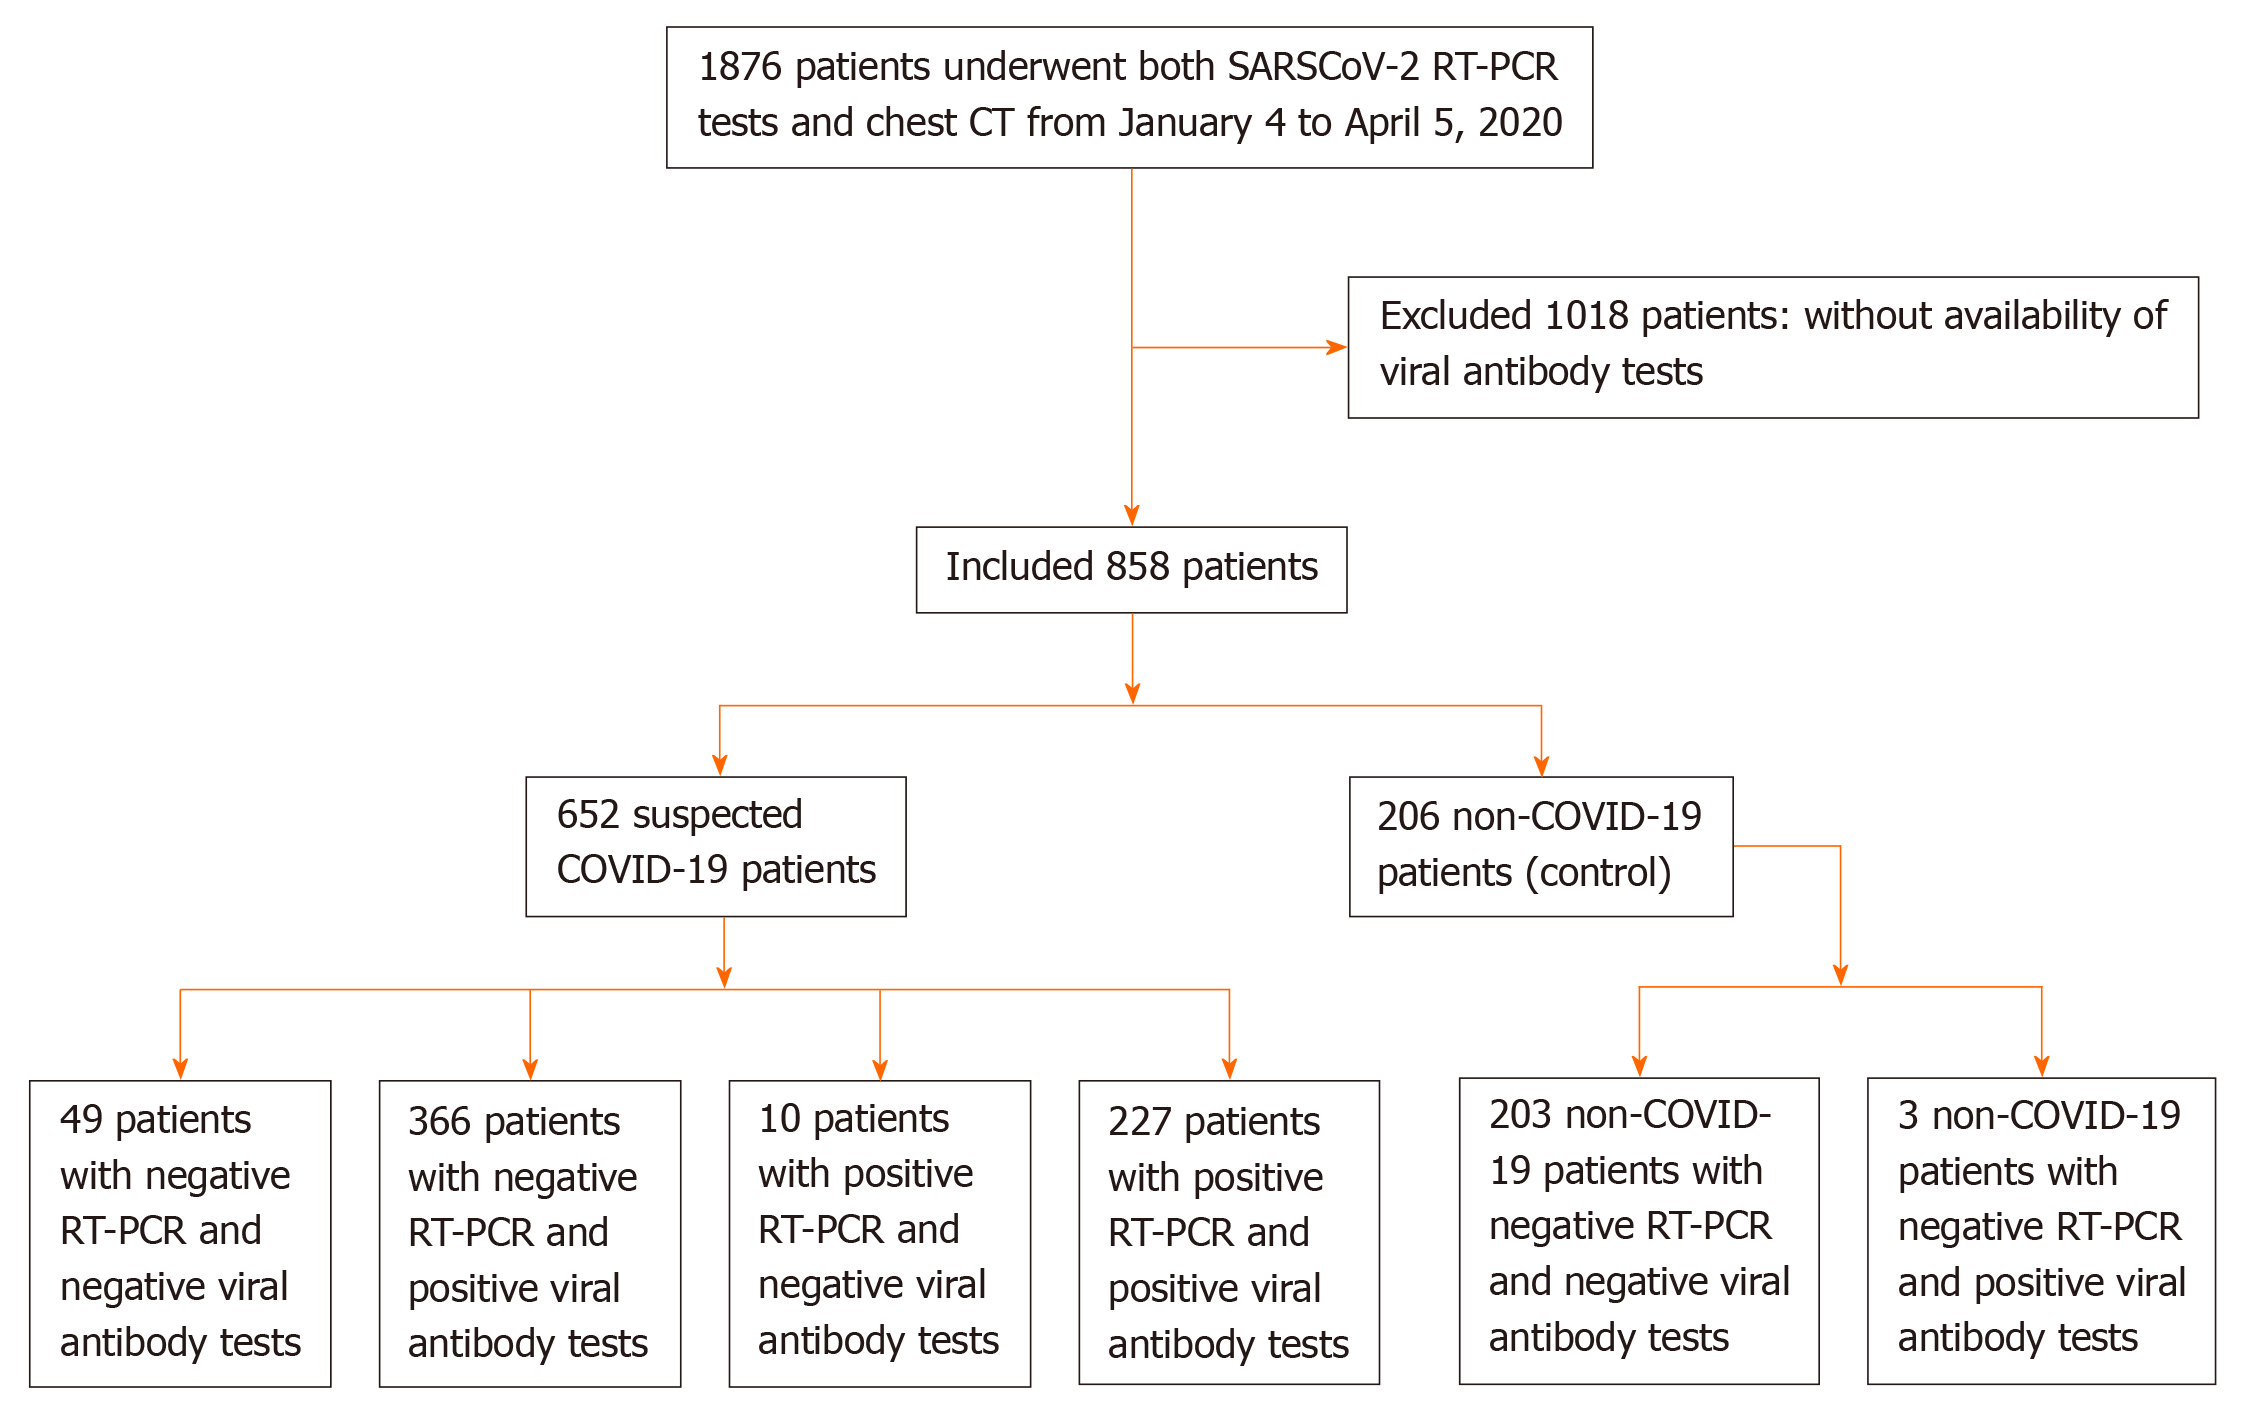
Figure 1 Flowchart of this study.
SARS-CoV: Severe acute respiratory syndrome coronavirus; RT-PCR: Reverse transcription polymerase chain reaction; CT: computed tomography; COVID-19: Coronavirus disease 2019.
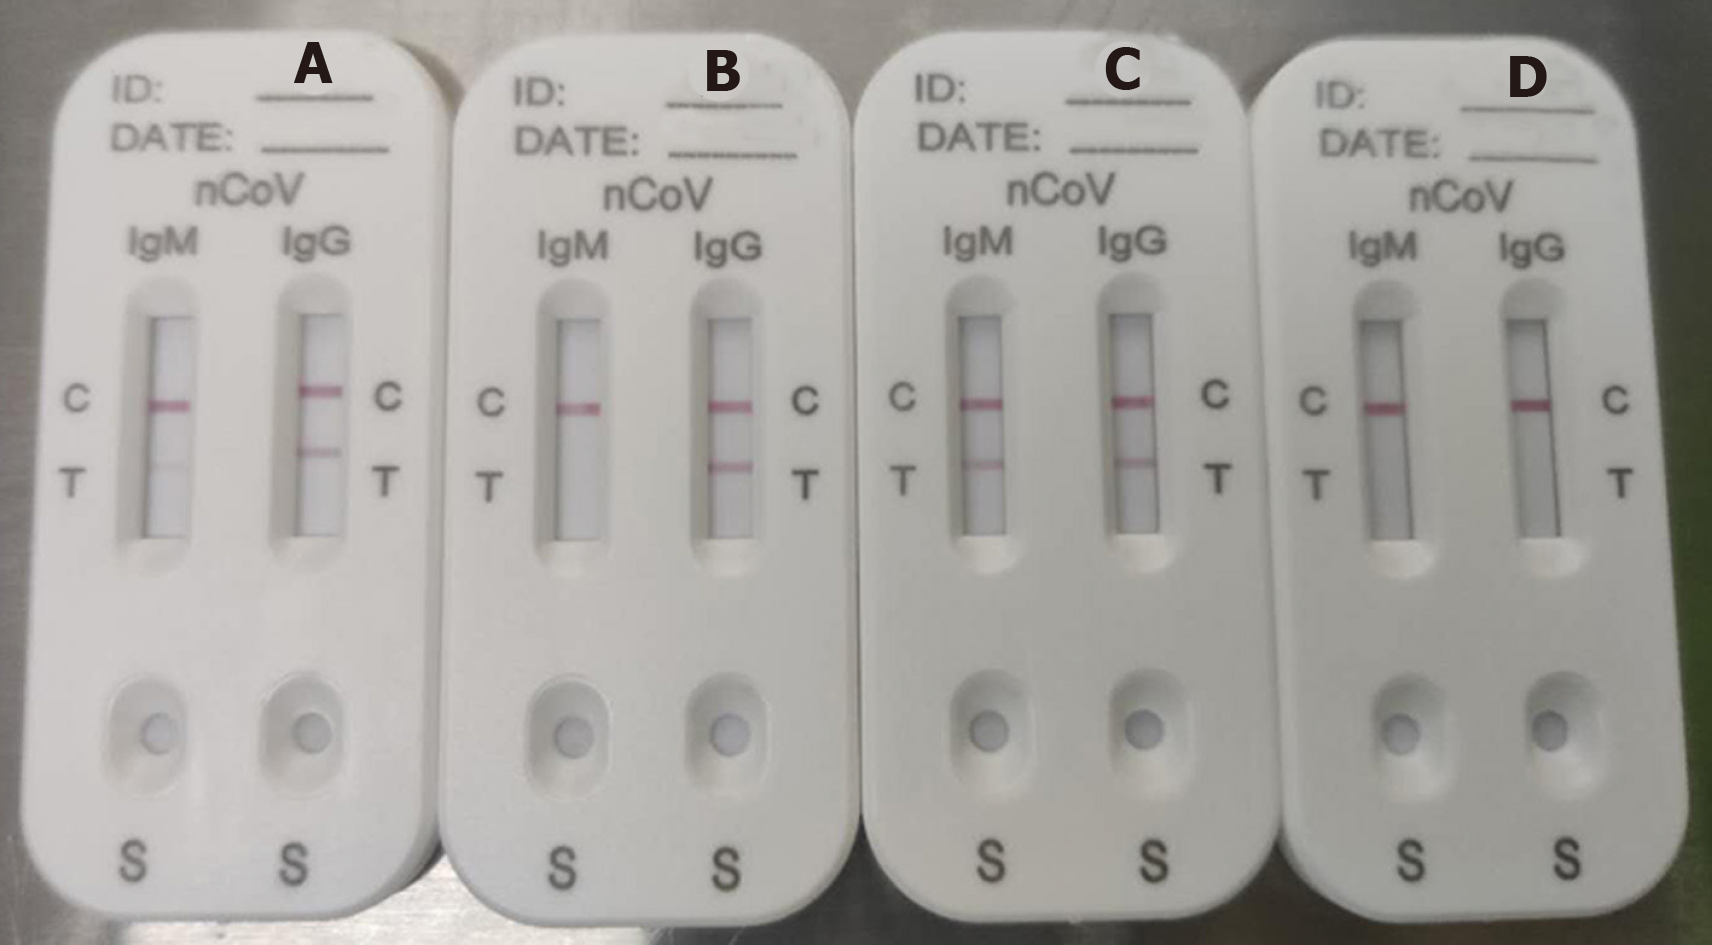
Figure 2 Representative picture of severe acute respiratory syndrome coronavirus-2 IgM and IgG antibody test results.
A: IgM in low concentration (Score 1) and IgG in high concentration (Score 2); B: Only IgG in high concentration (Score 2); C: Both IgM and IgG in high concentration (Score 2); D: No IgM or IgG (Score 0).
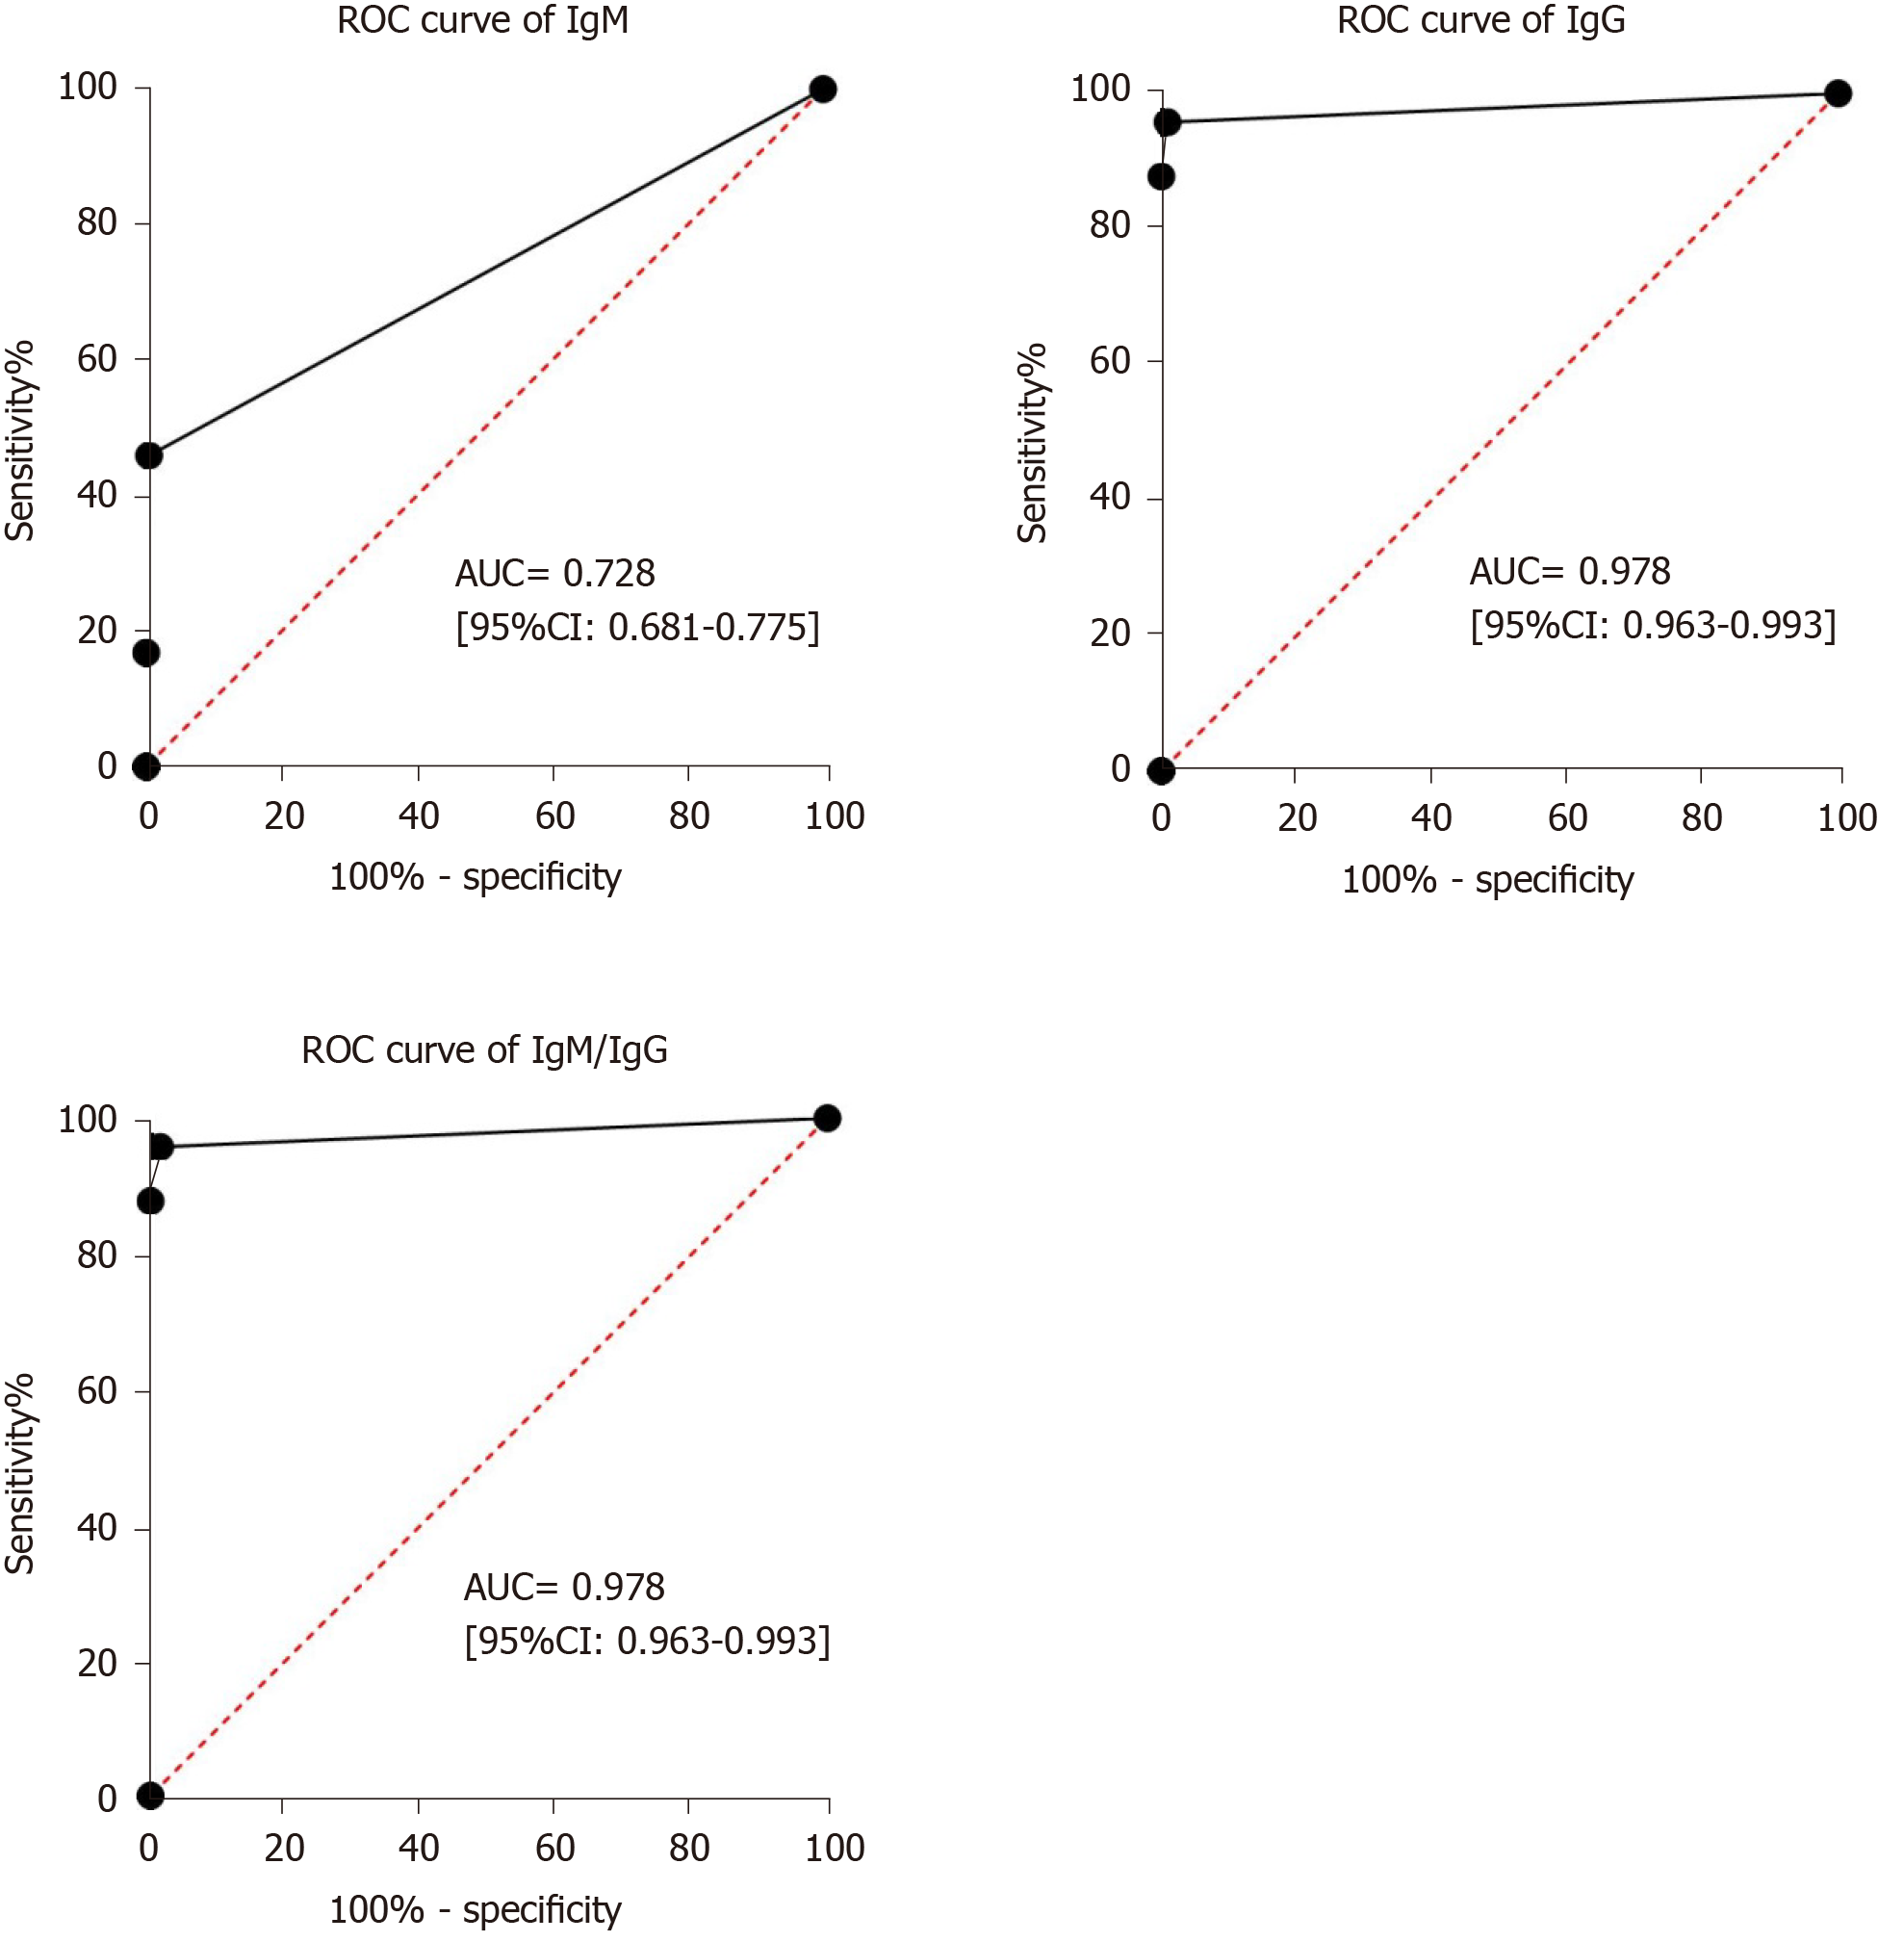
Figure 3 Results of the receiver operating characteristic curve analysis.
Receiver operating characteristic curve analysis showed that the area under the curve of IgM tests, IgG tests and IgM/IgG combined tests for the diagnosis of coronavirus disease 2019 were 0.728 (95%CI: 0.681–0.775), 0.978 (95%CI: 0.963–0.993) and 0.978 (95%CI: 0.963–0.993). ROC: Receiver operating characteristic curve; AUC: Area under the curve; IgM: Immunoglobulin M; IgG: Immunoglobulin G.
- Citation: Meng QB, Peng JJ, Wei X, Yang JY, Li PC, Qu ZW, Xiong YF, Wu GJ, Hu ZM, Yu JC, Su W. Clinical application of combined detection of SARS-CoV-2-specific antibody and nucleic acid. World J Clin Cases 2020; 8(19): 4360-4369
- URL: https://www.wjgnet.com/2307-8960/full/v8/i19/4360.htm
- DOI: https://dx.doi.org/10.12998/wjcc.v8.i19.4360


