Copyright
©The Author(s) 2020.
World J Clin Cases. Jul 26, 2020; 8(14): 2917-2929
Published online Jul 26, 2020. doi: 10.12998/wjcc.v8.i14.2917
Published online Jul 26, 2020. doi: 10.12998/wjcc.v8.i14.2917
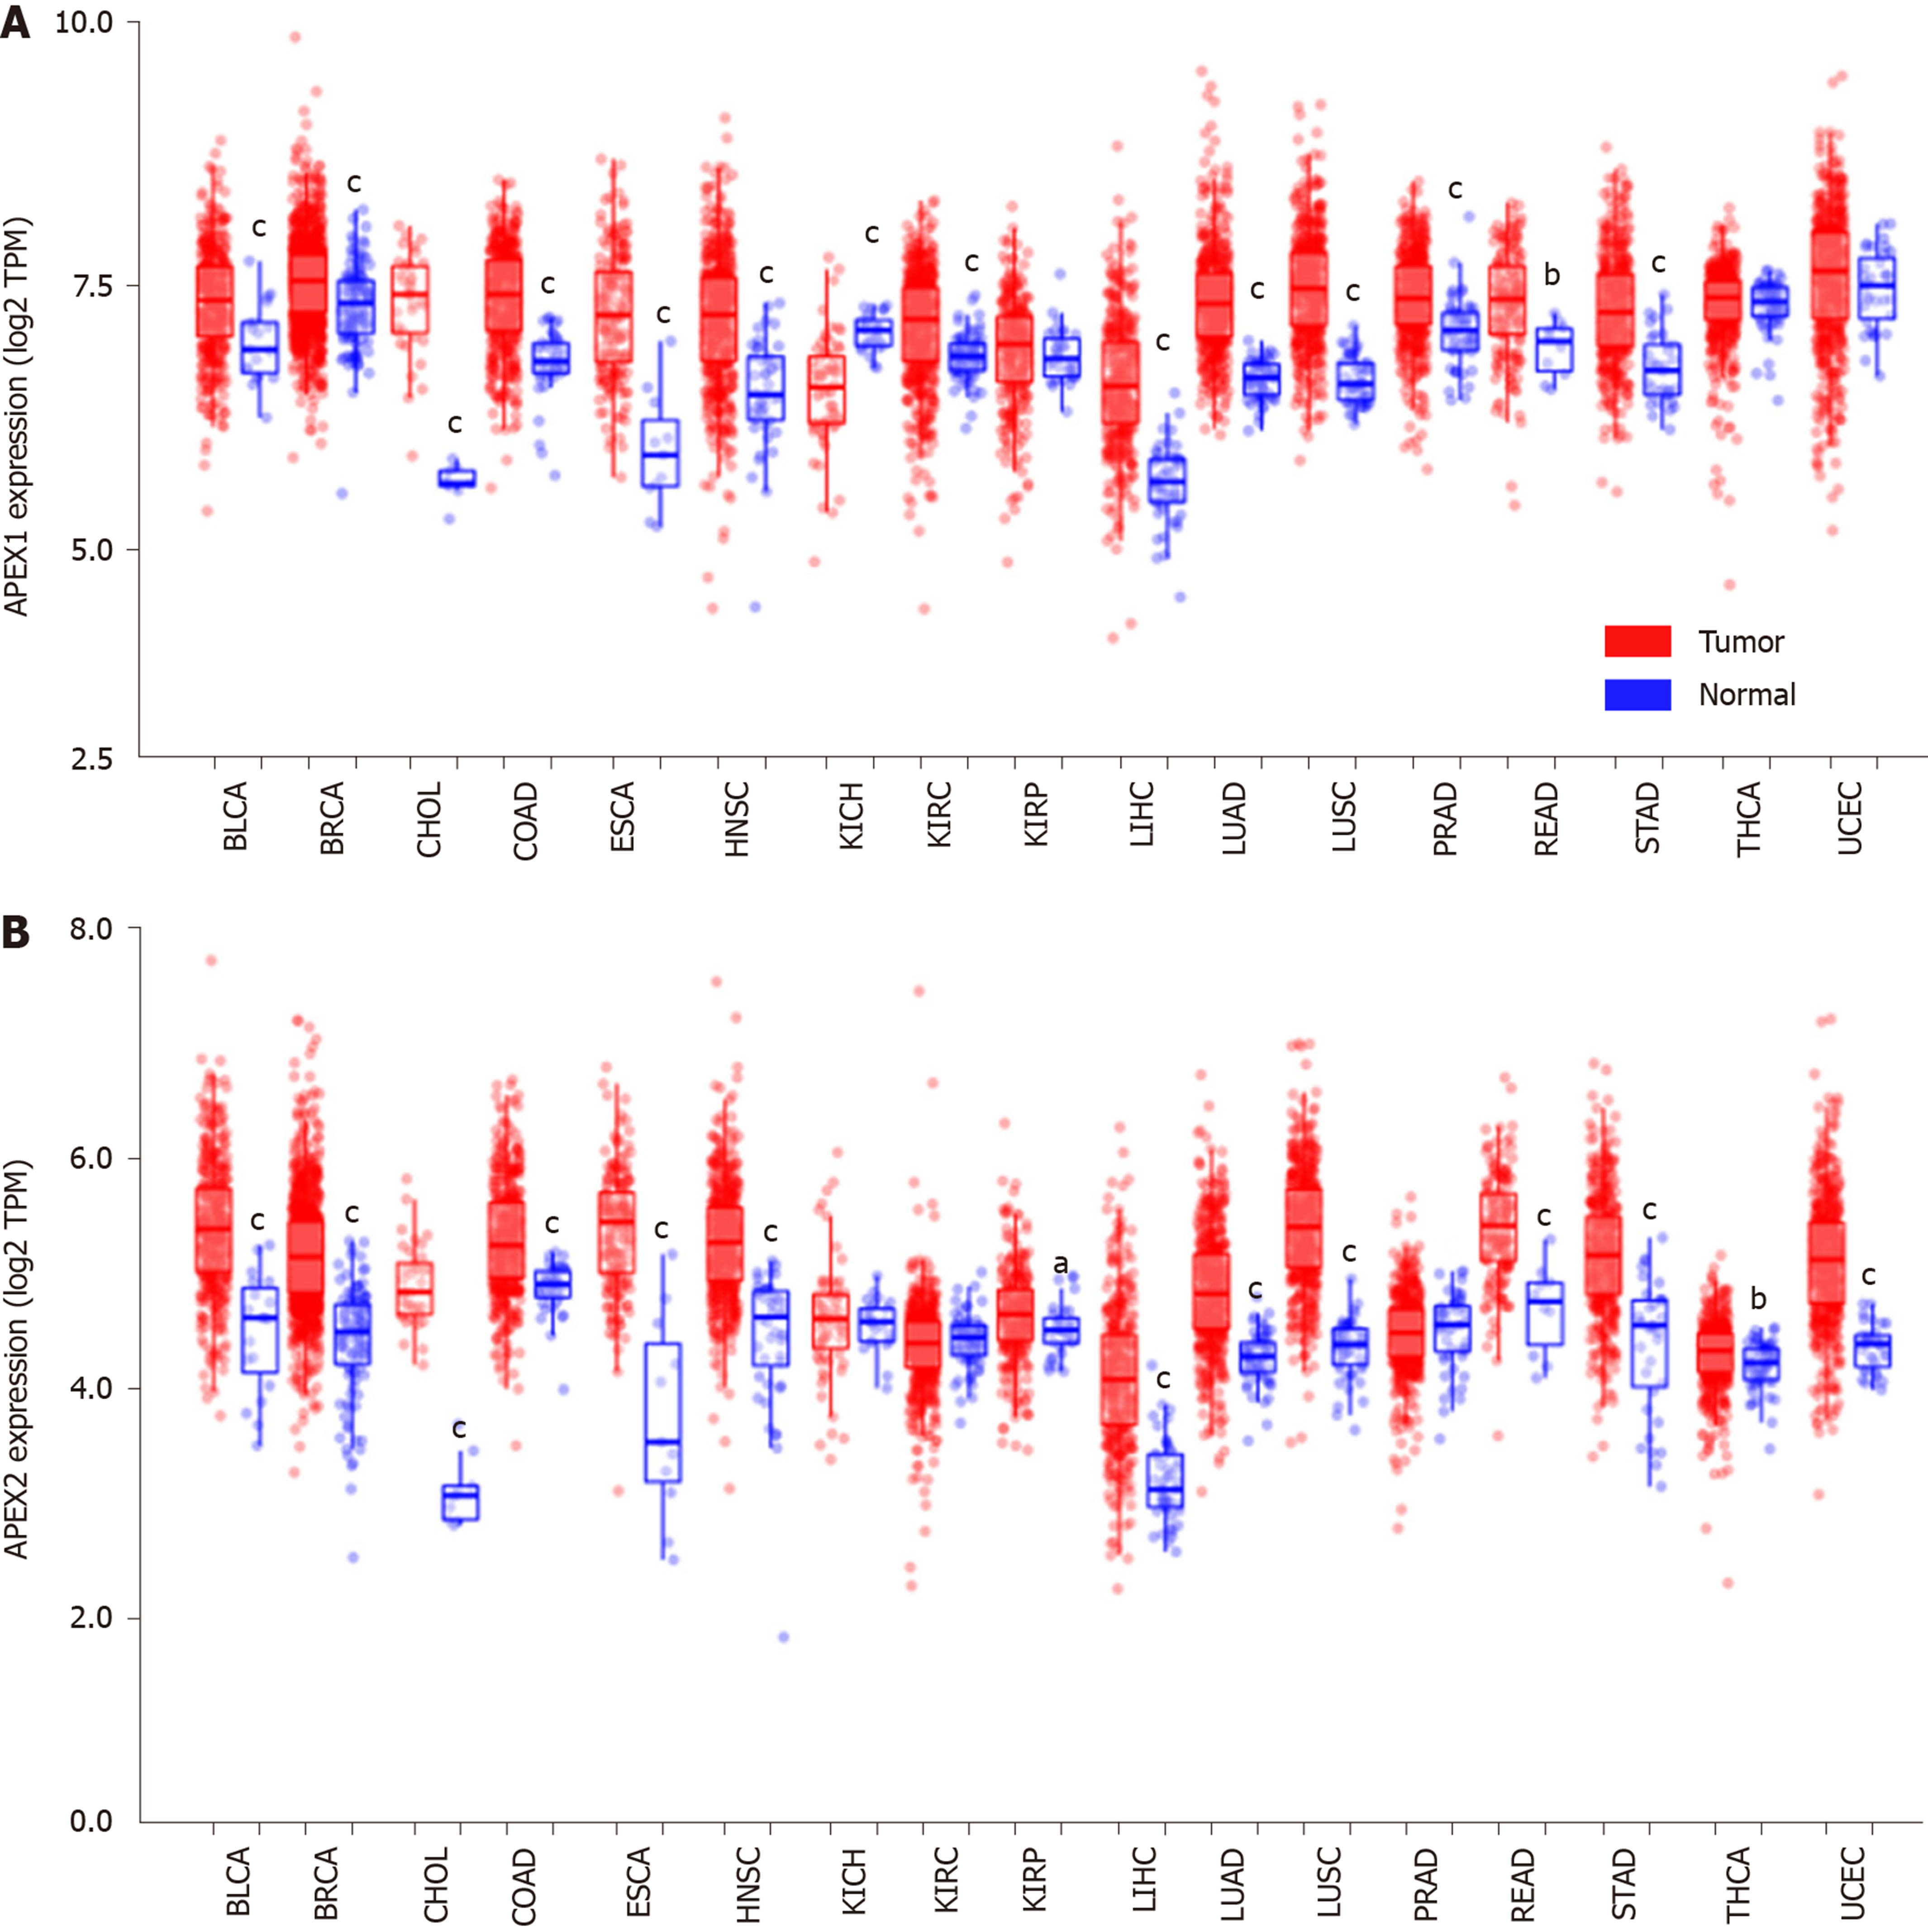
Figure 1 APEX1 and APEX2 expression analysis in pan-cancer.
A: The pan-cancer with adjacent non-tumor and tumor tissues were subjected to the TIMER tool, and the APEX1 and B: APEX2 expression were compared with tumor tissues of each cancer type. aP < 0.05, bP < 0.01, cP < 0.001 vs tumor tissues of each cancer type. TPM: Transcript per million; BLCA: Bladder urothelial carcinoma; BRCA: Breast invasive carcinoma; CHOL: Cholangiocarcinoma; COAD: Colon adenocarcinoma; ESCA: Esophageal carcinoma; HNSC: Head and neck squamous cell carcinoma; KICH: Kidney chromophobe; KIRC: Kidney renal clear cell carcinoma; KIRP: Kidney renal papillary cell carcinoma; LIHC: Liver hepatocellular carcinoma; LUAD: Lung adenocarcinoma; LUSC: Lung squamous cell carcinoma; PRAD: Prostate adenocarcinoma; READ: Rectum adenocarcinoma; STAD: Stomach adenocarcinoma; THCA: Thyroid carcinoma; UCEC: Uterine corpus endometrial carcinoma.
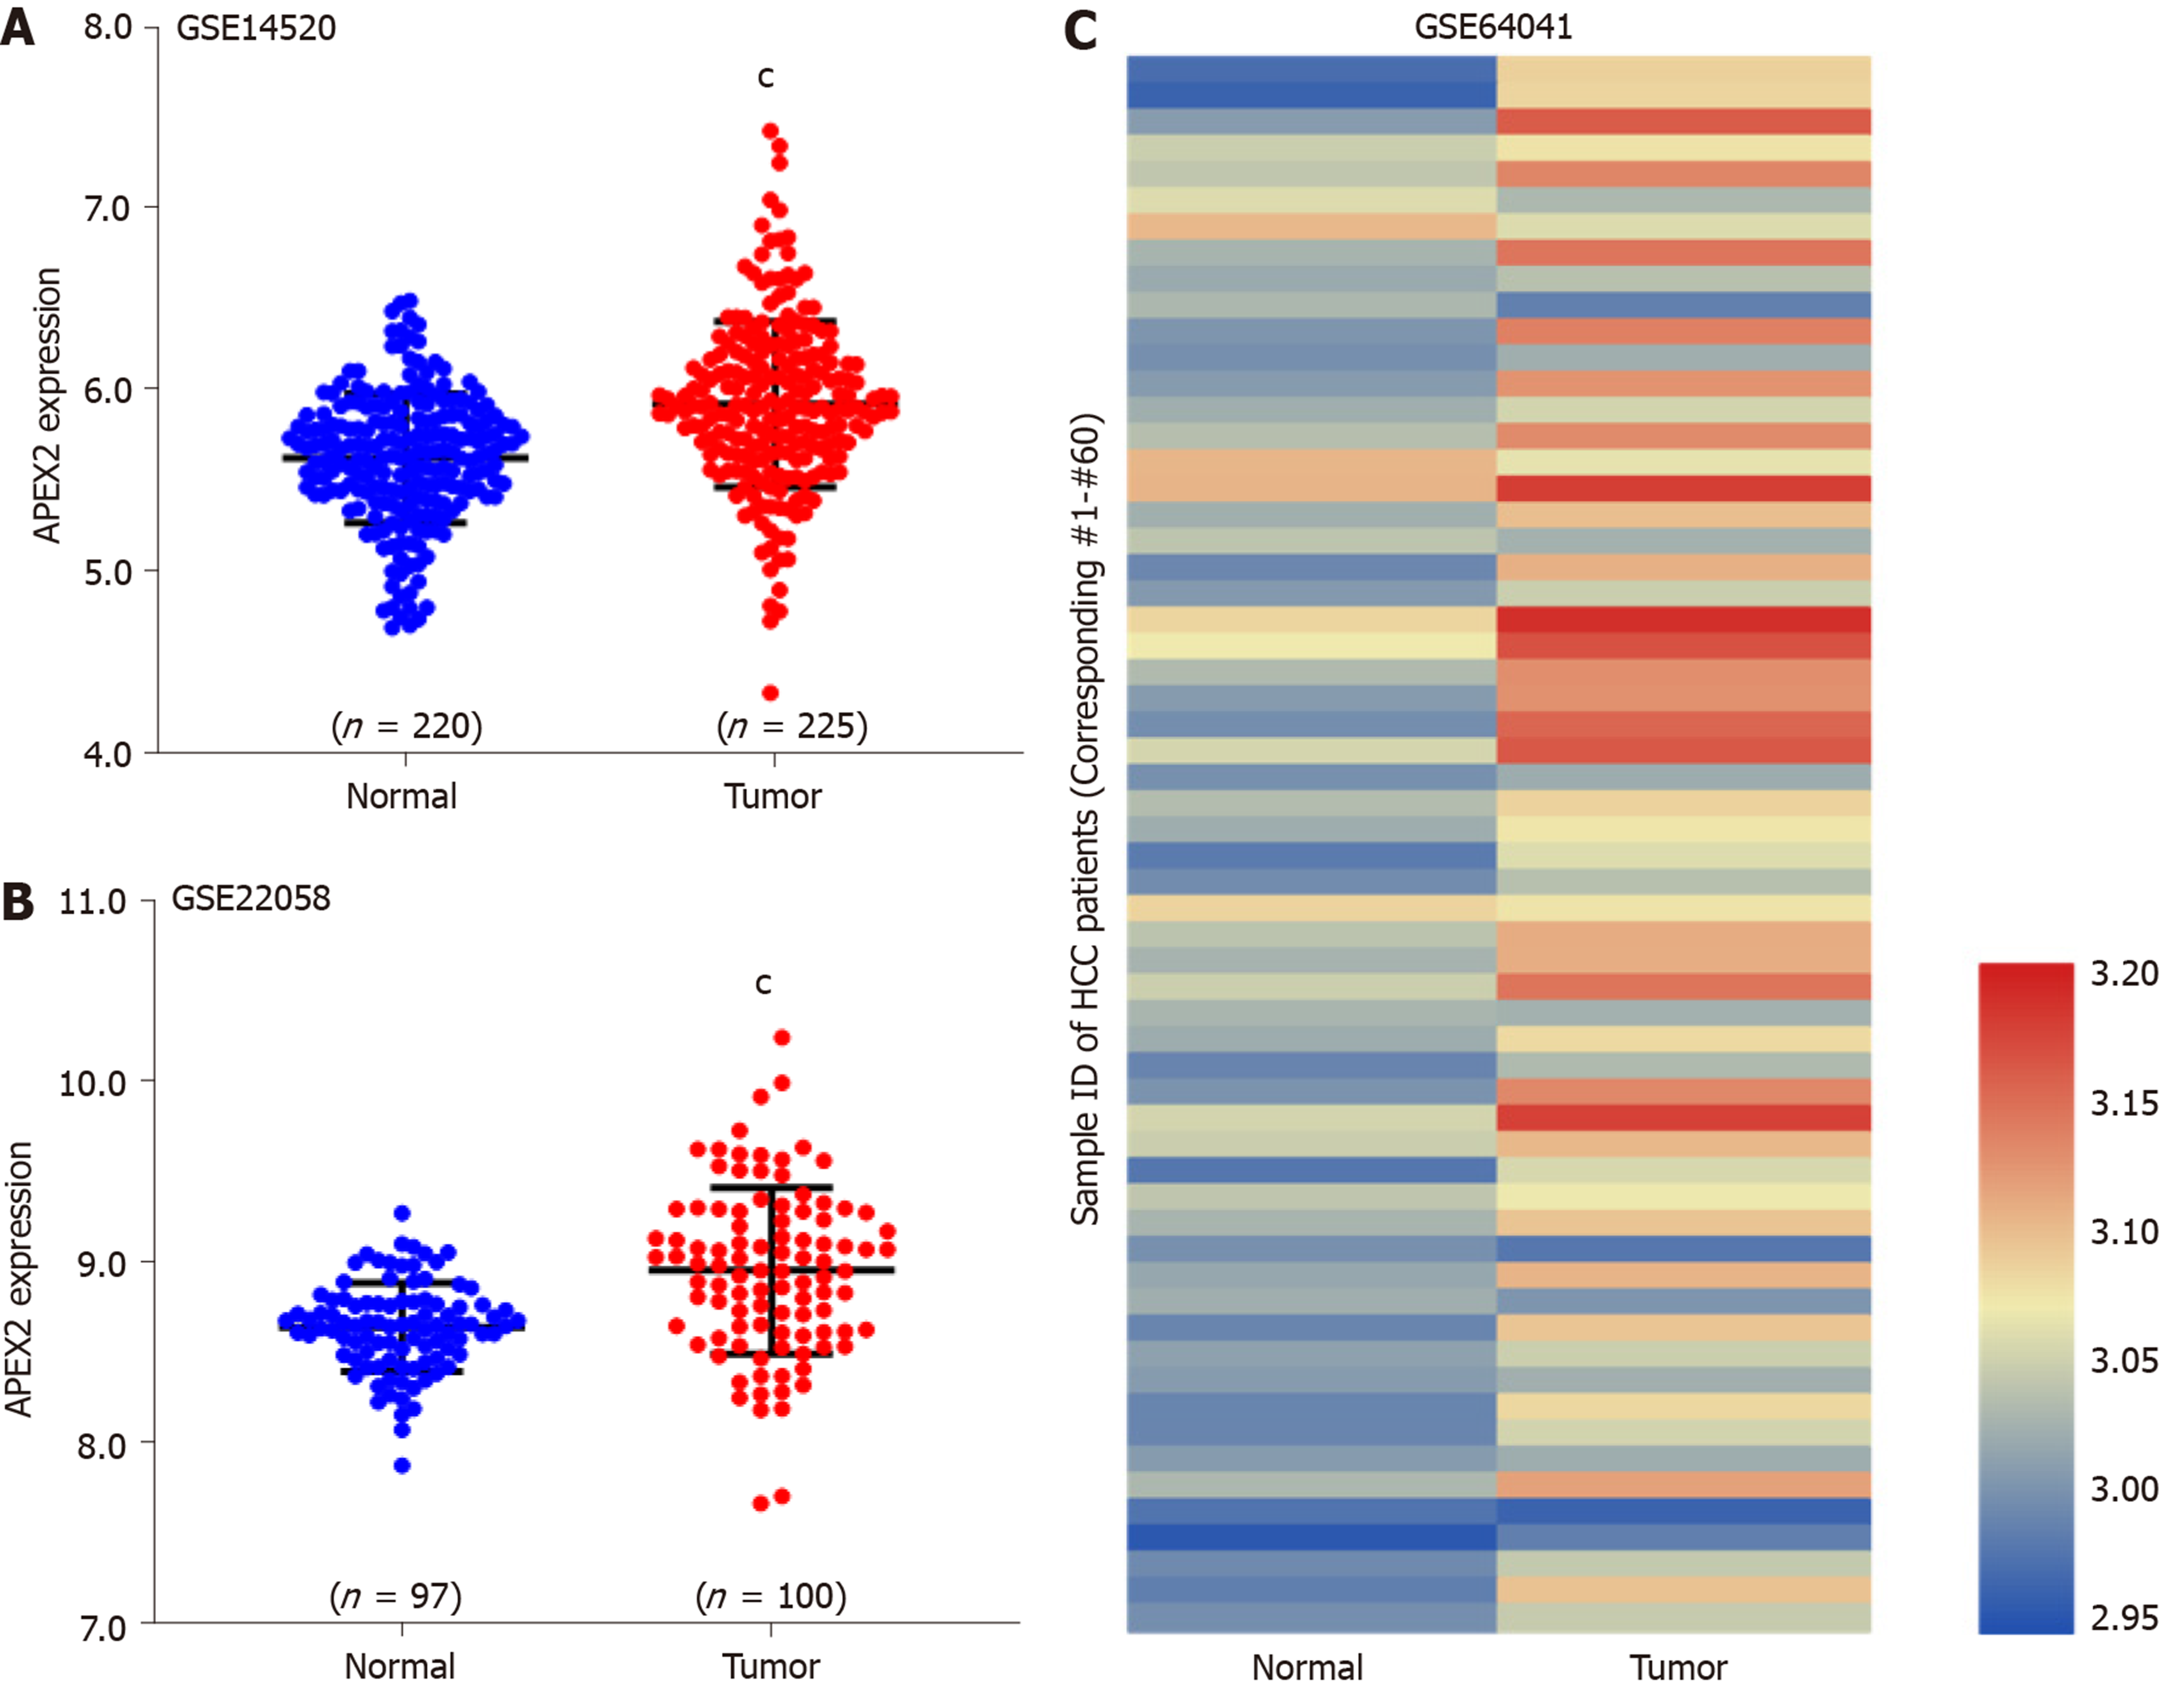
Figure 2 APEX2 over-expression in liver cancer was validated in The Gene Expression Omnibus series.
A: GSE14520 and B: GSE22058 containing adjacent non-tumor and tumor tissues were subjected to detect the APEX2 mRNA level; C: The 60 paired adjacent non-tumor and tumor tissues of GSE64041 were included to show the expression intensity in the heatmap. cP < 0.001 vs adjacent non-tumor tissues. HCC: Hepatocellular carcinoma.
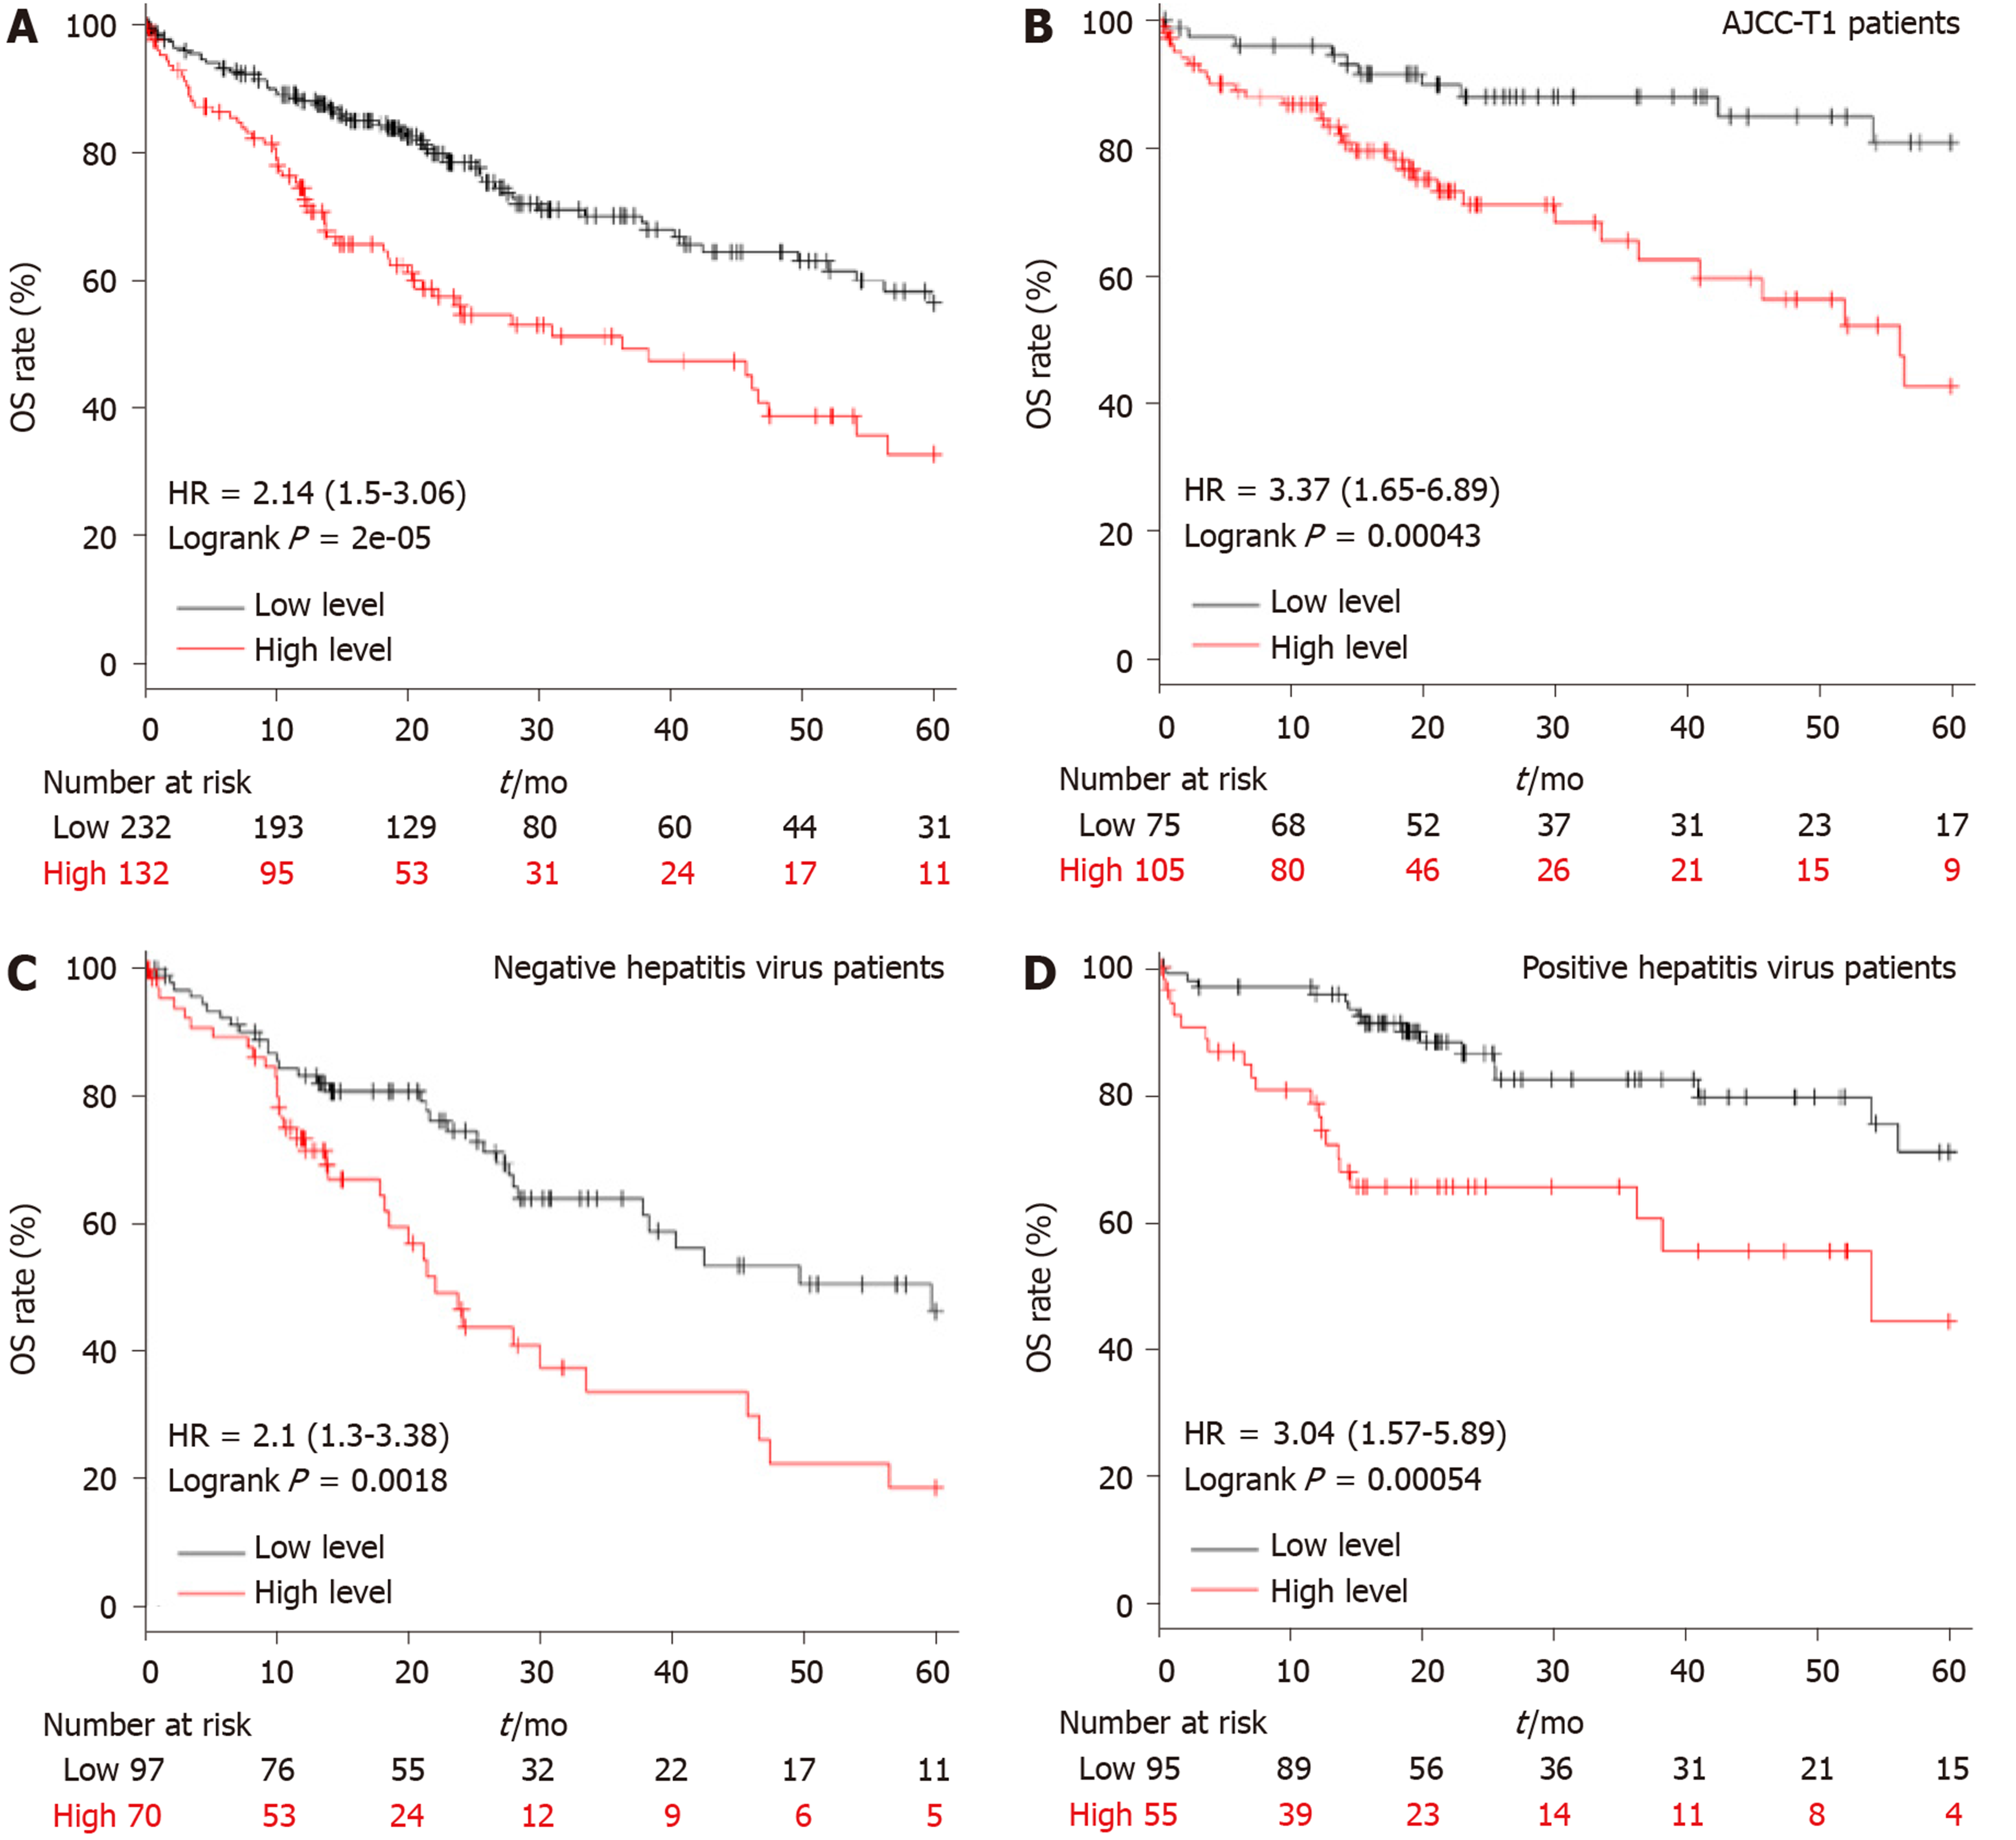
Figure 3 The higher APEX2 level shows a lower overall survival rate.
A: The total liver hepatocellular carcinoma patients, B: Patients with AJCC-T1 stage, C: Patients with positive hepatitis virus, D: Patients with negative hepatitis virus were divided into two groups (high or low-level group). The best cut-off was achieved by the interactive tool of Kaplan Meier plotter, and the overall survival rate was analyzed in 5-year following up. HR: Hazard ratio; OS: Overall survival; AJCC: The American Joint Committee on Cancer.
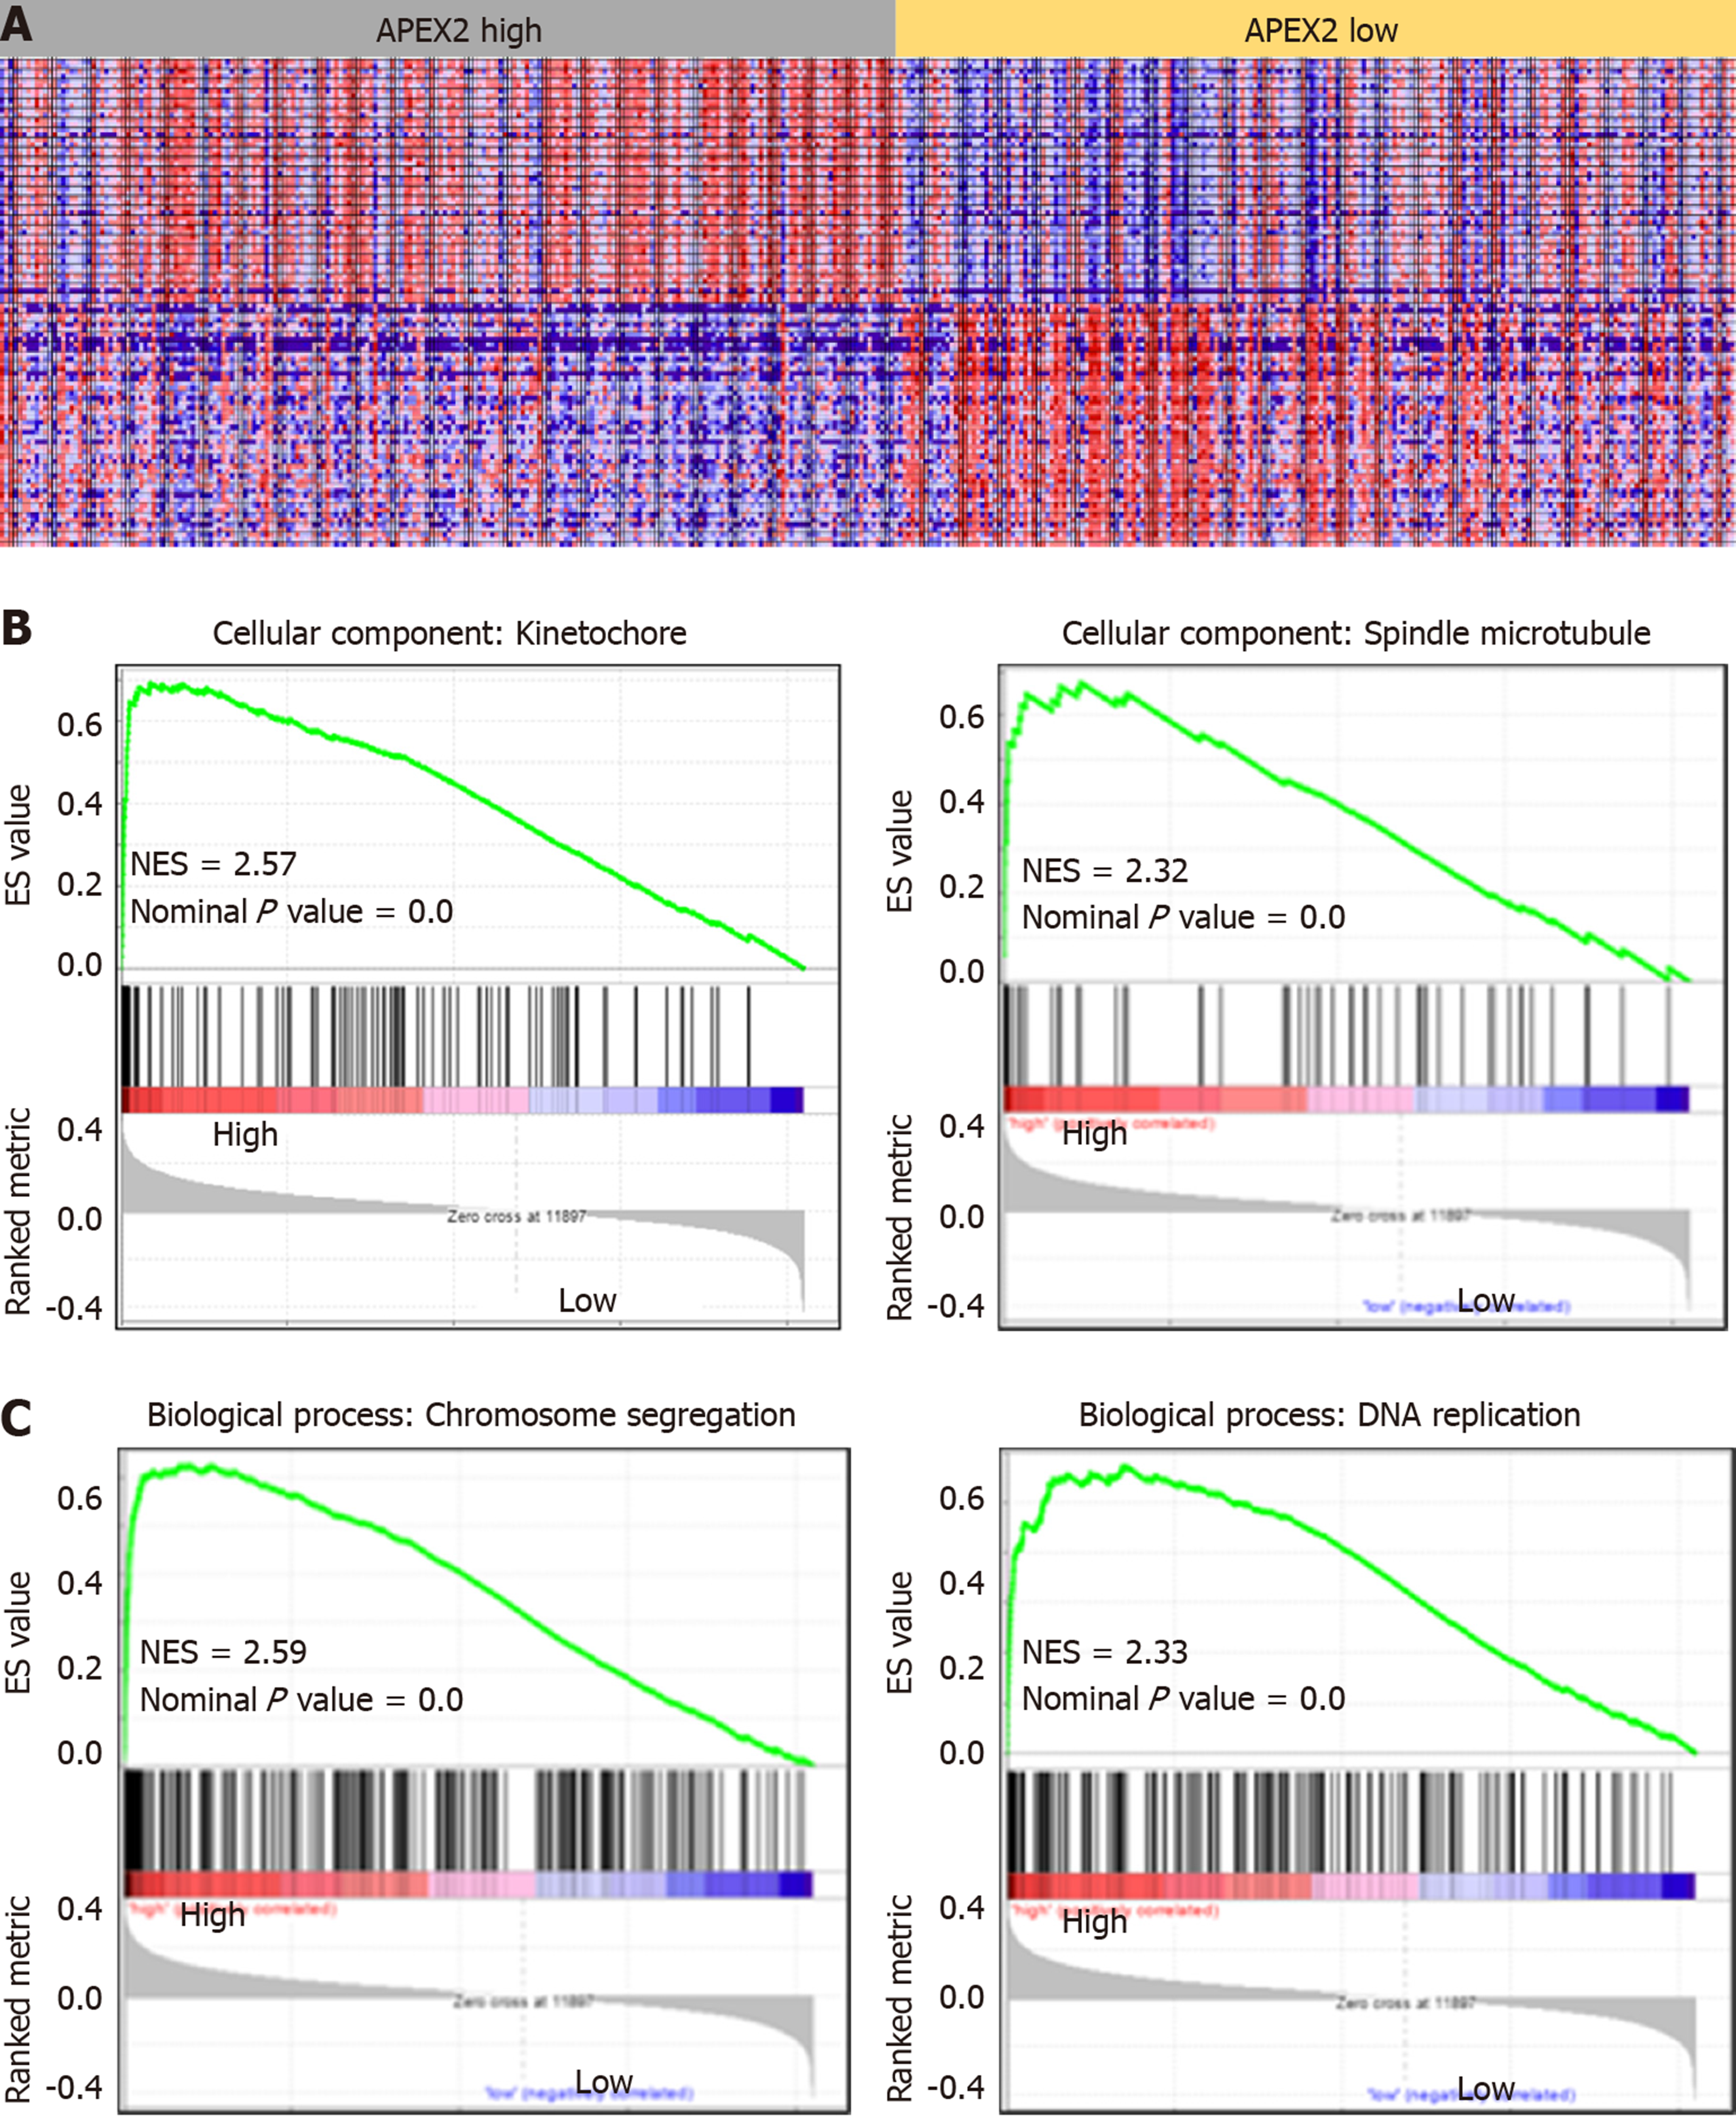
Figure 4 The GSEA analysis based on APEX2 expression.
A: The TCGA liver hepatocellular carcinoma (LIHC) samples were subjected to GSEA analysis, and 195 cases of LIHC samples were set as APEX2 high group, 205 cases of LIHC samples were set as APEX2 low group; B: The cellular component analysis based on GSEA was conducted, and the two main cellular components were shown; C: The APEX2-associated biological process was achieved by GSEA analysis. NES: Normalized Enrichment Score; TCGA: The Cancer Genome Atlas; GSEA: Gene Set Enrichment Analysis.
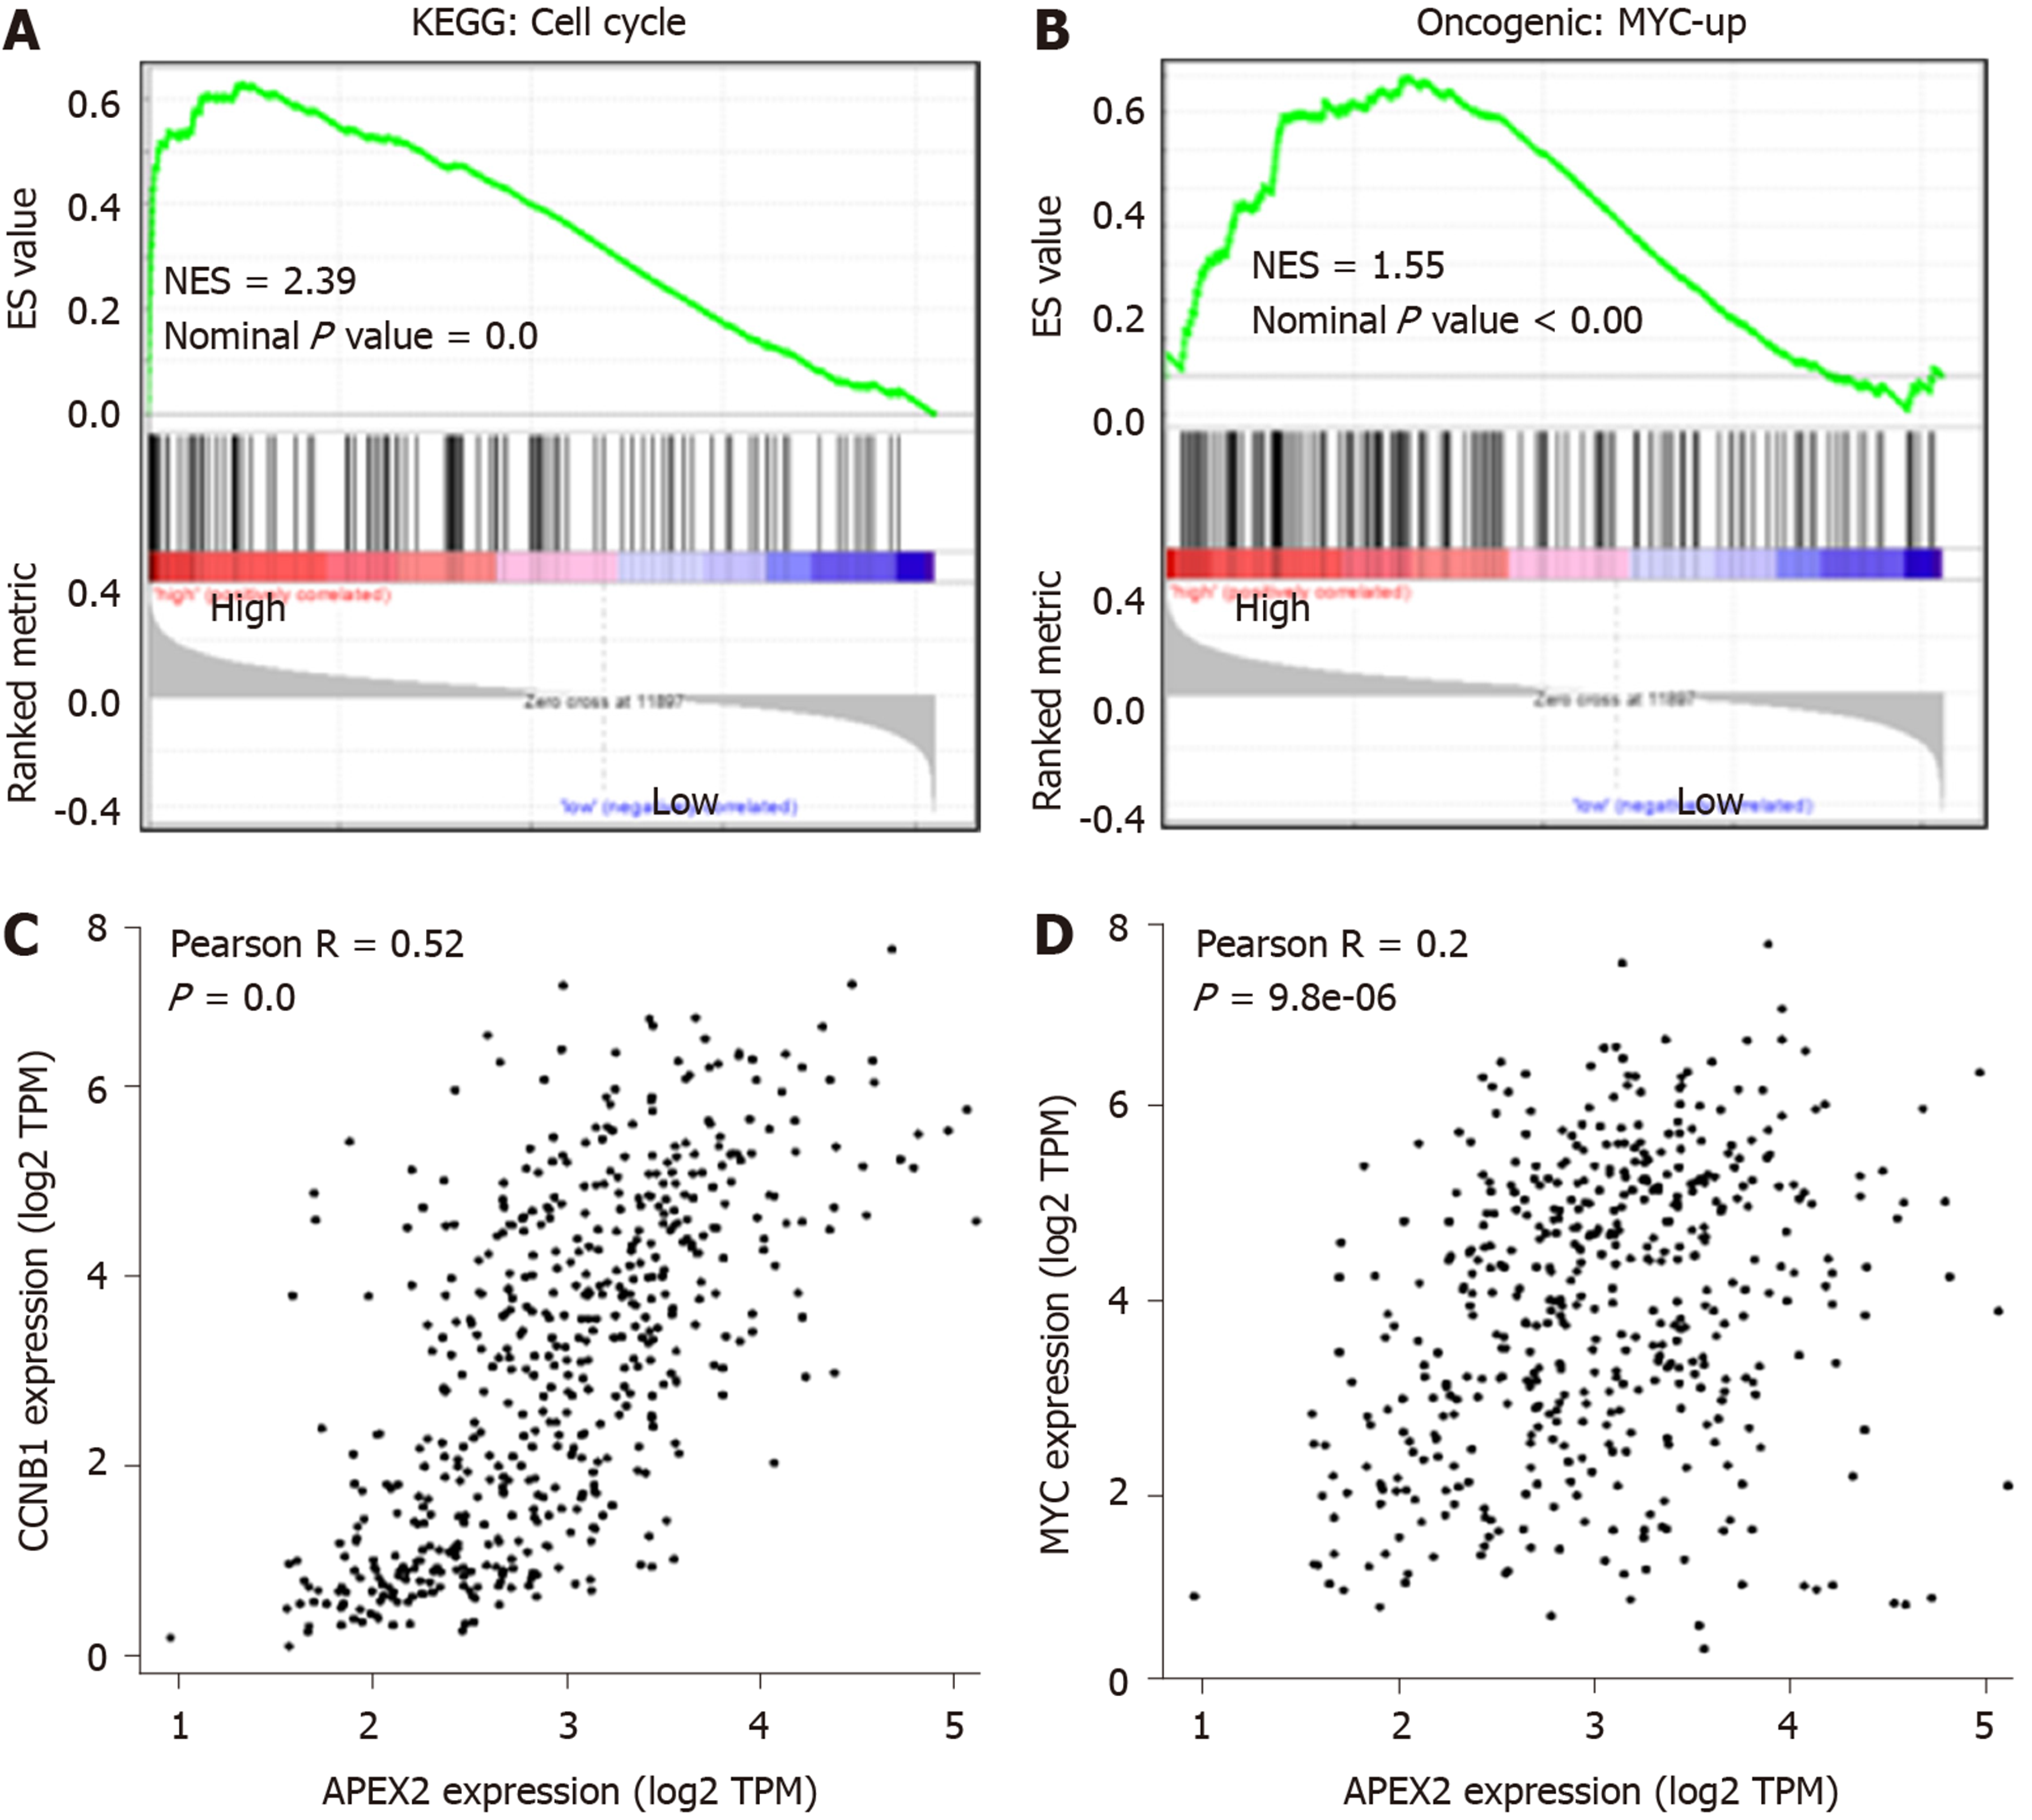
Figure 5 The positive correlation between APEX2 and cell cycle and MYC pathways.
A: The KEGG analysis based on GSEA was conducted in TCGA liver hepatocellular carcinoma samples; B: The specific oncogenic analysis was performed by GSEA software; C: The correlation analysis between APEX2 expression and the CCNB1, D: MYC were conducted in GEPIA web-interactive tool. KEGG: Kyoto Encyclopedia of Genes and Genomes; NES: Normalized Enrichment Score; TCGA: The Cancer Genome Atlas; GSEA: Gene Set Enrichment Analysis; TPM: Transcript per million.
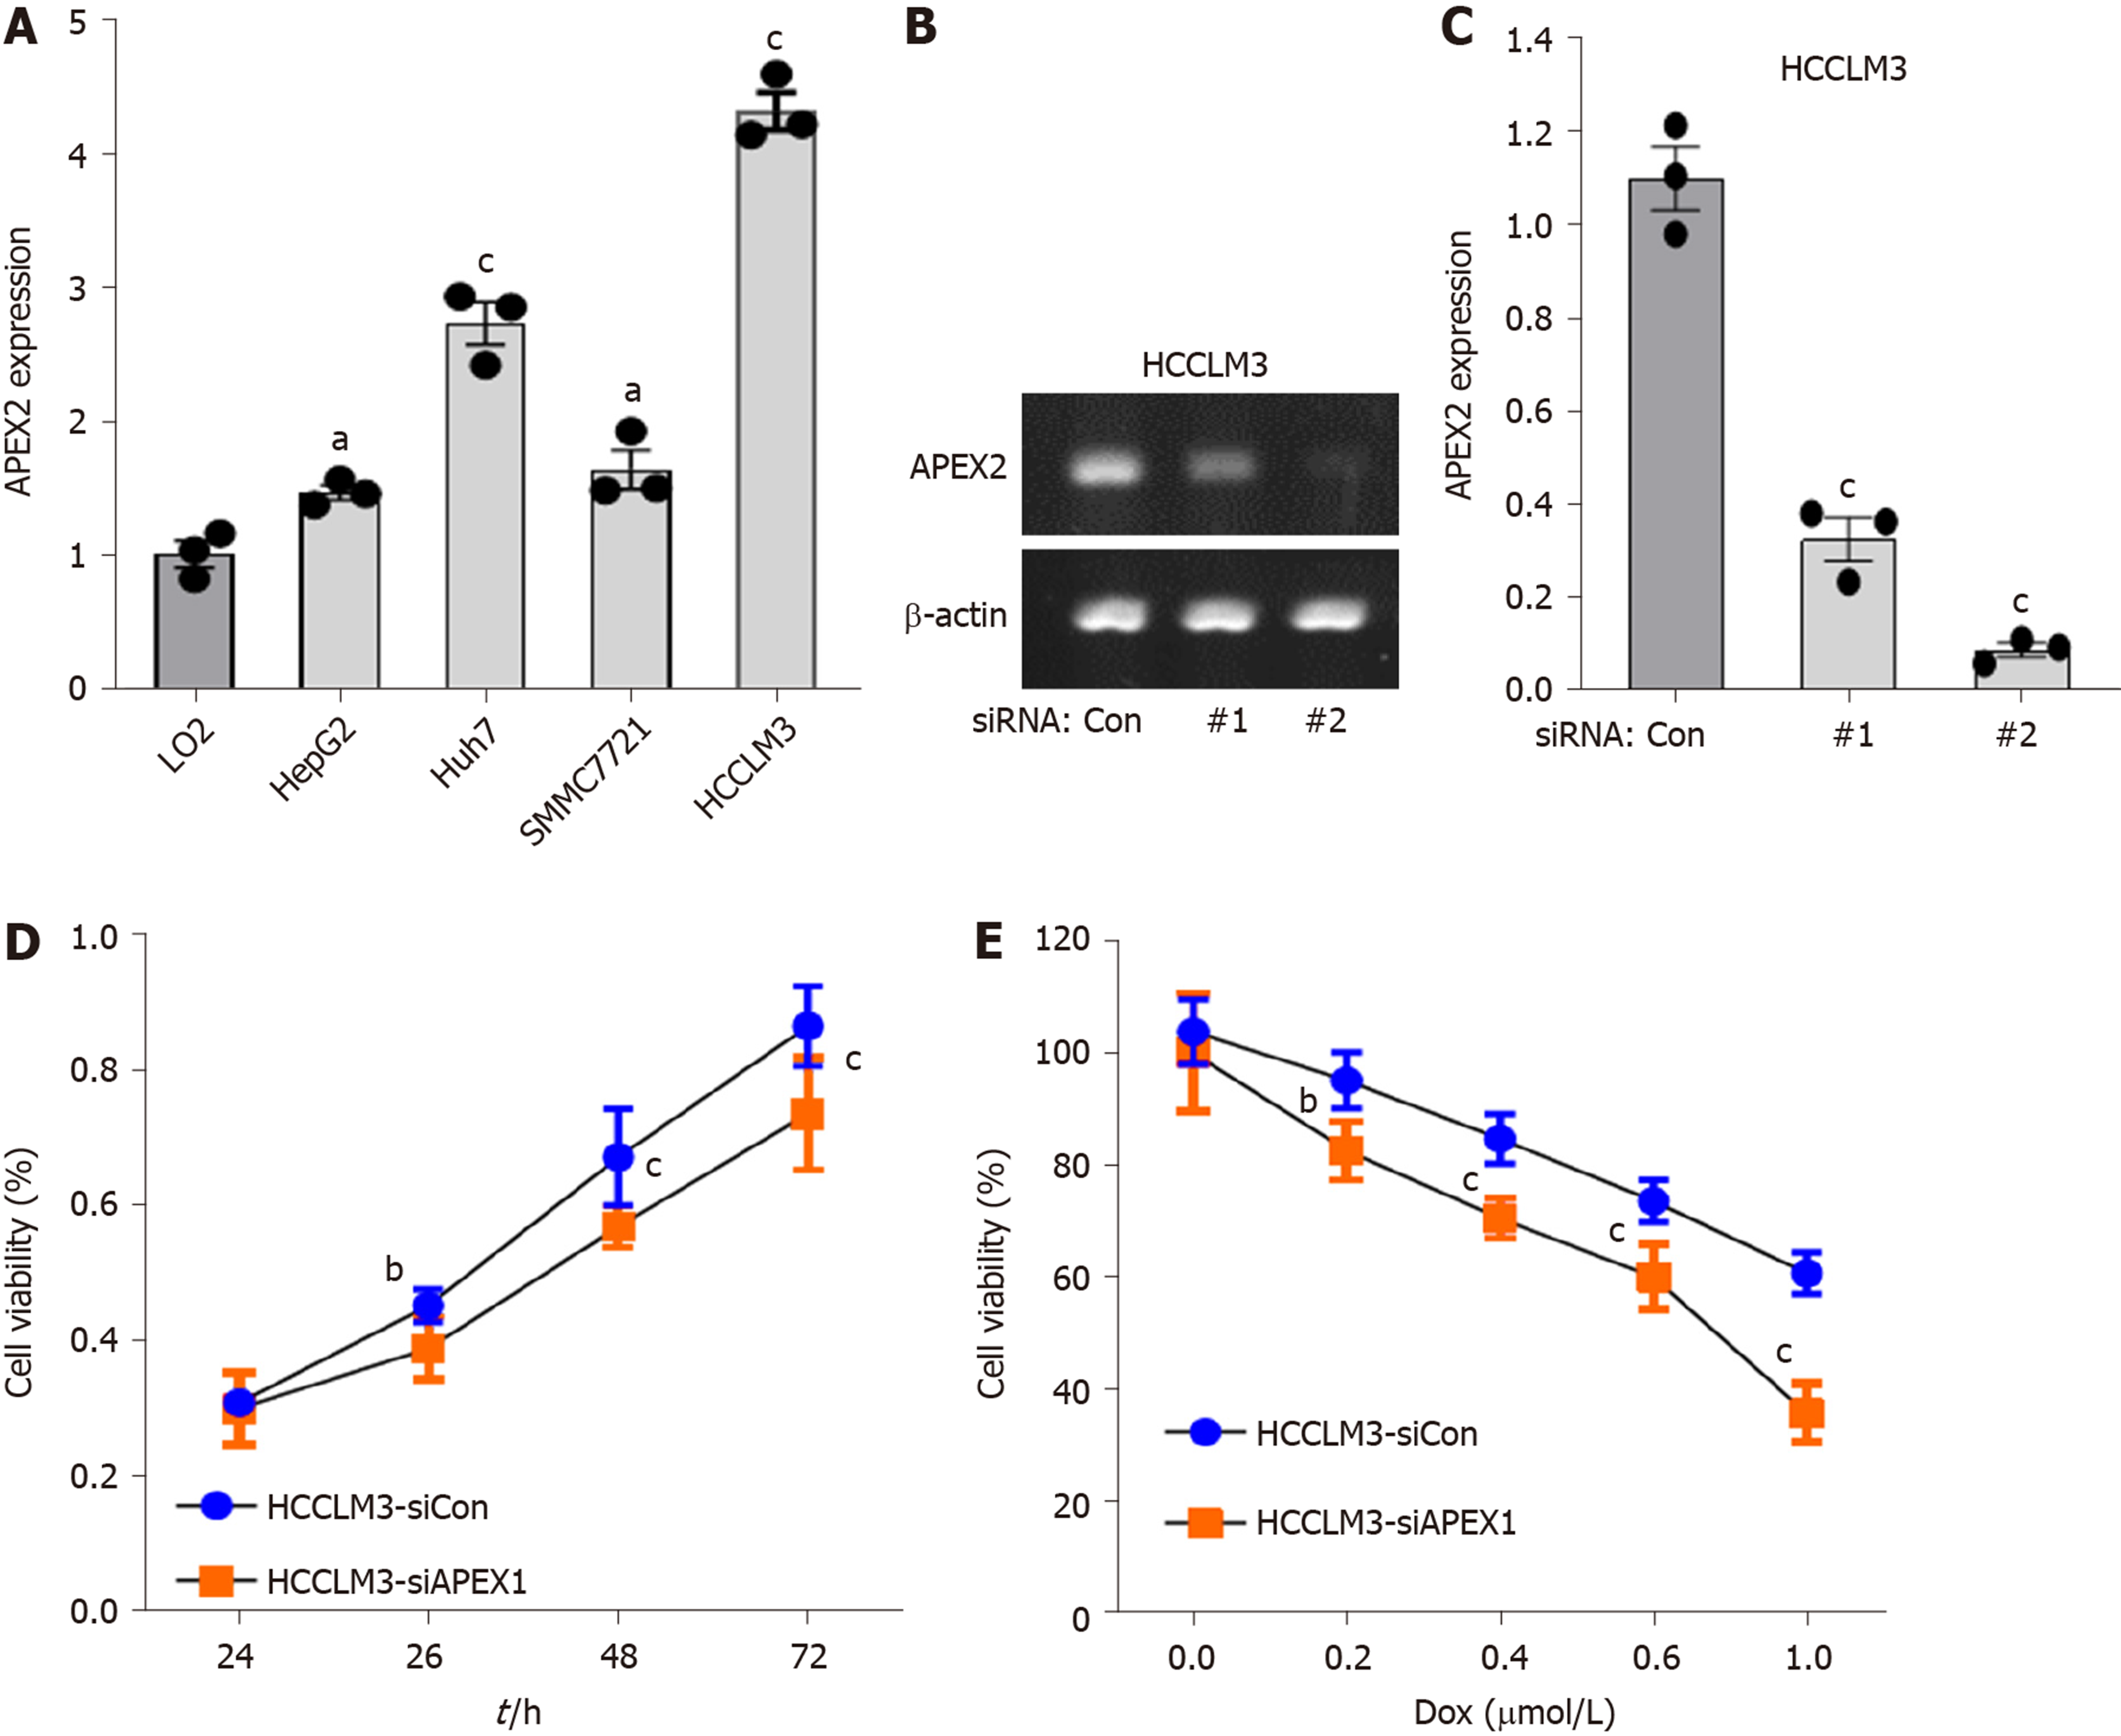
Figure 6 APEX2 is highly expressed in liver cancer cells, and knockdown of APEX2 could inhibit the cell viability.
A: Normal LO2 liver cells and HepG2, Huh7, SMMC7721 and HCCLM3 liver cancer cell lines were subjected to detect the APEX2 expression by qPCR; B: The two siRNA sequence against APEX2 was transfected in HCCLM3 cells, and qPCR was applied to confirm the efficiency of knockdown; C: The quantitative analysis of the DNA electrophoresis was conducted by Quantity One software; D: The HCCLM3 cells were transfected with siRNA against APEX2 and scramble control. The cell viability was assessed by CCK-8 at different culture times; E: The HCCLM3 cells were knocked down with siRNA against APEX2 and scramble control, and then treated with different concentration of DOX for 24h. CCK-8 assay was applied to examine the cell viability. siRNA: Small interfering RNA; siCon: Scramble control sequence; DOX: Doxorubicin.
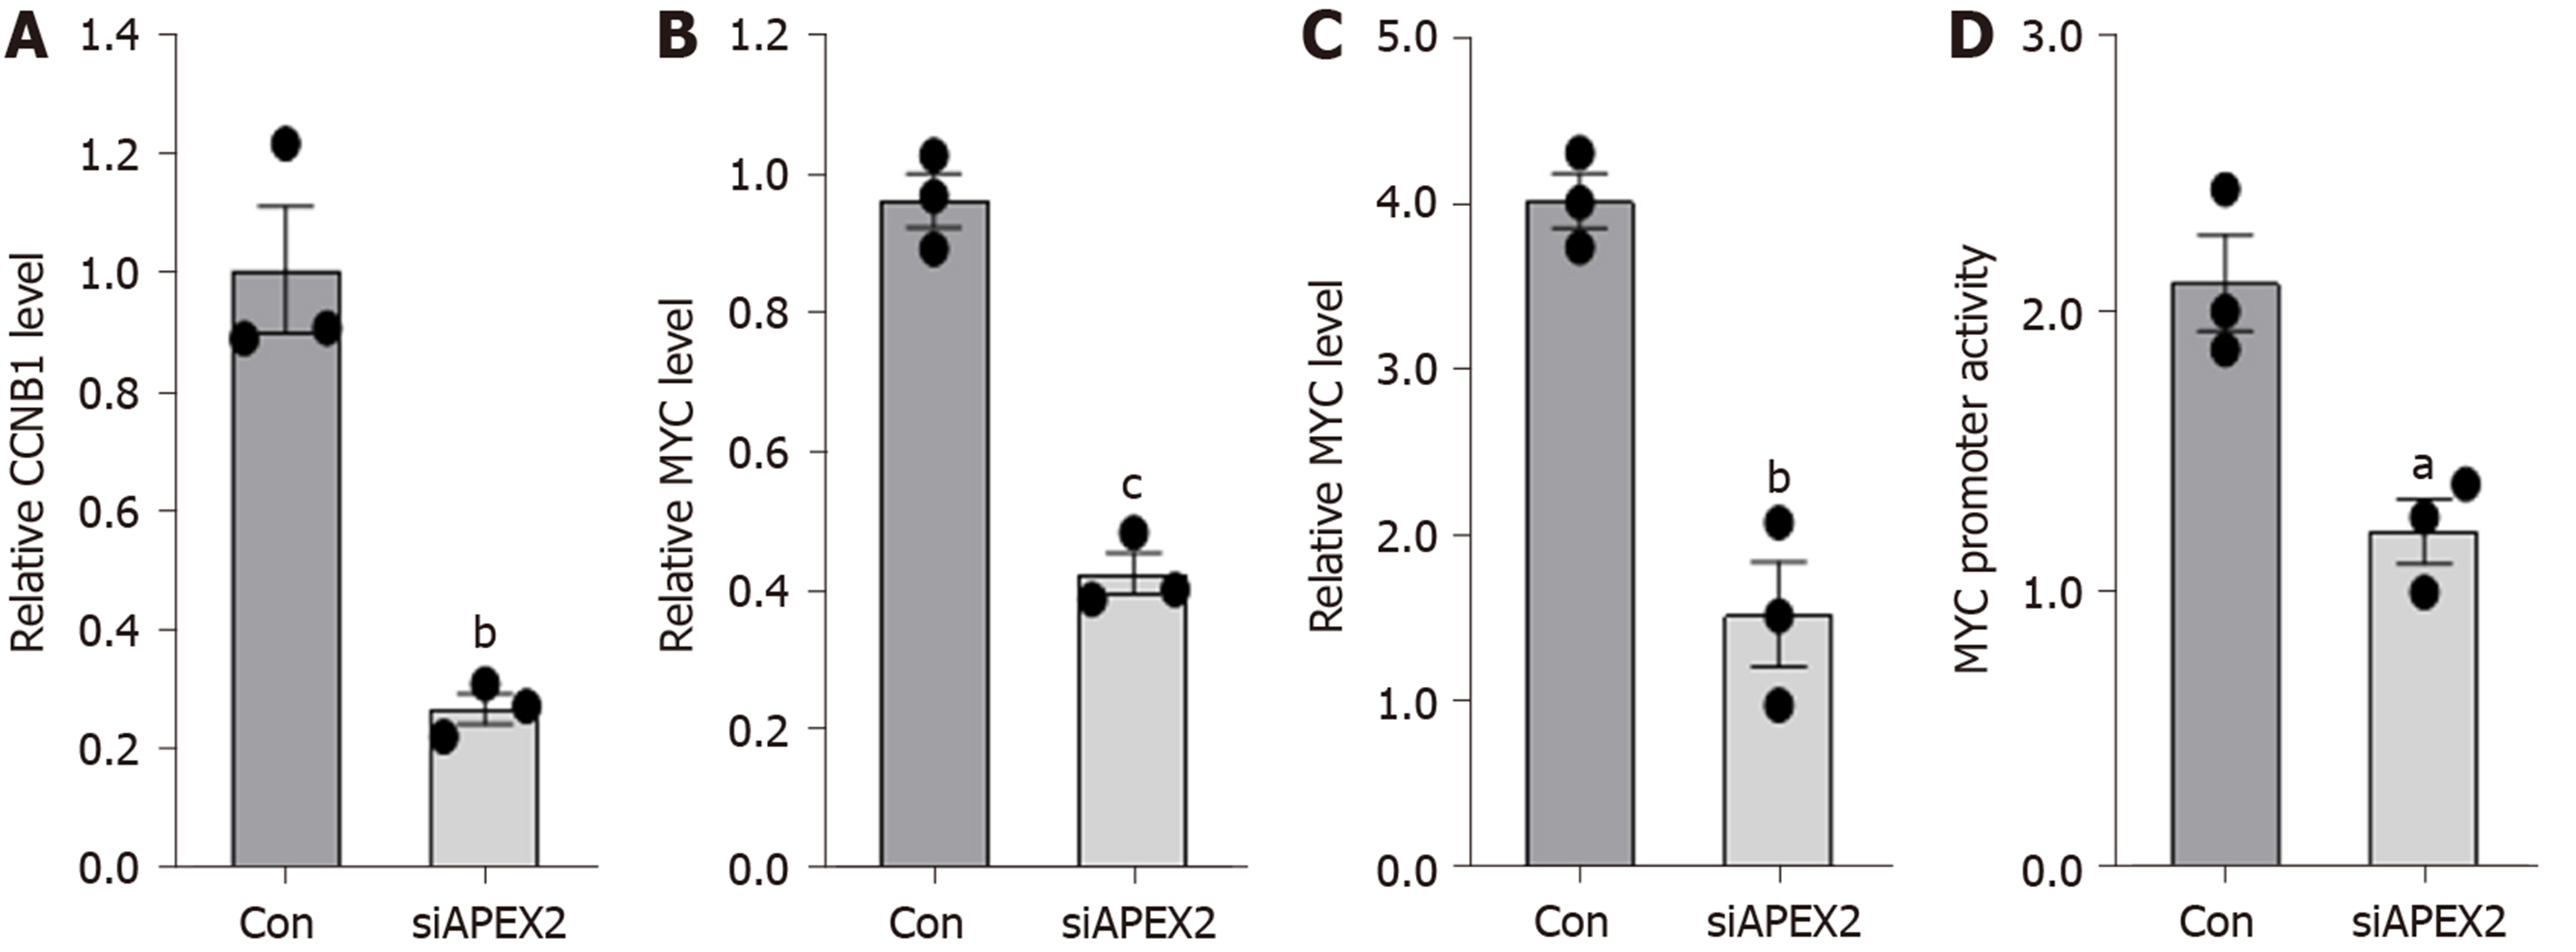
Figure 7 Knockdown of APEX2 can suppress the CCNB1 and MYC pathways.
A: HCCLM3 cells were transfected with siRNA against APEX2 and scramble control, and the CCNB1, B: MYC mRNA level were analyzed by qPCR assay; D: The promoter transcription activity of CCNB1 and D: MYC were analyzed by dual-luciferase reporter assay. siRNA: Small interfering RNA; siCon: Scramble control sequence.
- Citation: Zheng R, Zhu HL, Hu BR, Ruan XJ, Cai HJ. Identification of APEX2 as an oncogene in liver cancer. World J Clin Cases 2020; 8(14): 2917-2929
- URL: https://www.wjgnet.com/2307-8960/full/v8/i14/2917.htm
- DOI: https://dx.doi.org/10.12998/wjcc.v8.i14.2917


