Copyright
©The Author(s) 2020.
World J Clin Cases. Jul 26, 2020; 8(14): 2917-2929
Published online Jul 26, 2020. doi: 10.12998/wjcc.v8.i14.2917
Published online Jul 26, 2020. doi: 10.12998/wjcc.v8.i14.2917
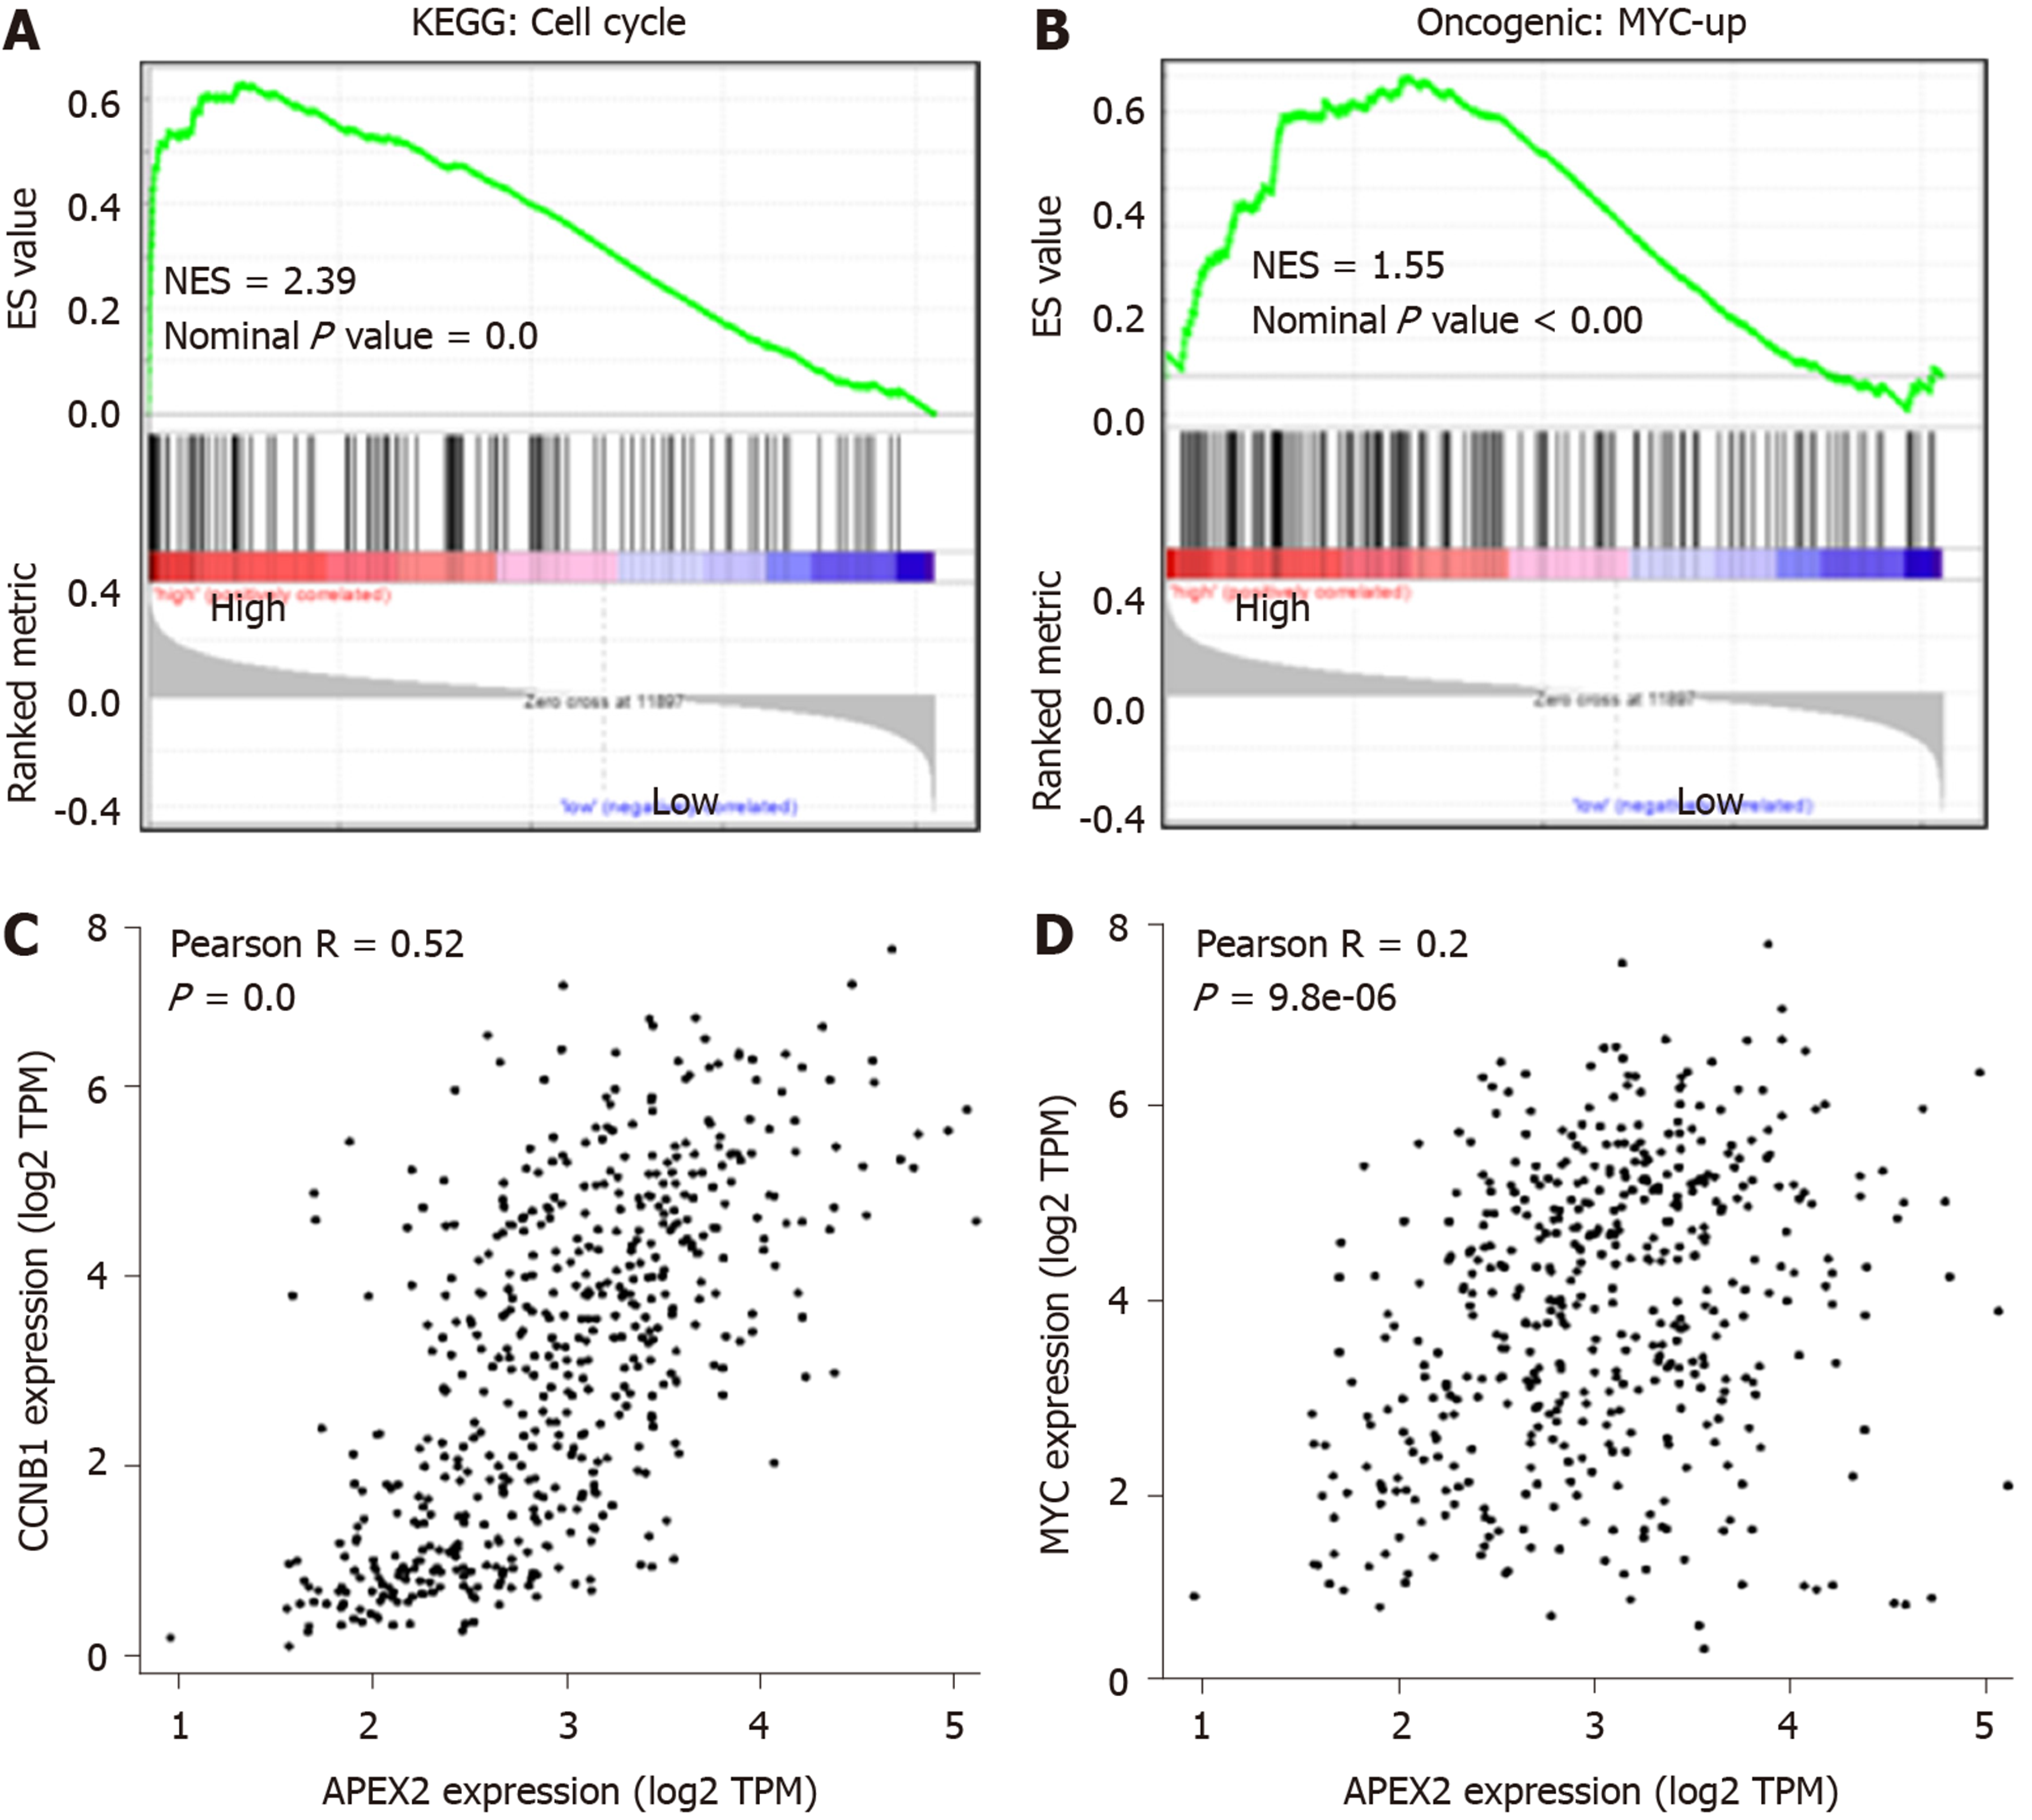
Figure 5 The positive correlation between APEX2 and cell cycle and MYC pathways.
A: The KEGG analysis based on GSEA was conducted in TCGA liver hepatocellular carcinoma samples; B: The specific oncogenic analysis was performed by GSEA software; C: The correlation analysis between APEX2 expression and the CCNB1, D: MYC were conducted in GEPIA web-interactive tool. KEGG: Kyoto Encyclopedia of Genes and Genomes; NES: Normalized Enrichment Score; TCGA: The Cancer Genome Atlas; GSEA: Gene Set Enrichment Analysis; TPM: Transcript per million.
- Citation: Zheng R, Zhu HL, Hu BR, Ruan XJ, Cai HJ. Identification of APEX2 as an oncogene in liver cancer. World J Clin Cases 2020; 8(14): 2917-2929
- URL: https://www.wjgnet.com/2307-8960/full/v8/i14/2917.htm
- DOI: https://dx.doi.org/10.12998/wjcc.v8.i14.2917


