Copyright
©The Author(s) 2019.
World J Clin Cases. Mar 6, 2019; 7(5): 668-675
Published online Mar 6, 2019. doi: 10.12998/wjcc.v7.i5.668
Published online Mar 6, 2019. doi: 10.12998/wjcc.v7.i5.668
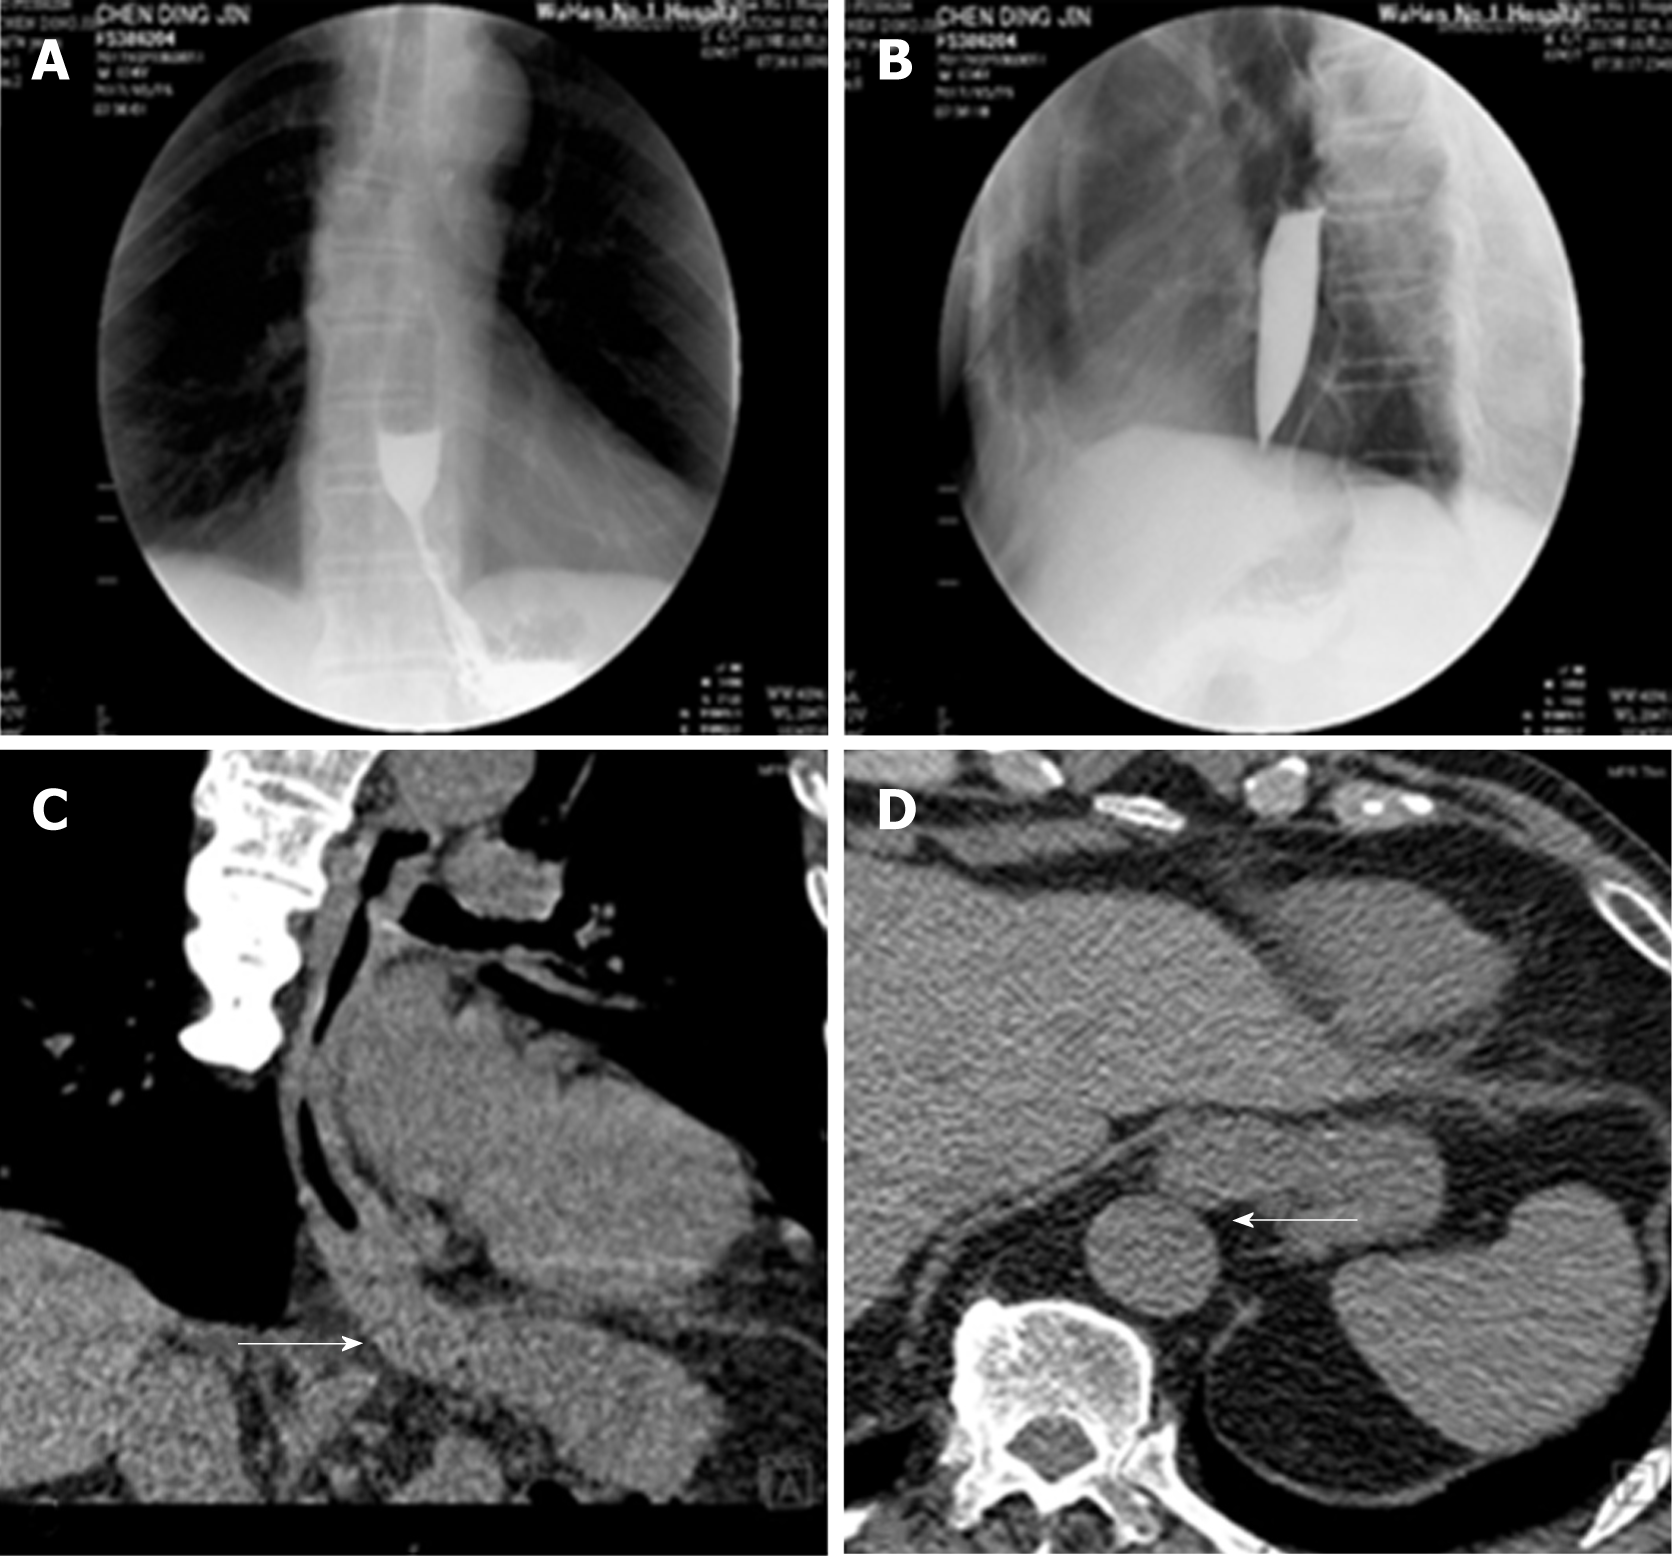
Figure 1 X-ray and thoracic computed tomography imaging of the patient.
A and B: A barium meal X-ray revealed poor relaxation of the distal sphincter, dilatation of middle esophageal and stenosis of lower esophagus, weakened esophageal peristalsis, and ultimately stricture of the esophageal lumen with a beak-like appearance; C and D: Thoracic computed tomography imaging revealed thickening of the esophageal wall and antrum stricture (arrows), with a regular mucosal pattern.
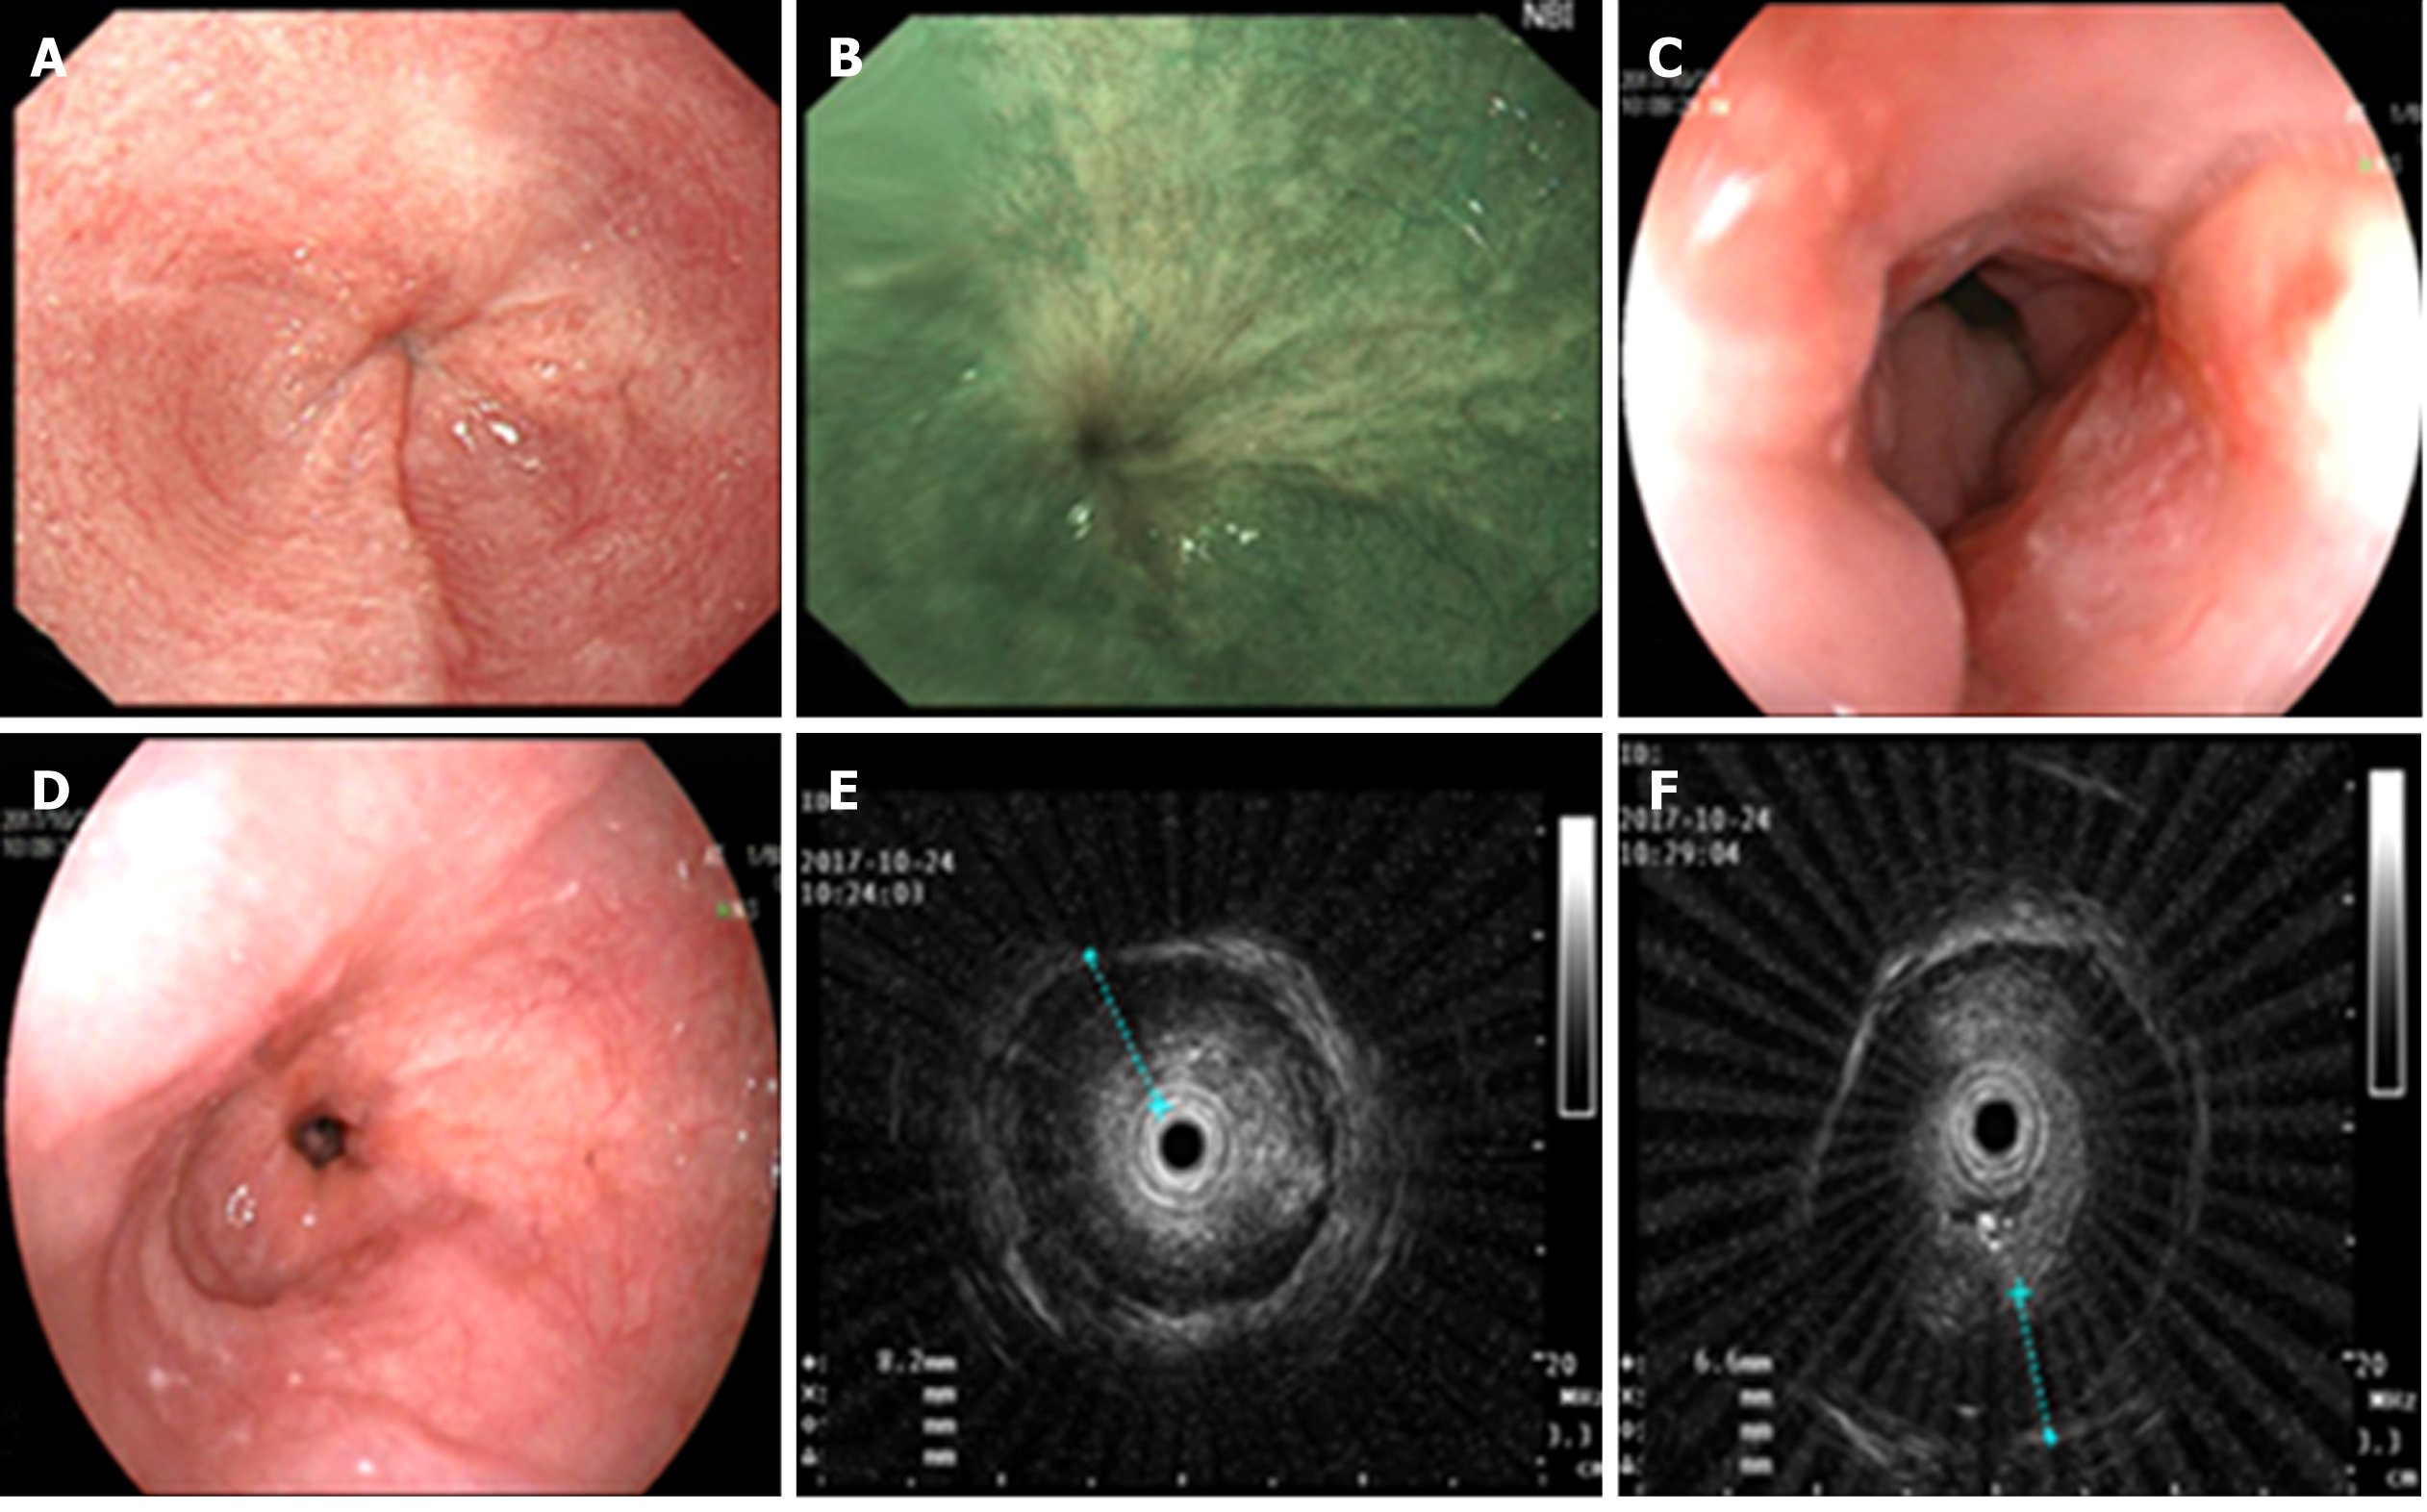
Figure 2 Upper gastrointestinal endoscopy and endoscopic ultrasonography of the patient.
A-D: Upper gastrointestinal endoscopy revealed esophageal stenosis 37 cm from the incisors, along with mucosal surface asperities; E and F: Endoscopic ultrasonography revealed that the esophageal ring cavity was in the stenosis and the muscularis propria markedly thickened, together with an unclear structure of the first to third layers.
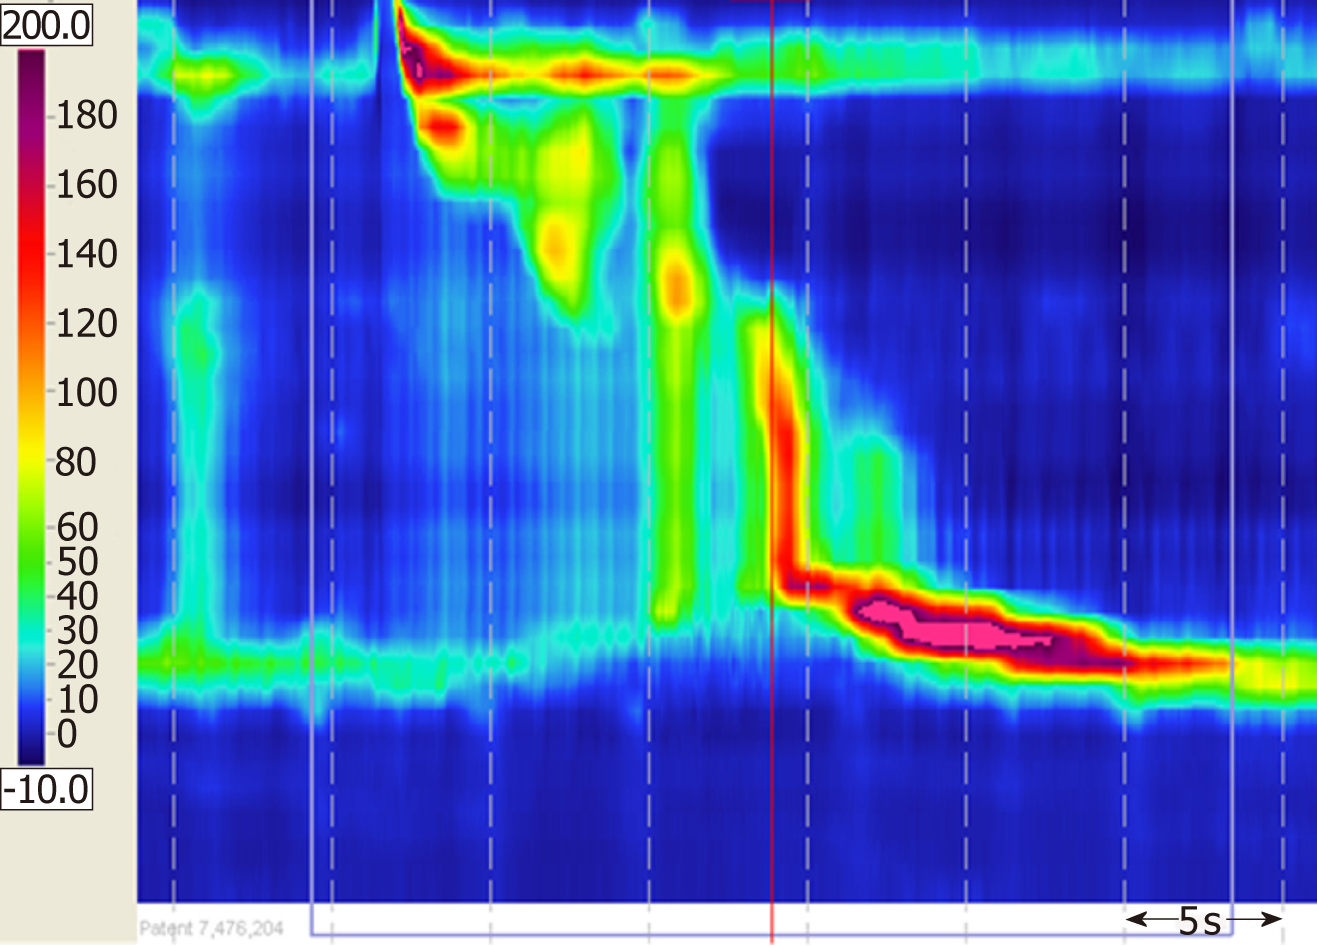
Figure 3 High-resolution esophageal manometry.
The integrated relaxation pressure (4s integrated relaxation pressure; normal reference value: 15 mm Hg) was 26.6 mm Hg which suggested relaxation dysfunction of the lower esophageal sphincter.
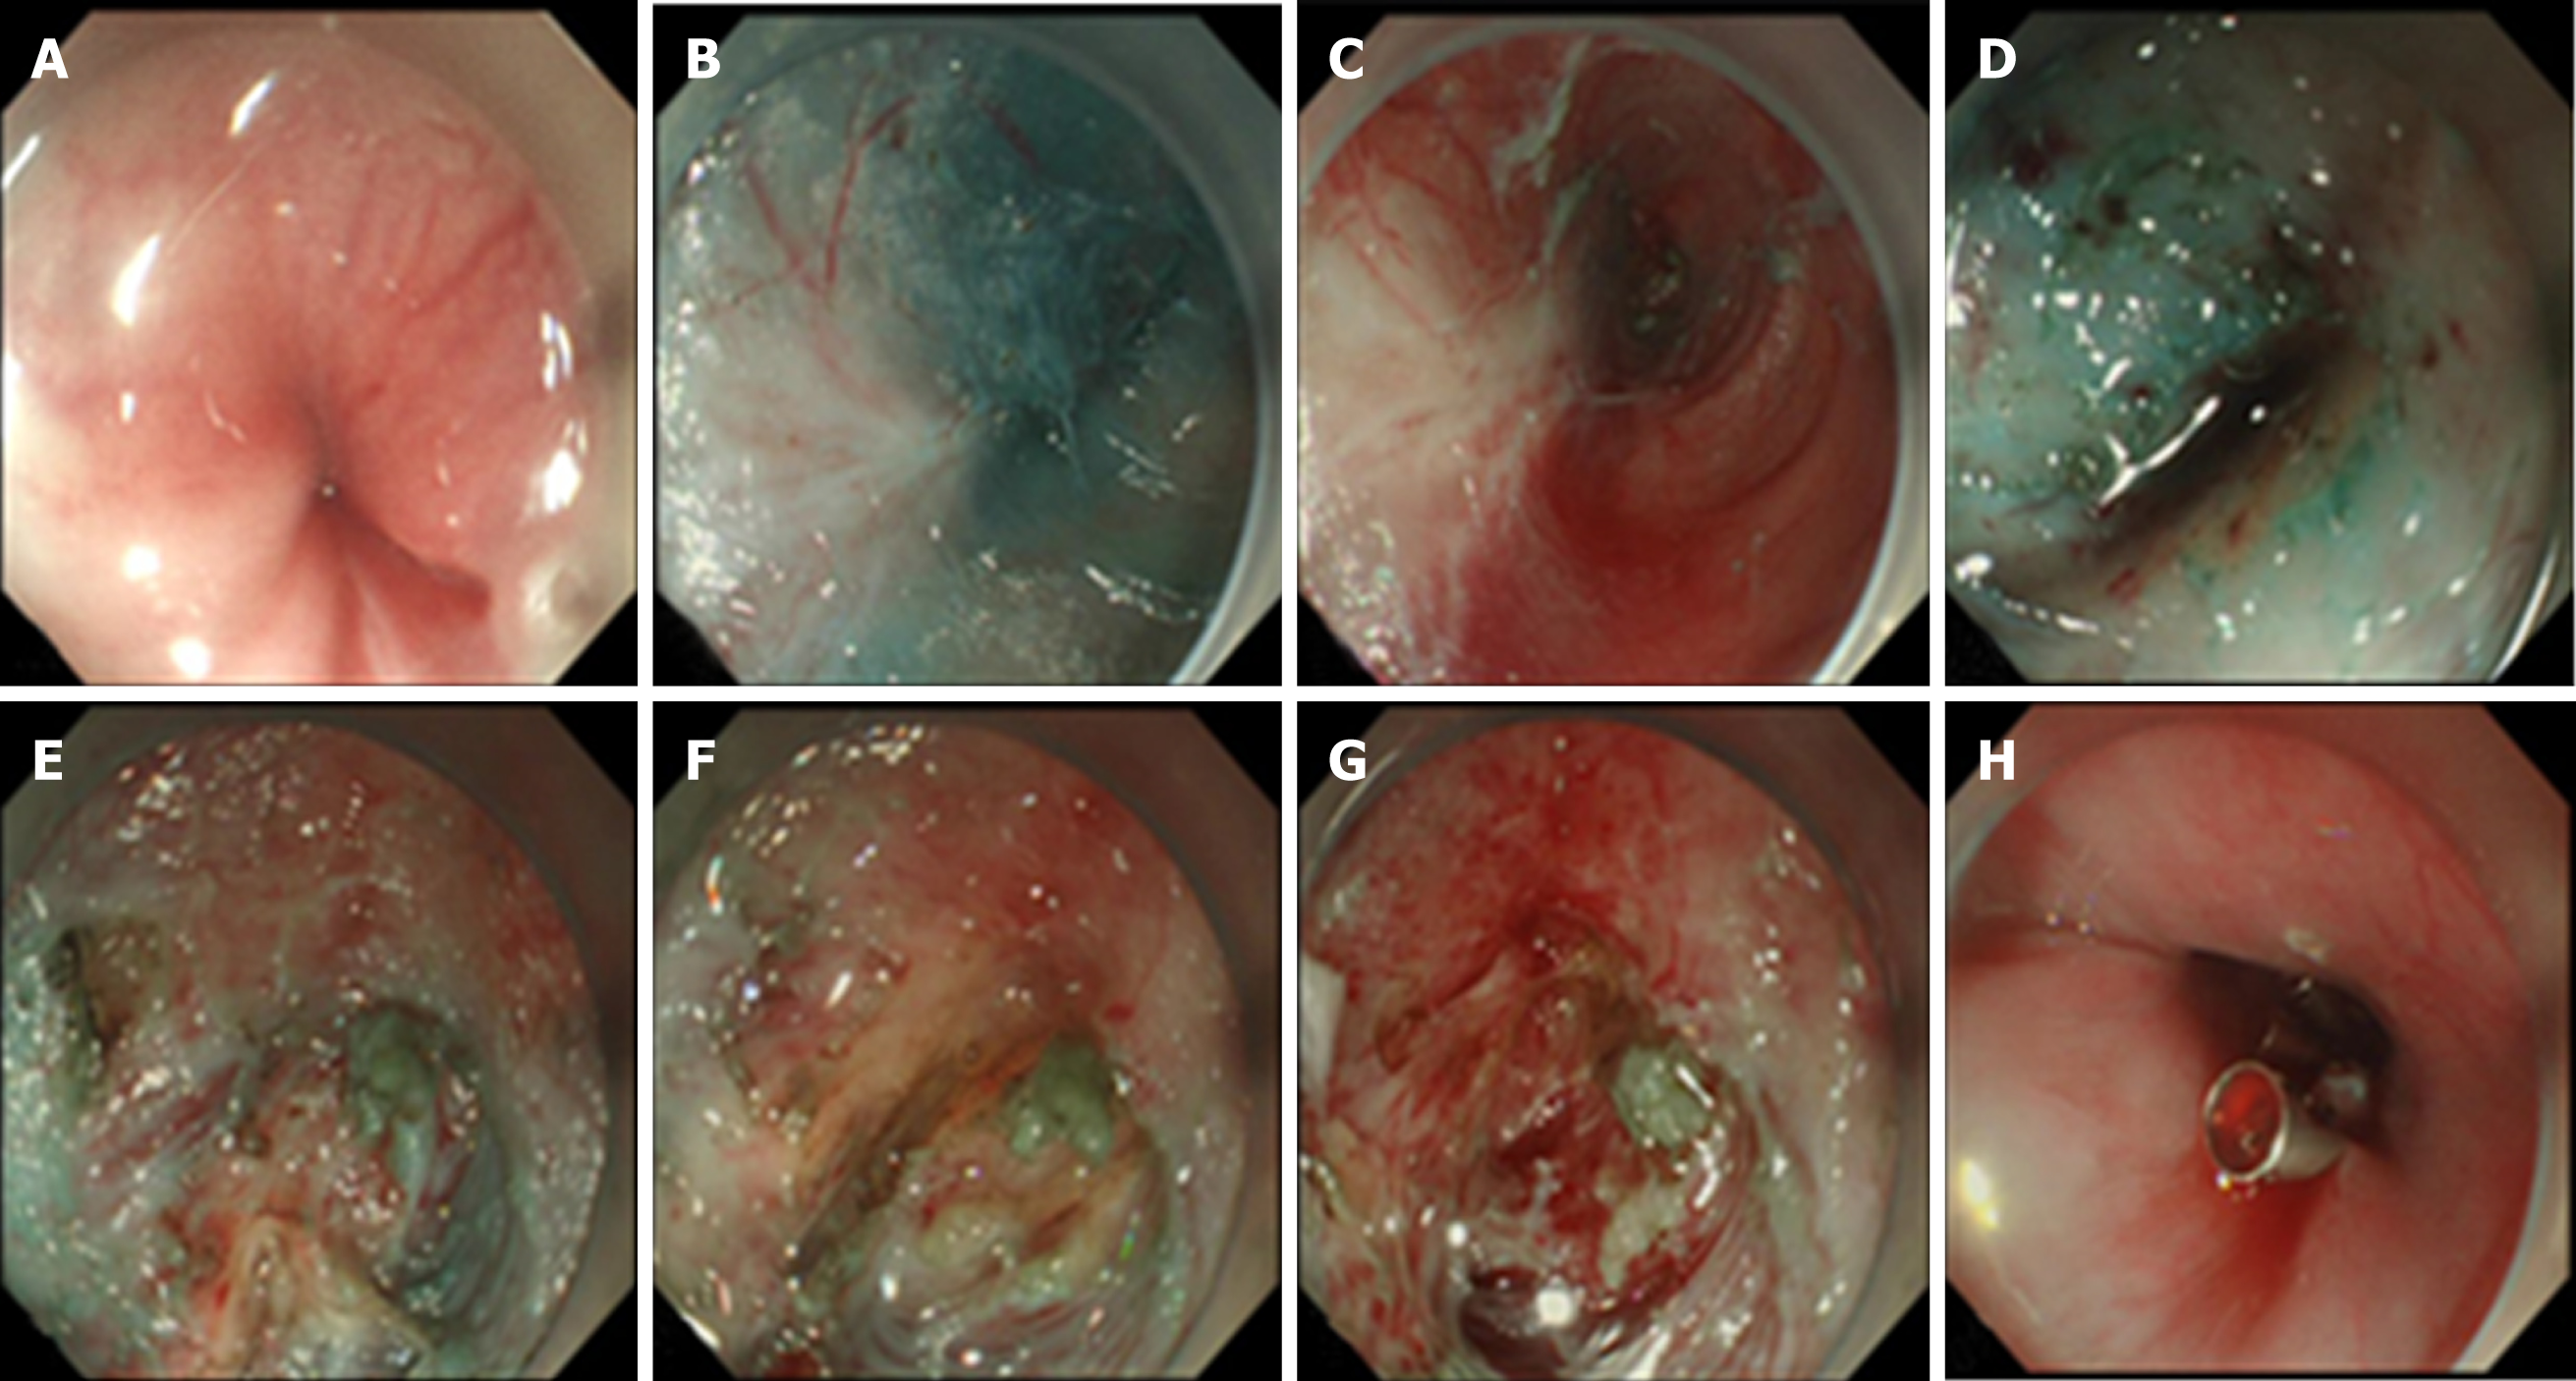
Figure 4 Case illustration of endoscopic biopsy through a tunnel.
A: The narrow place in the lower esophagus (37 cm from the incisors); B: The submucosal tunnel was established; C: White fibrotic adhesions can be seen in the tunnel; D: The submucous structure was disorganized; E and F: It was difficult to distinguish yellow tissue and white tissue from the muscular layer in the tunnel; G: Tissue biopsy in the tunnel; H: The mucosal entry incision was sealed with several clips.
Figure 5 Microscopic images.
In smooth muscle cells, abnormal glands, dense nuclei of glandular epithelial cells, irregular glandular cavities, and fibrous hyperplasia were seen (hematoxylin and eosin staining; A, B, and C, magnification × 40, × 100, and × 200, respectively).
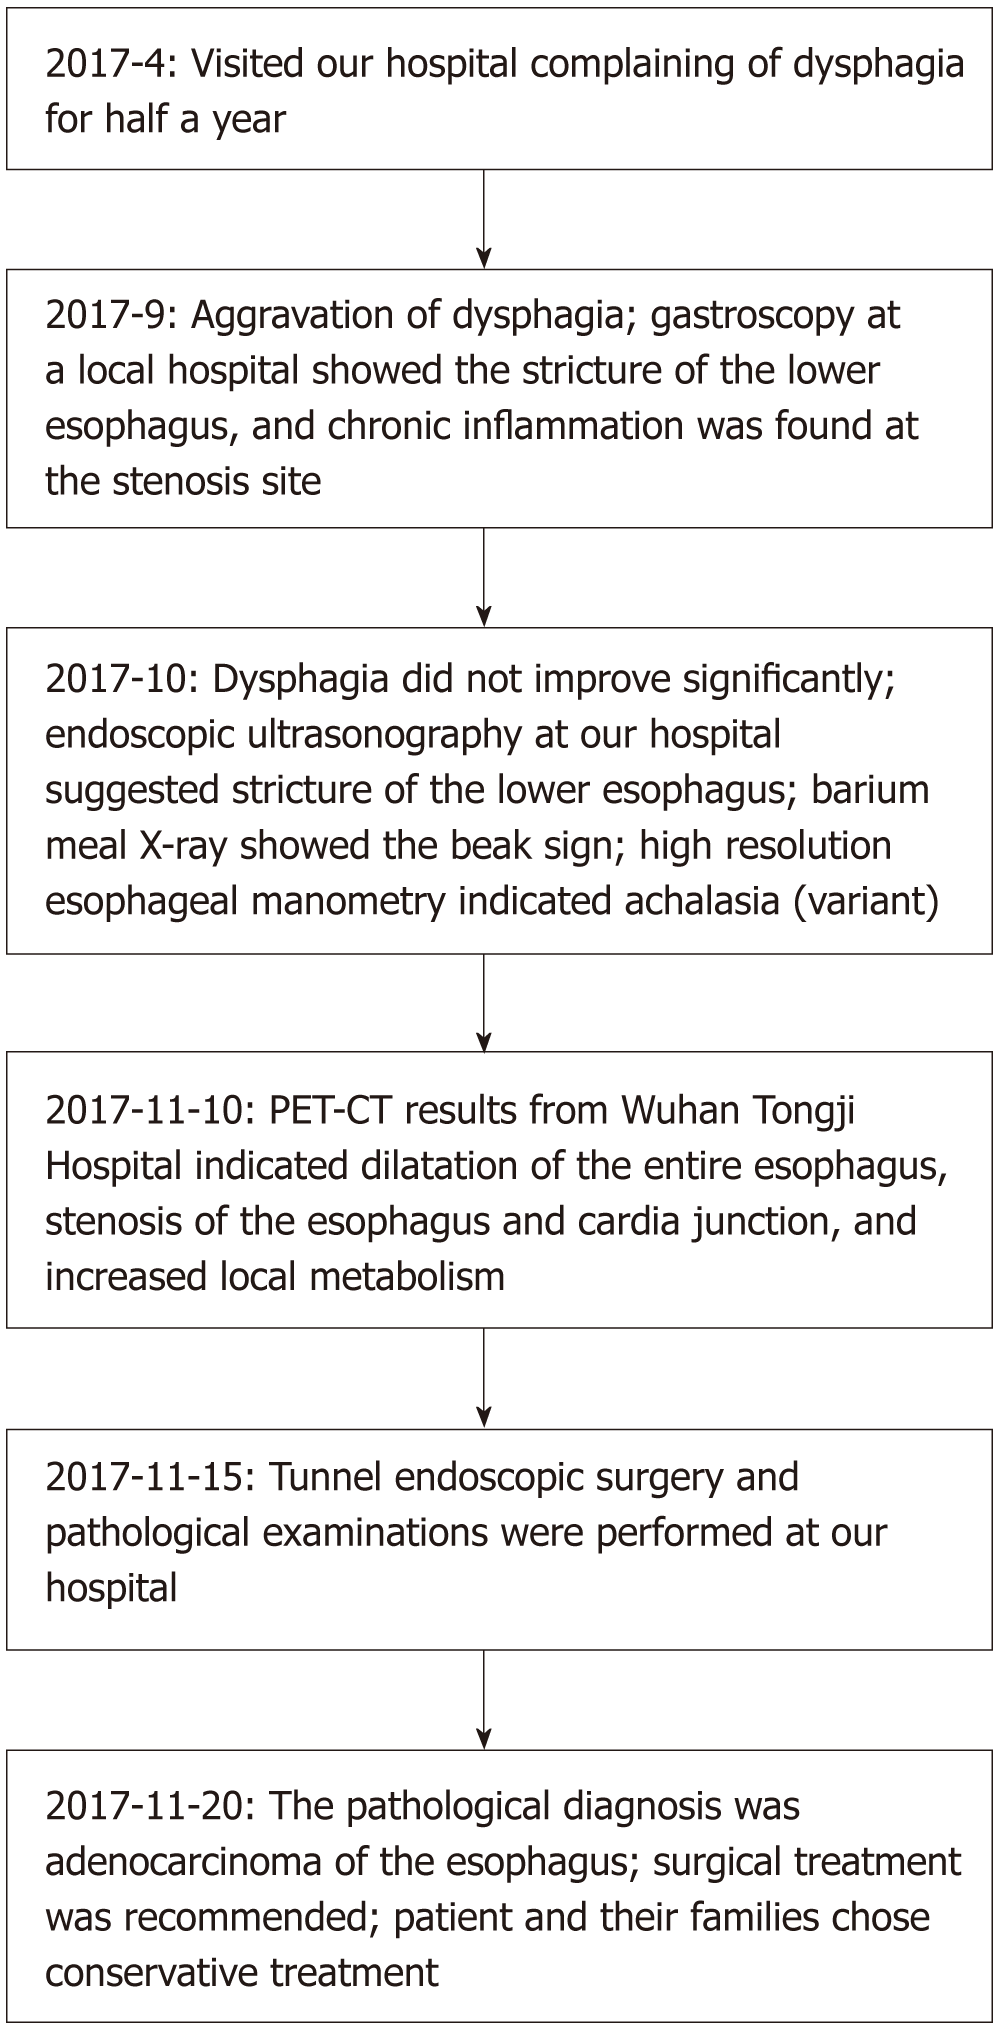
Figure 6 Information schedule.
PET-CT: Positron emission computed tomography.
- Citation: Liu S, Wang N, Yang J, Yang JY, Shi ZH. Use of tunnel endoscopy for diagnosis of obscure submucosal esophageal adenocarcinoma: A case report and review of the literature with emphasis on causes of esophageal stenosis. World J Clin Cases 2019; 7(5): 668-675
- URL: https://www.wjgnet.com/2307-8960/full/v7/i5/668.htm
- DOI: https://dx.doi.org/10.12998/wjcc.v7.i5.668


