Copyright
©The Author(s) 2019.
World J Clin Cases. Feb 6, 2019; 7(3): 270-290
Published online Feb 6, 2019. doi: 10.12998/wjcc.v7.i3.270
Published online Feb 6, 2019. doi: 10.12998/wjcc.v7.i3.270
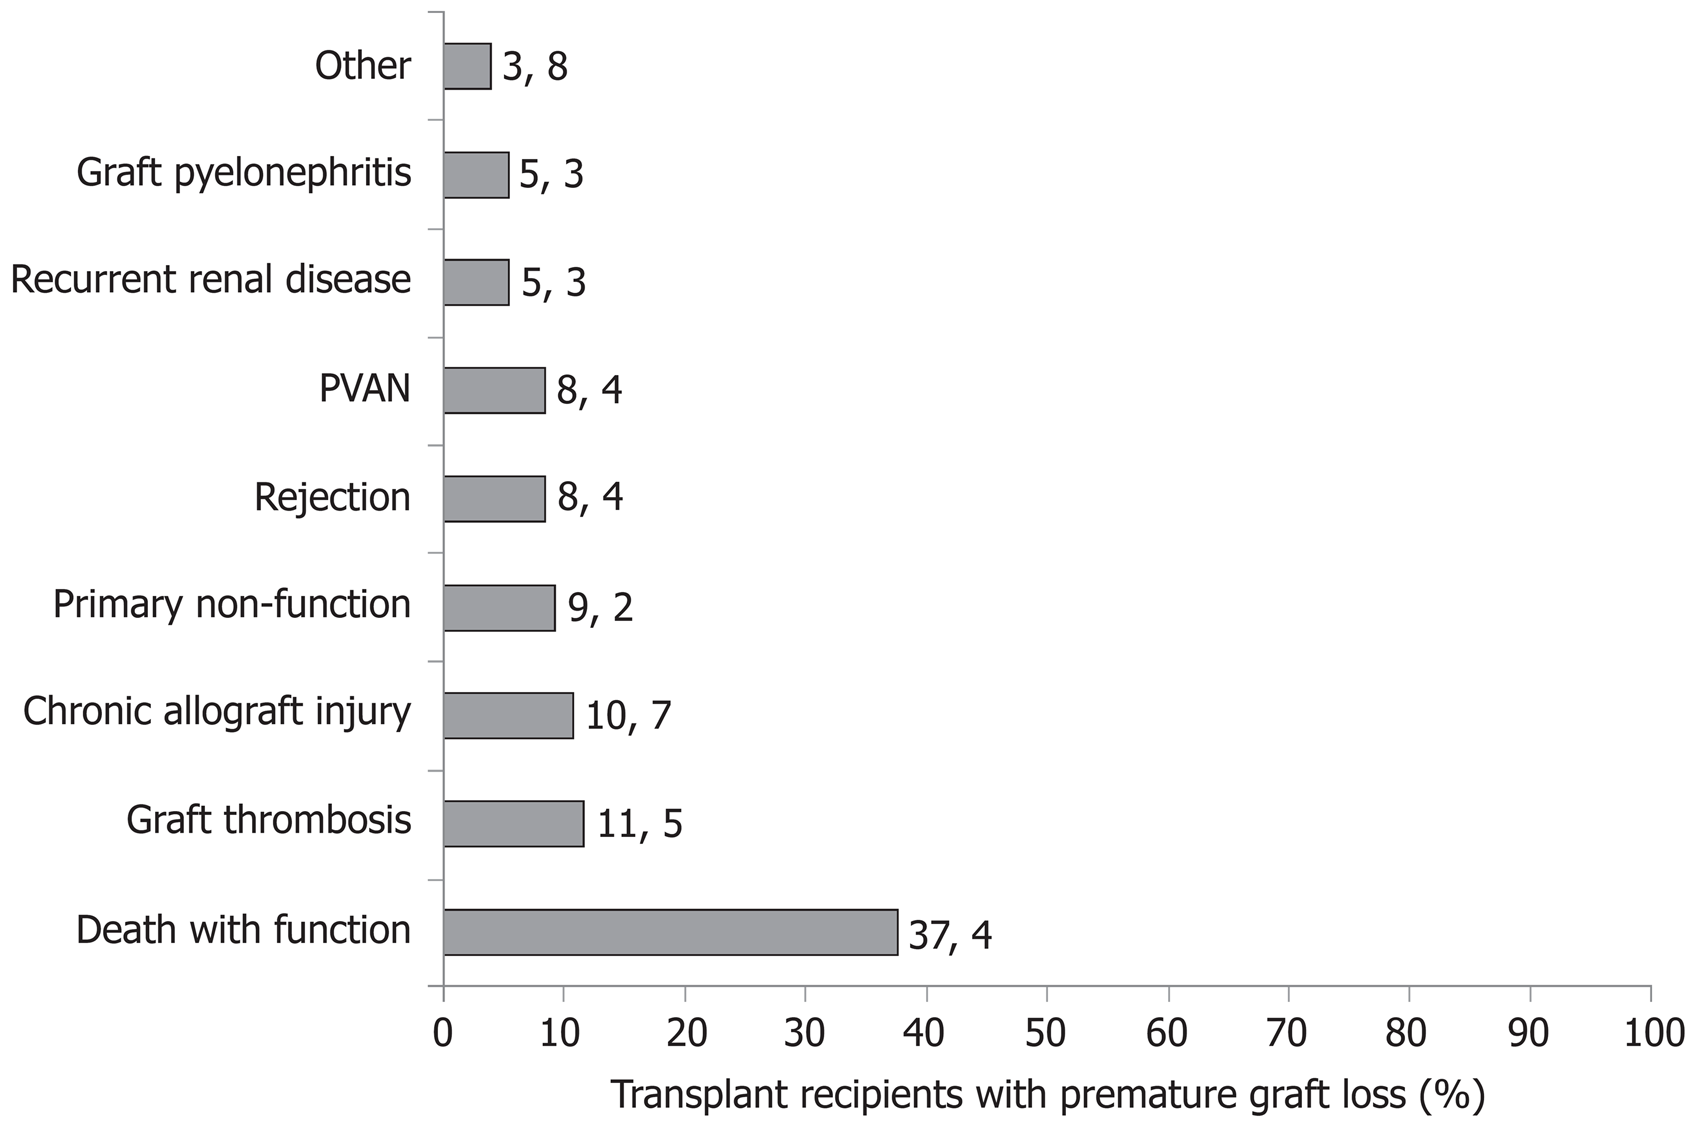
Figure 1 Distribution of specific causes of kidney allograft loss in the study population.
PVAN: Polyomavirus-associated nephropathy.
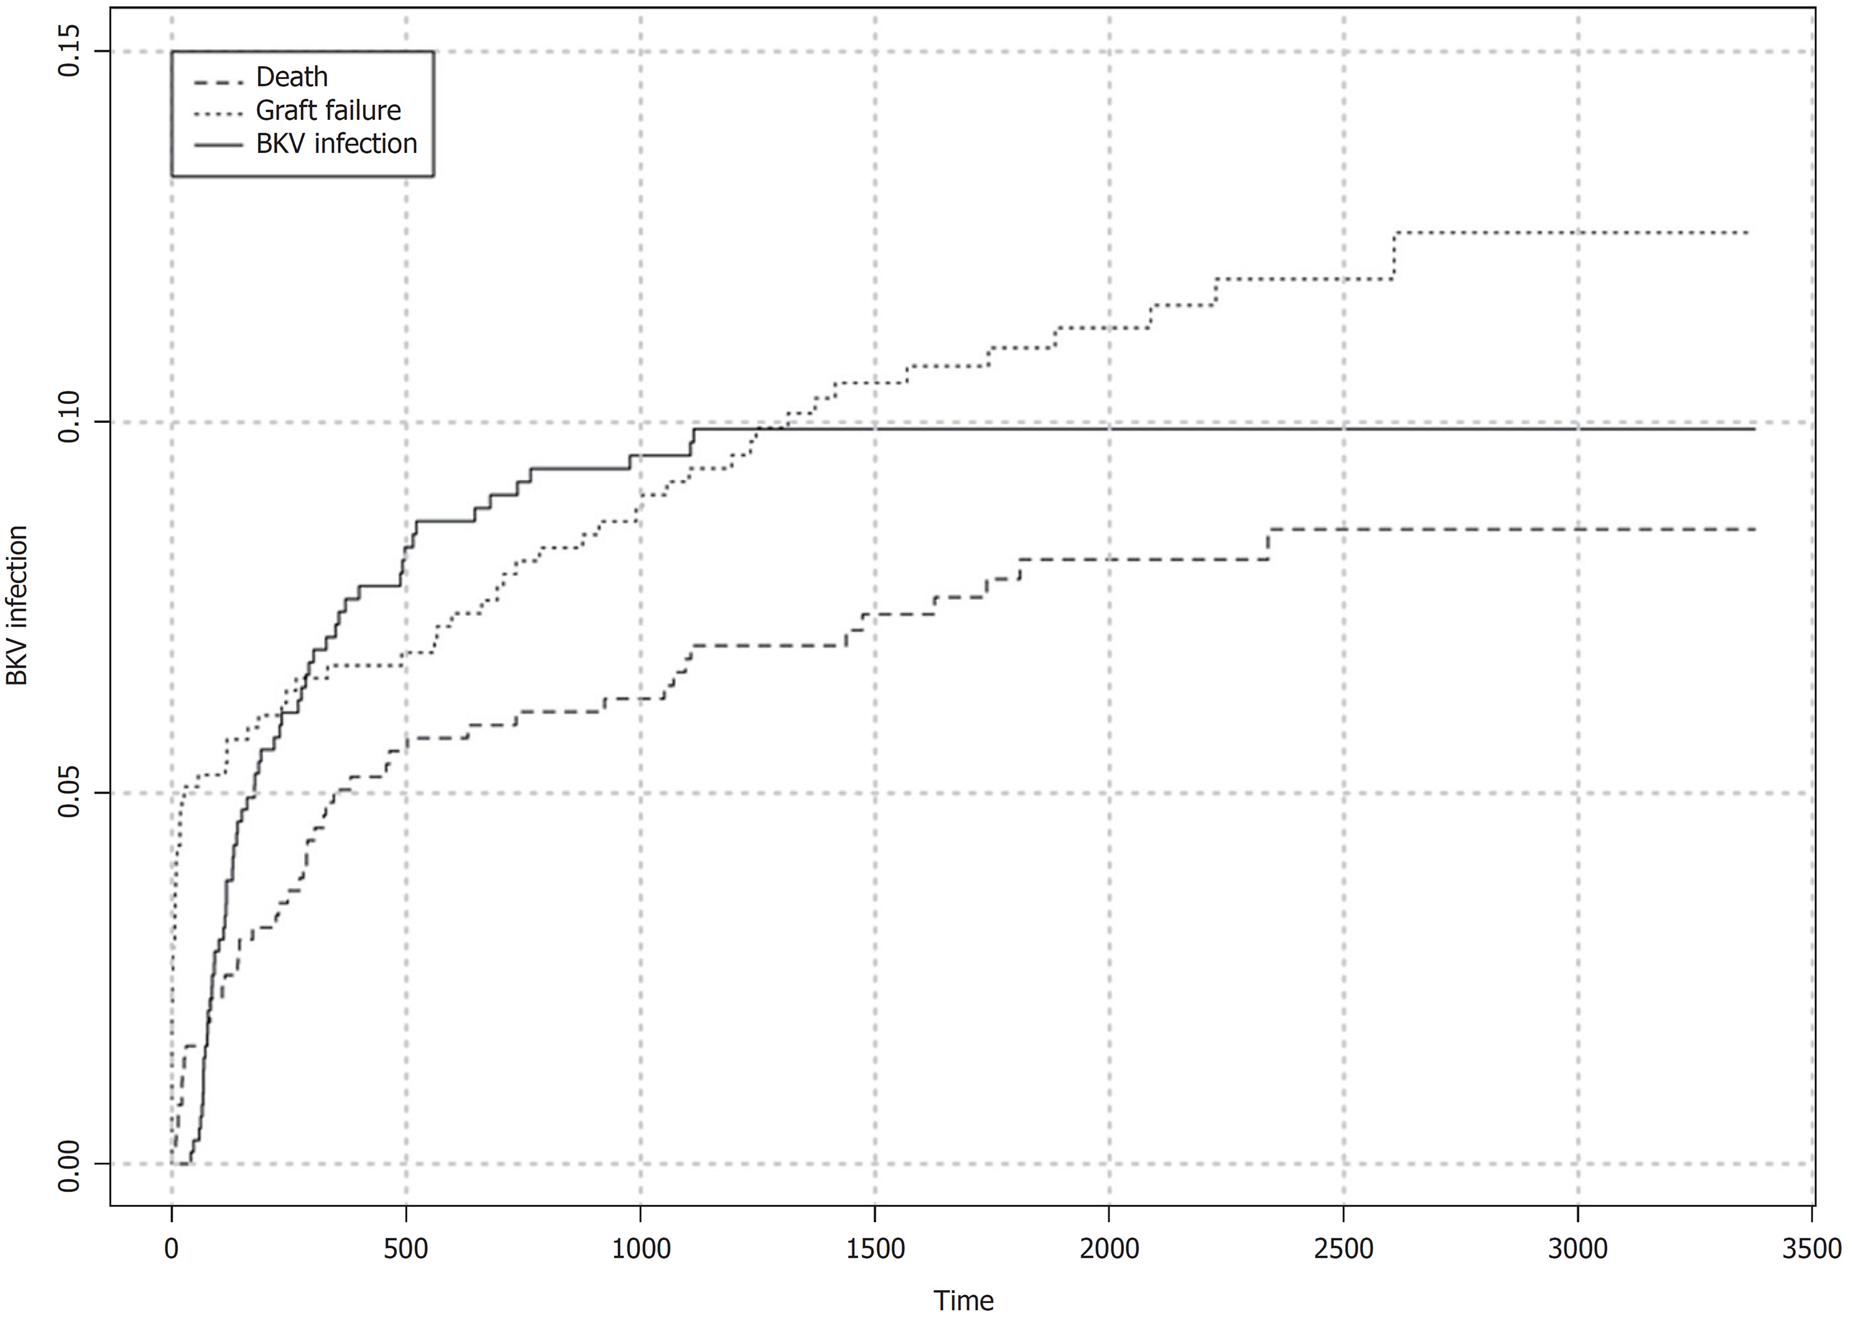
Figure 2 Crude cumulative incidence of BK-viremia in the study cohort considering death and graft failure as competing events.
BKV: BK-viremia.
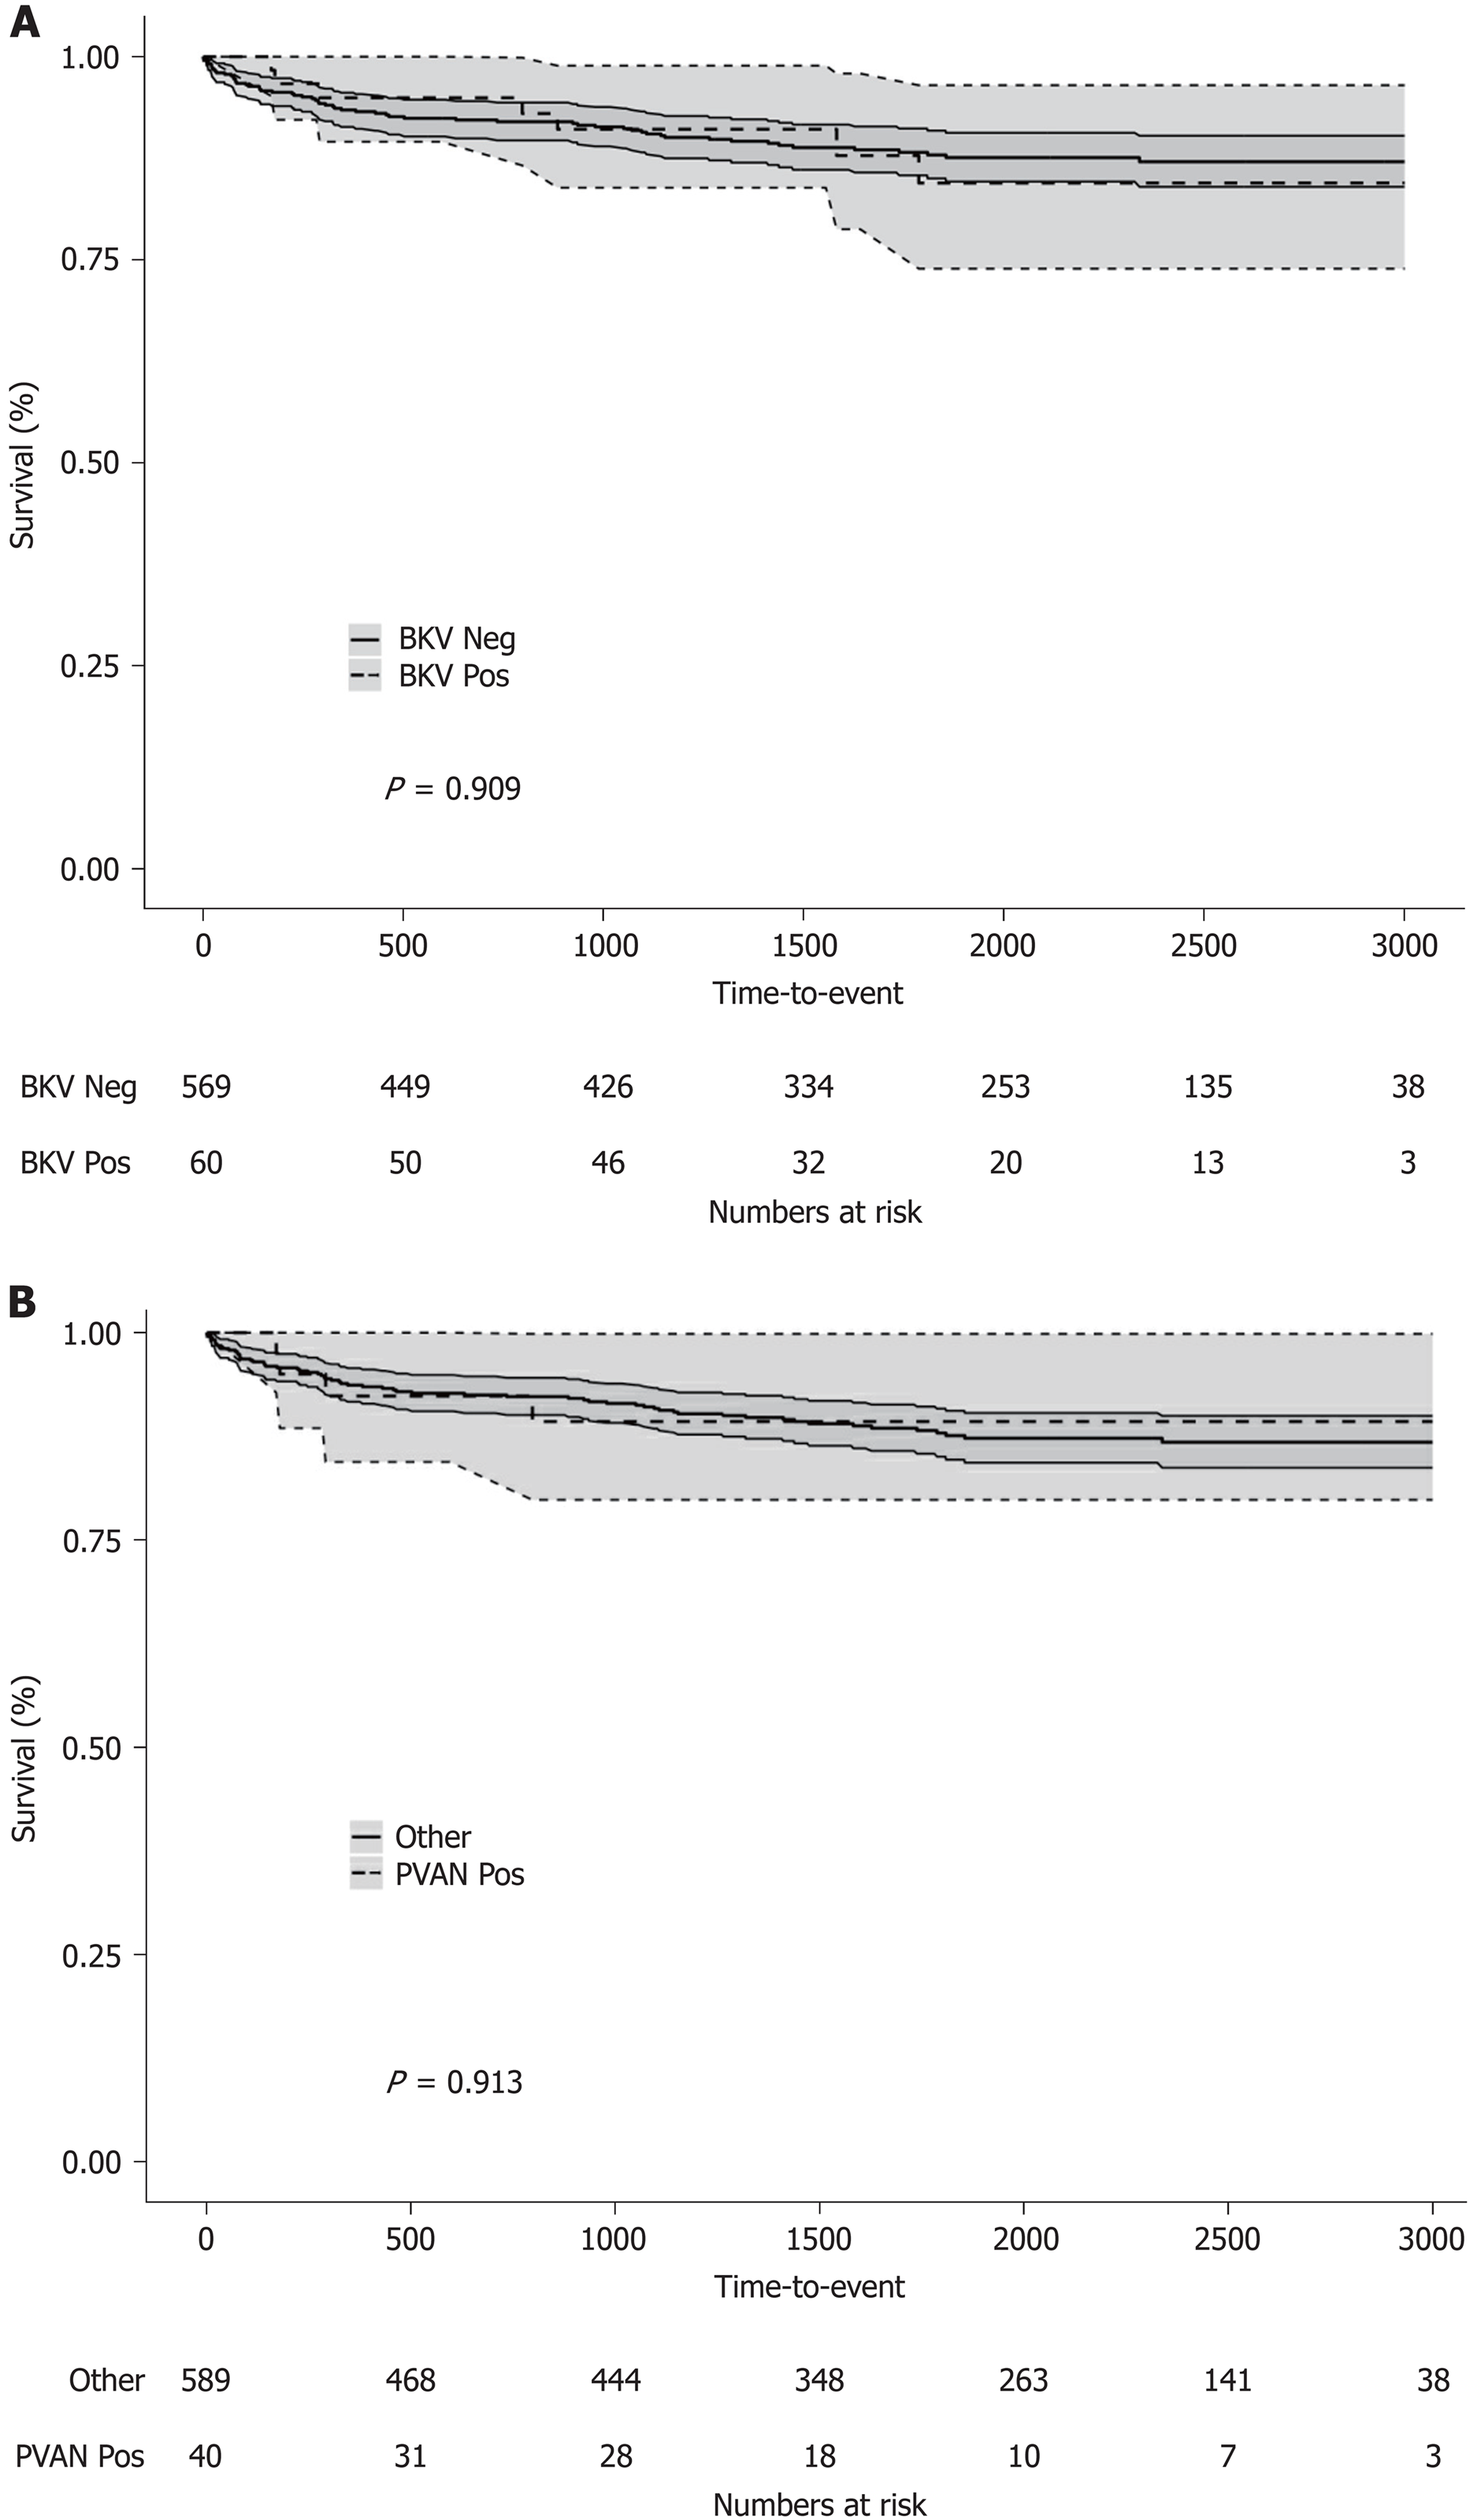
Figure 3 Kaplan-Meier patient survival curves.
A: kidney transplant recipients with (dashed line) or without (continuous line) BK-viremia; B: kidney transplant recipients with (dashed line) or without (continuous line) polyomavirus-associated nephropathy. BKV: BK-viremia; PVAN: Polyomavirus-associated nephropathy.
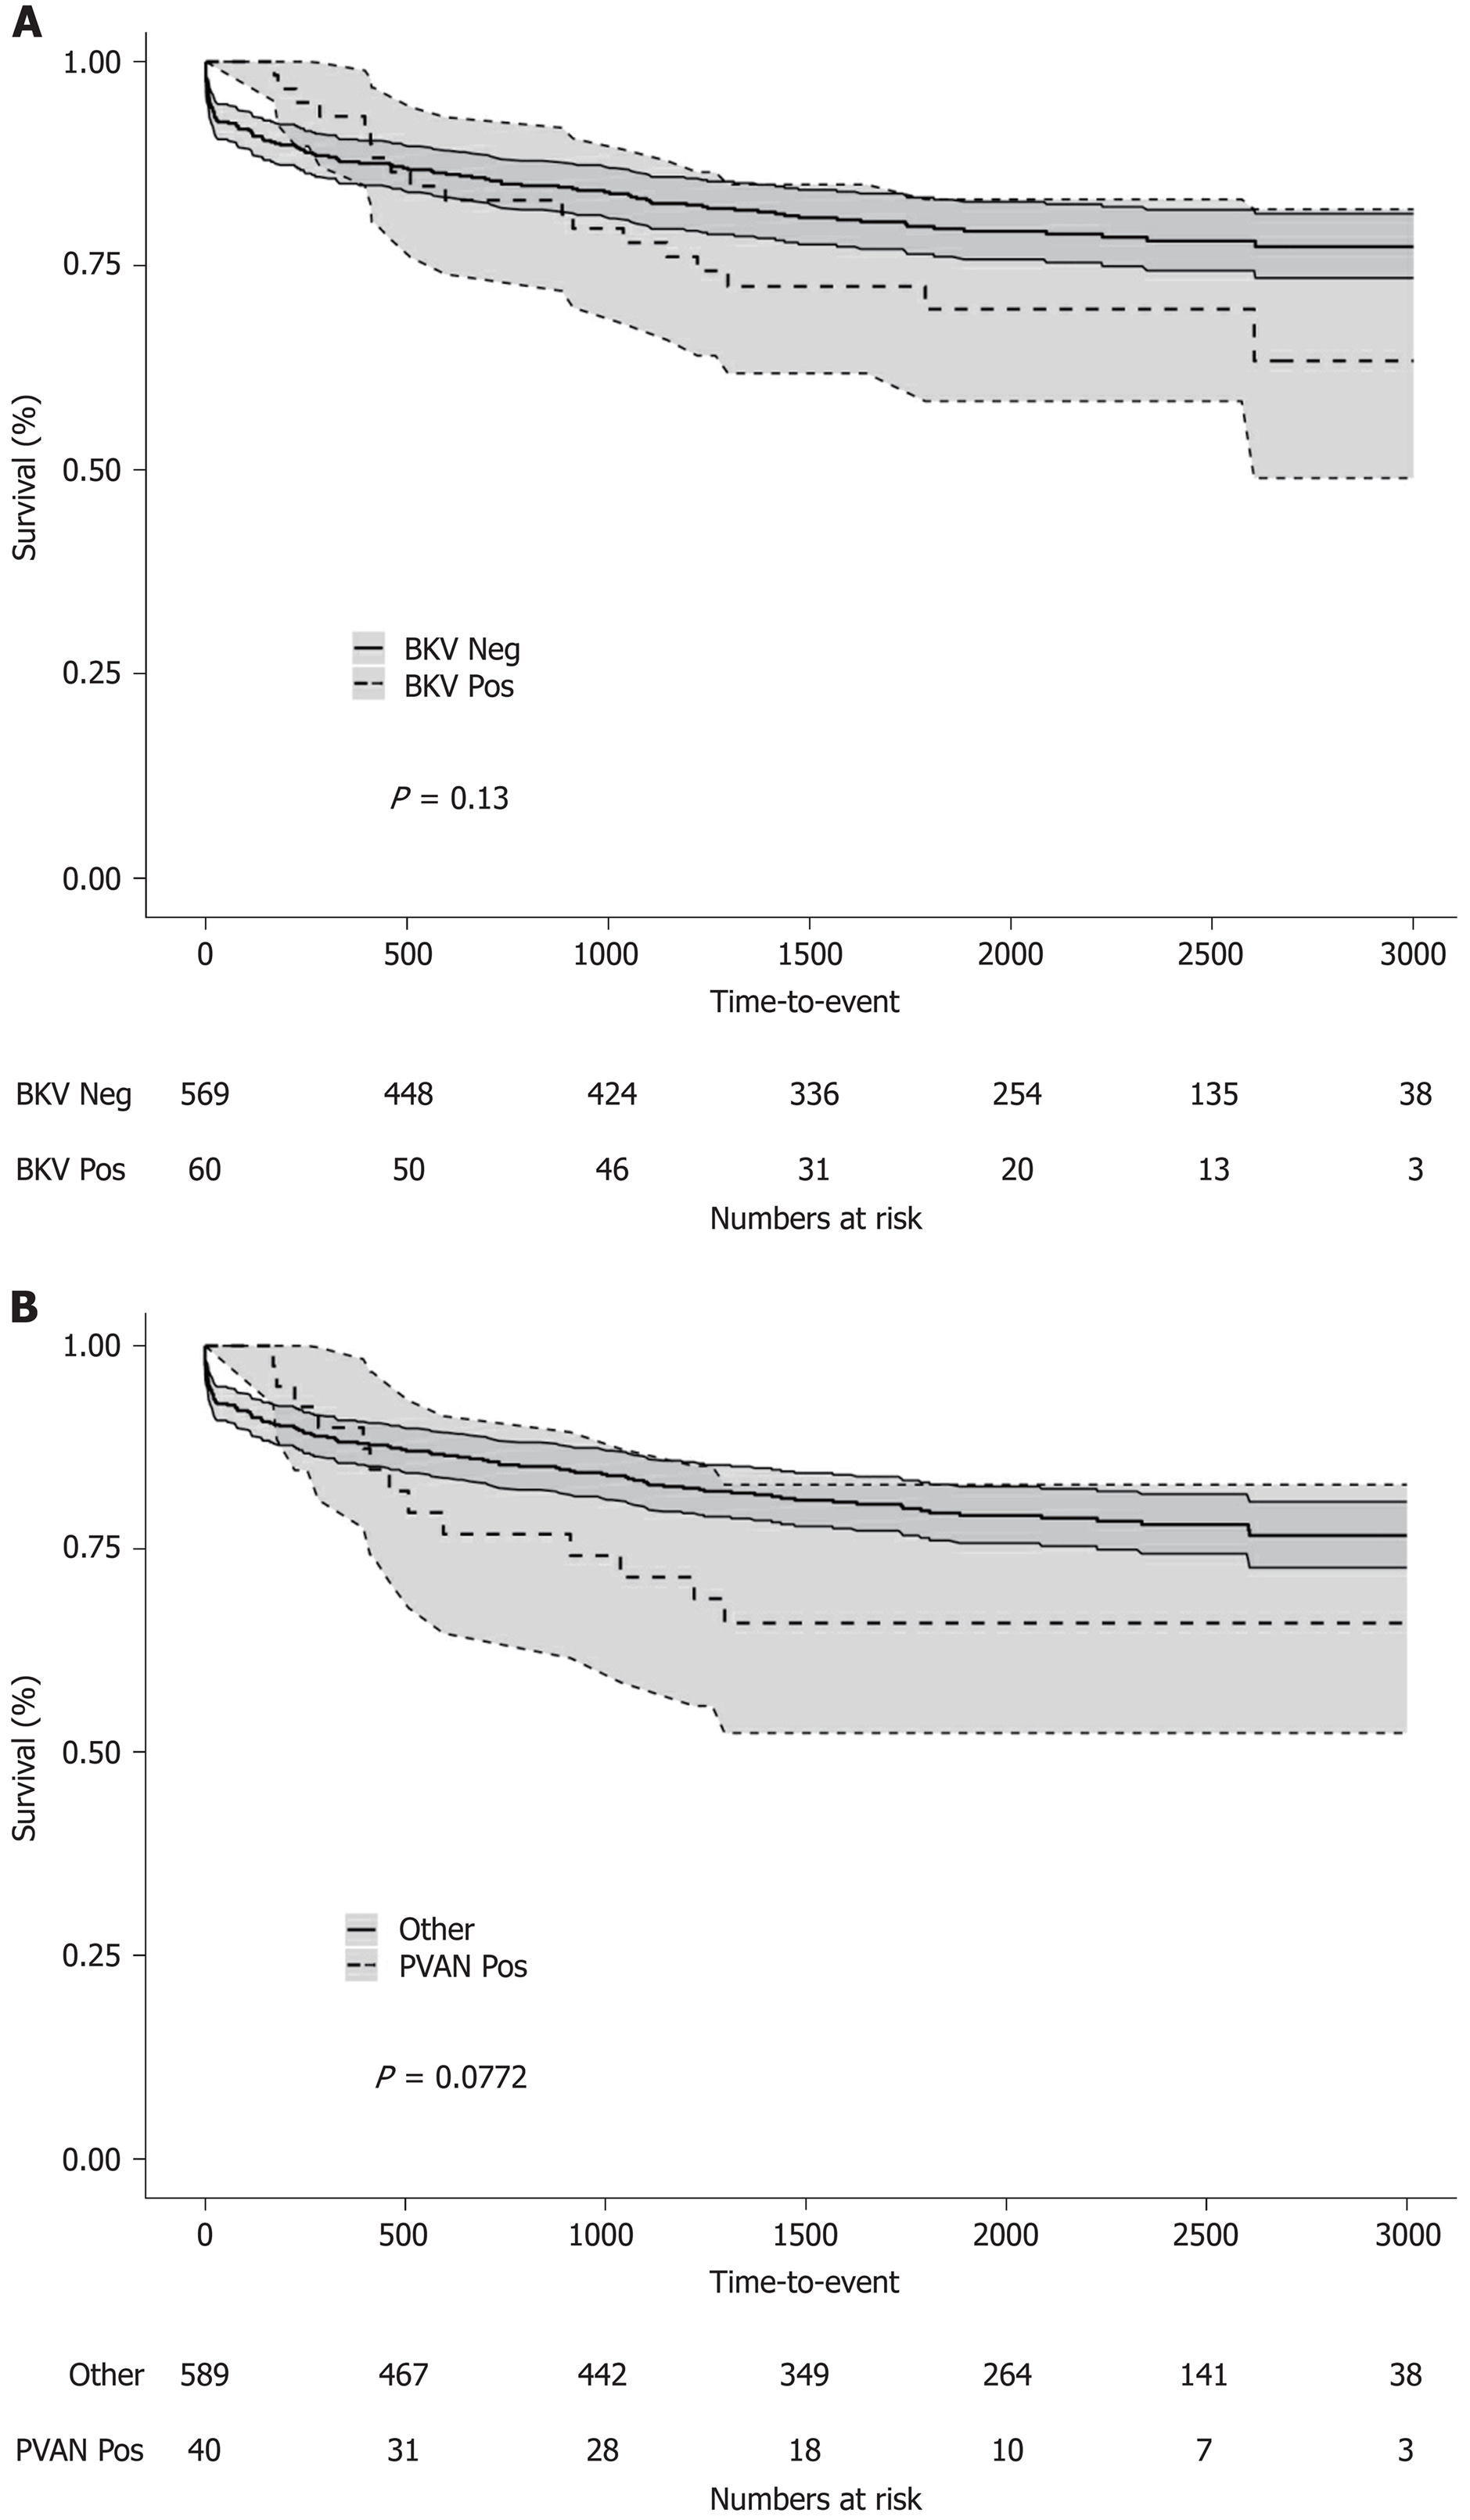
Figure 4 Kaplan-Meier overall graft survival curves.
A: kidney transplant recipients with (dashed line) or without (continuous line) BK-viremia; B: kidney transplant recipients with (dashed line) or without (continuous line) Polyomavirus-associated nephropathy. BKV: BK-viremia; PVAN: Polyomavirus-associated nephropathy.
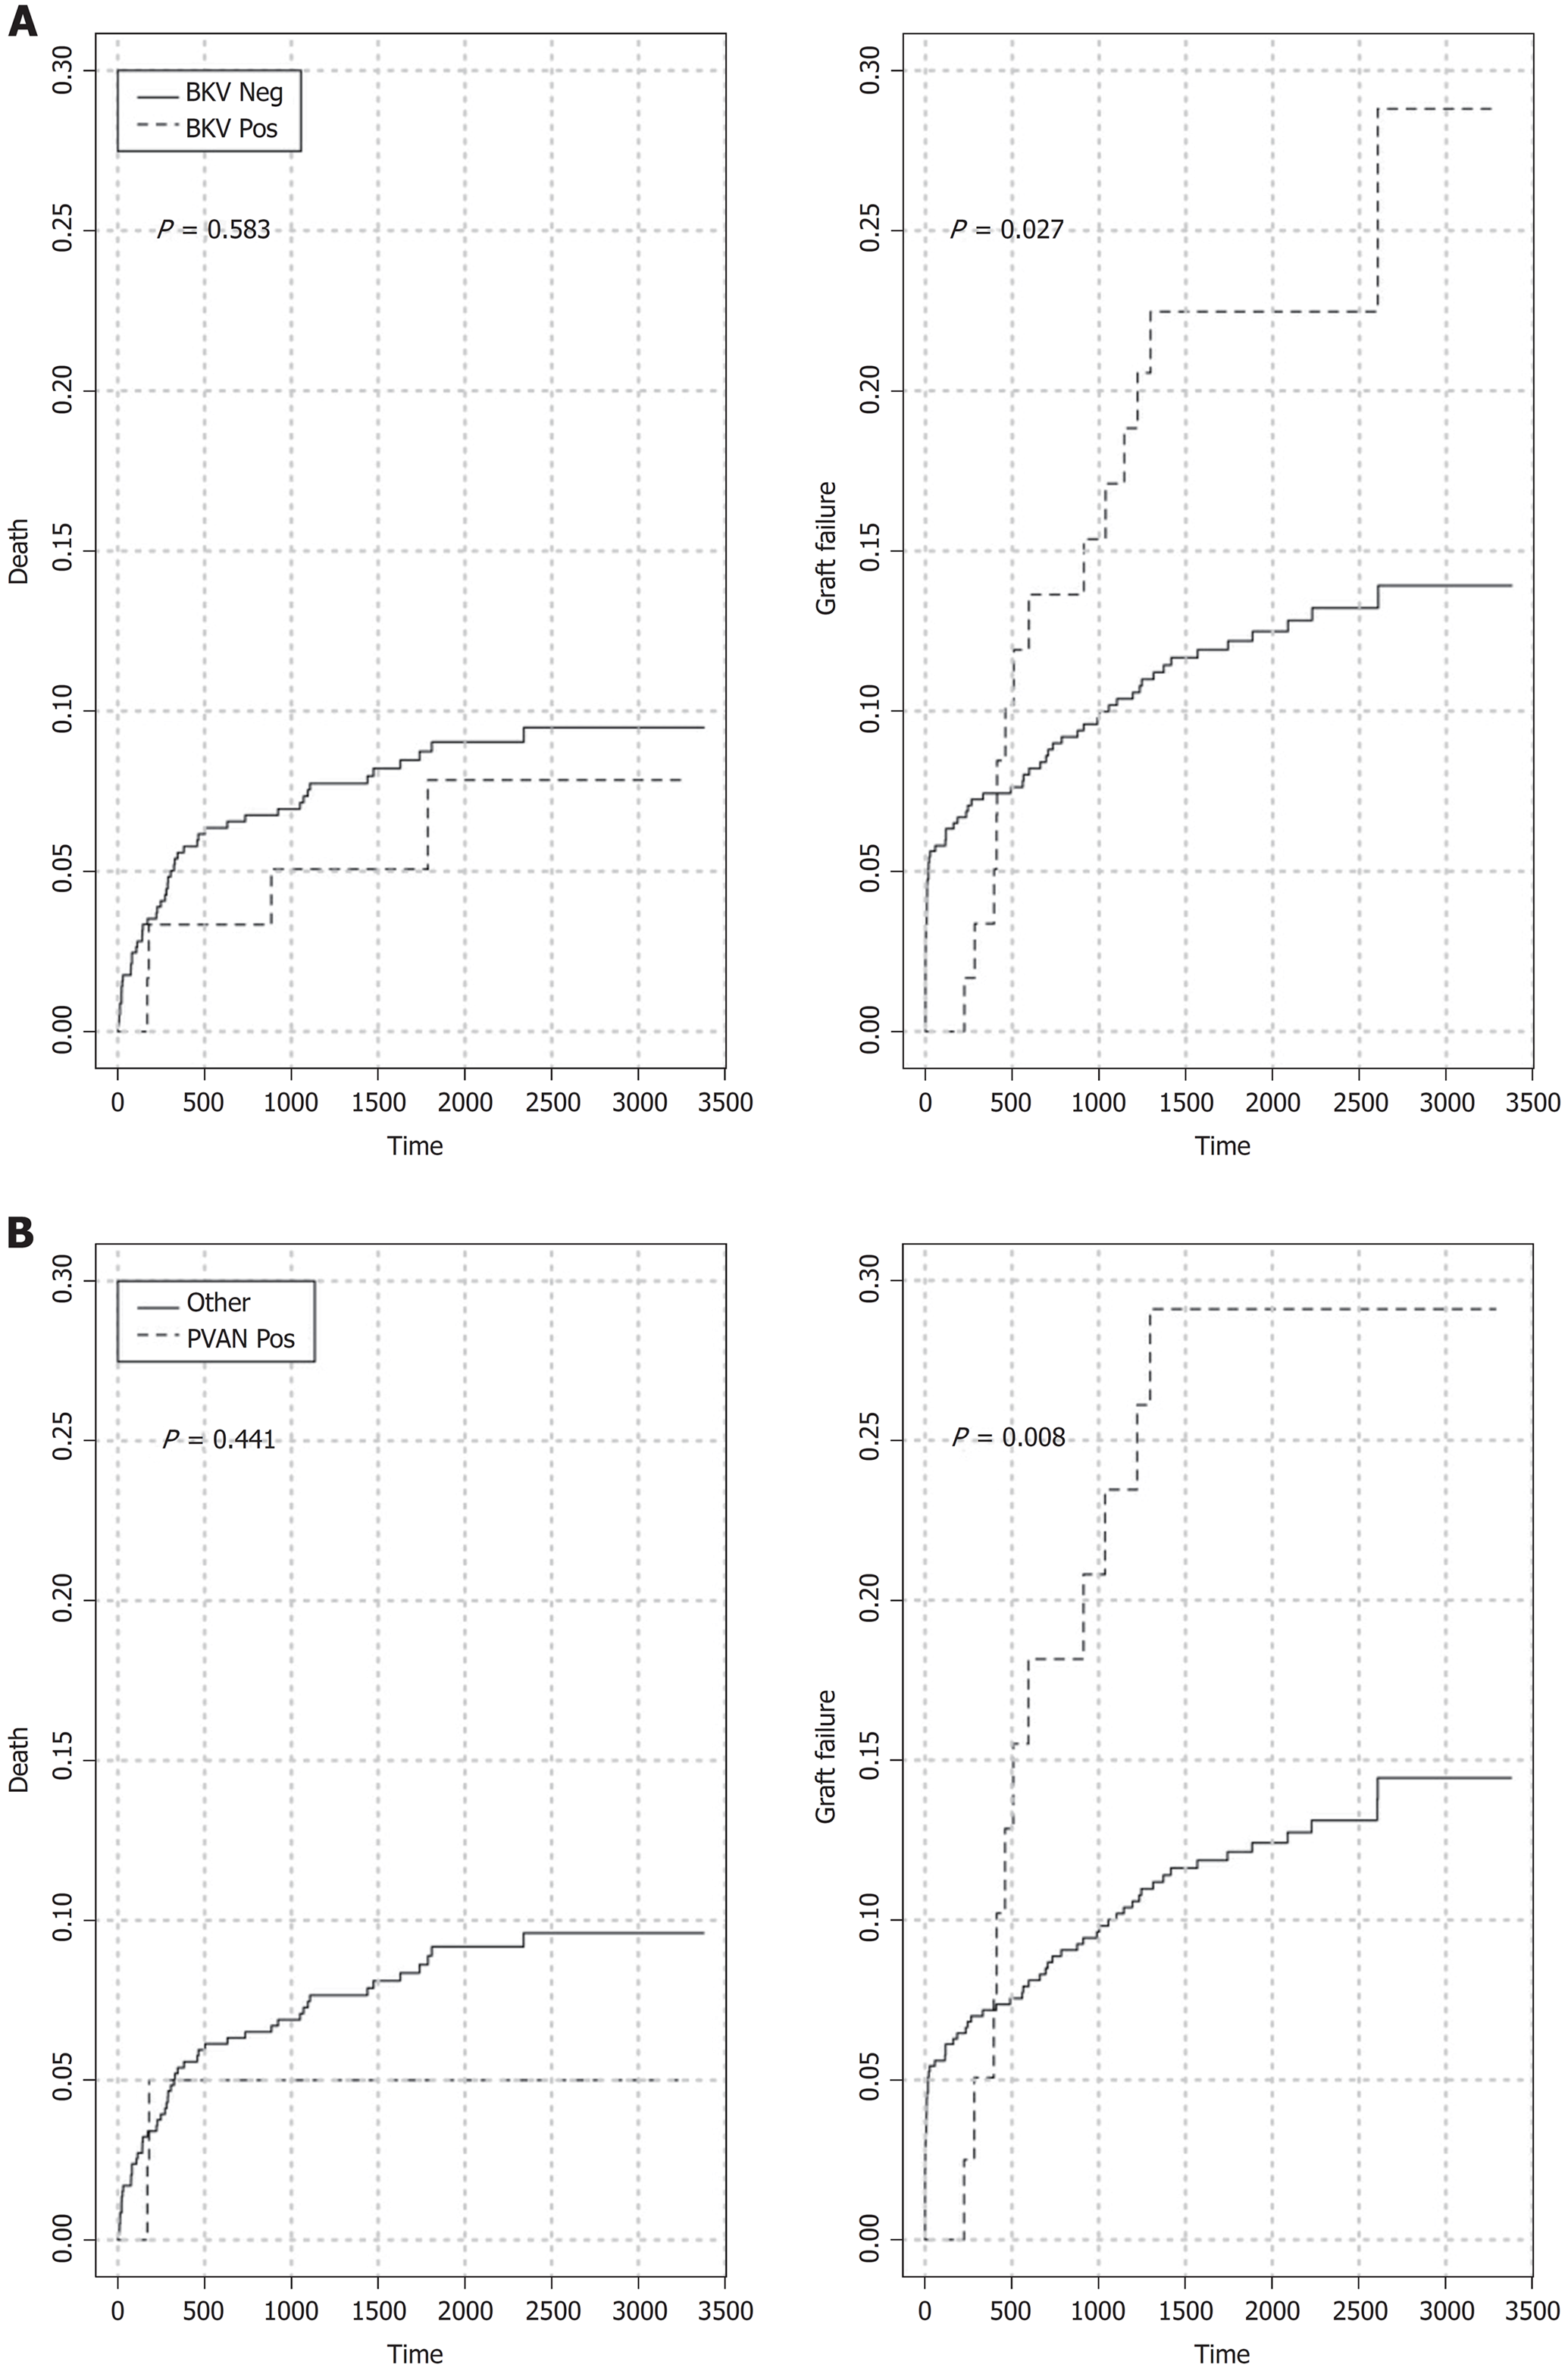
Figure 5 Crude cumulative incidence of graft failure considering death as a competing risk.
A: kidney transplant recipients with (dashed line) or without (continuous line) BK-viremia; B: kidney transplant recipients with (dashed line) or without (continuous line) Polyomavirus-associated nephropathy. BKV: BK-viremia; PVAN: Polyomavirus-associated nephropathy.
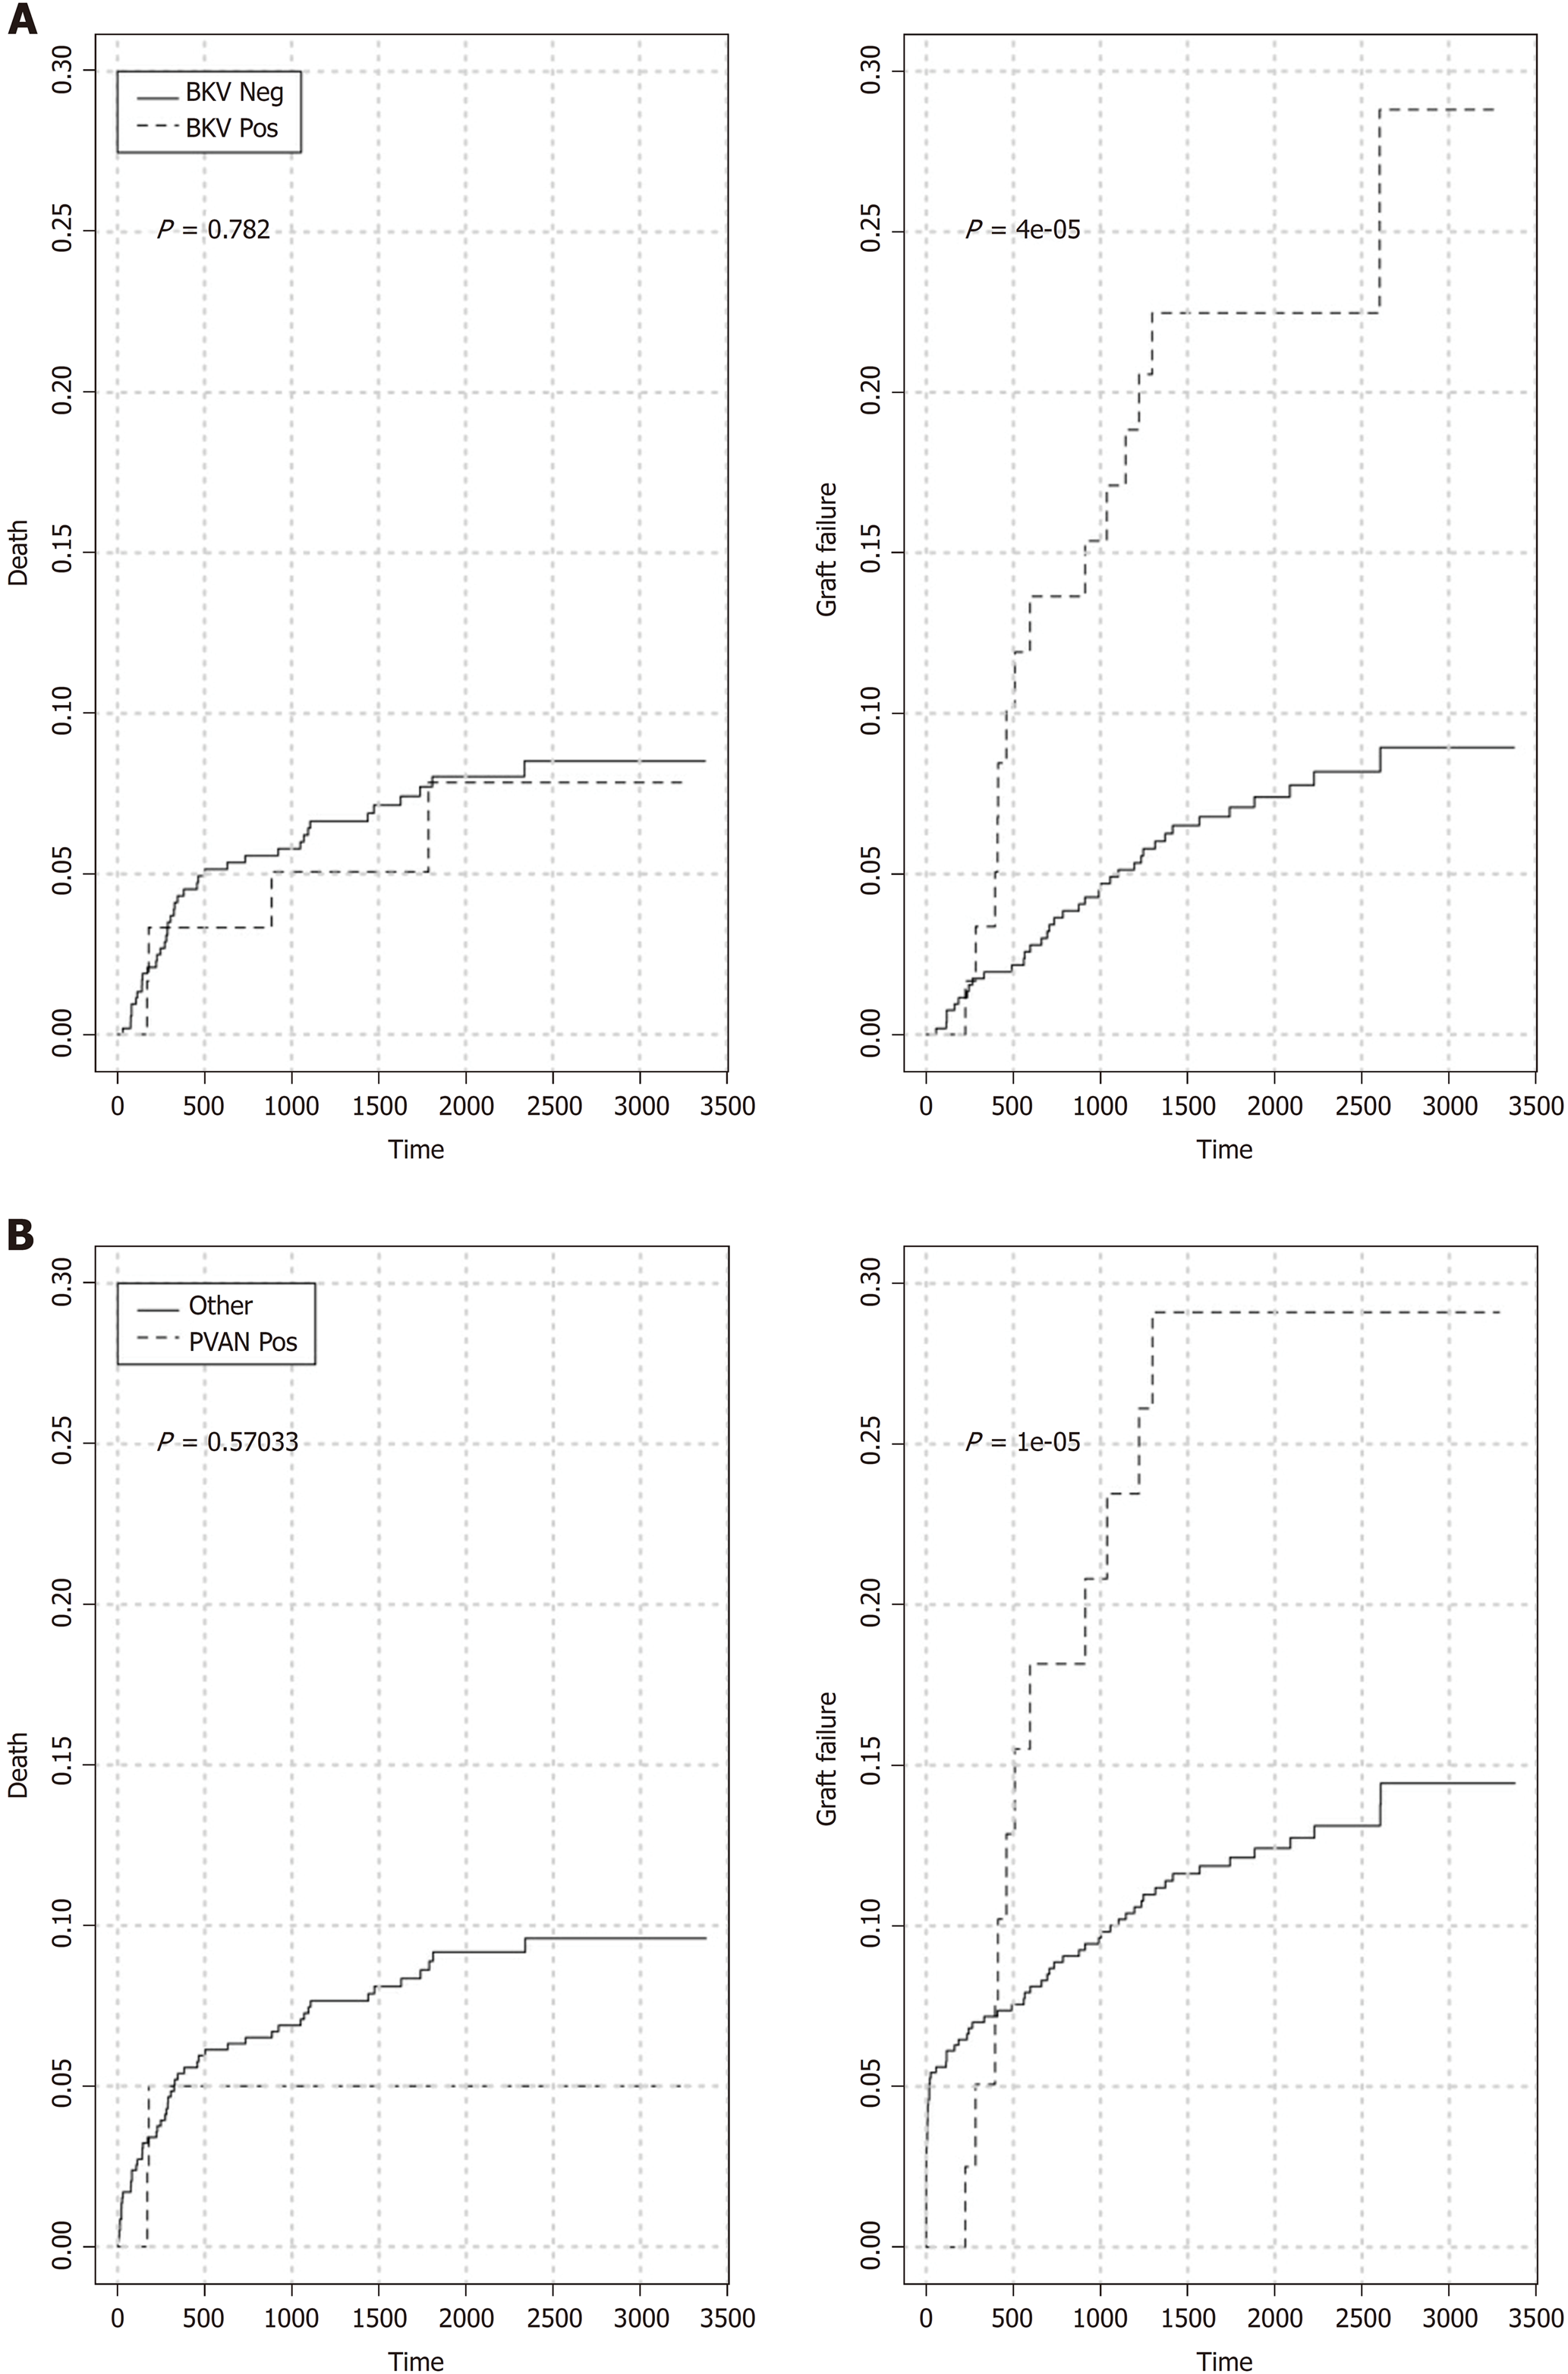
Figure 6 Crude cumulative incidence of graft failure considering death as a competing risk and excluding any events within thirty days of transplant.
A: kidney transplant recipients with (dashed line) or without (continuous line) BK-viremia; B: kidney transplant recipients with (dashed line) or without (continuous line) Polyomavirus-associated nephropathy. BKV: BK-viremia; PVAN: Polyomavirus-associated nephropathy.
- Citation: Favi E, Puliatti C, Sivaprakasam R, Ferraresso M, Ambrogi F, Delbue S, Gervasi F, Salzillo I, Raison N, Cacciola R. Incidence, risk factors, and outcome of BK polyomavirus infection after kidney transplantation. World J Clin Cases 2019; 7(3): 270-290
- URL: https://www.wjgnet.com/2307-8960/full/v7/i3/270.htm
- DOI: https://dx.doi.org/10.12998/wjcc.v7.i3.270


