Copyright
©The Author(s) 2019.
World J Clin Cases. Sep 26, 2019; 7(18): 2888-2893
Published online Sep 26, 2019. doi: 10.12998/wjcc.v7.i18.2888
Published online Sep 26, 2019. doi: 10.12998/wjcc.v7.i18.2888
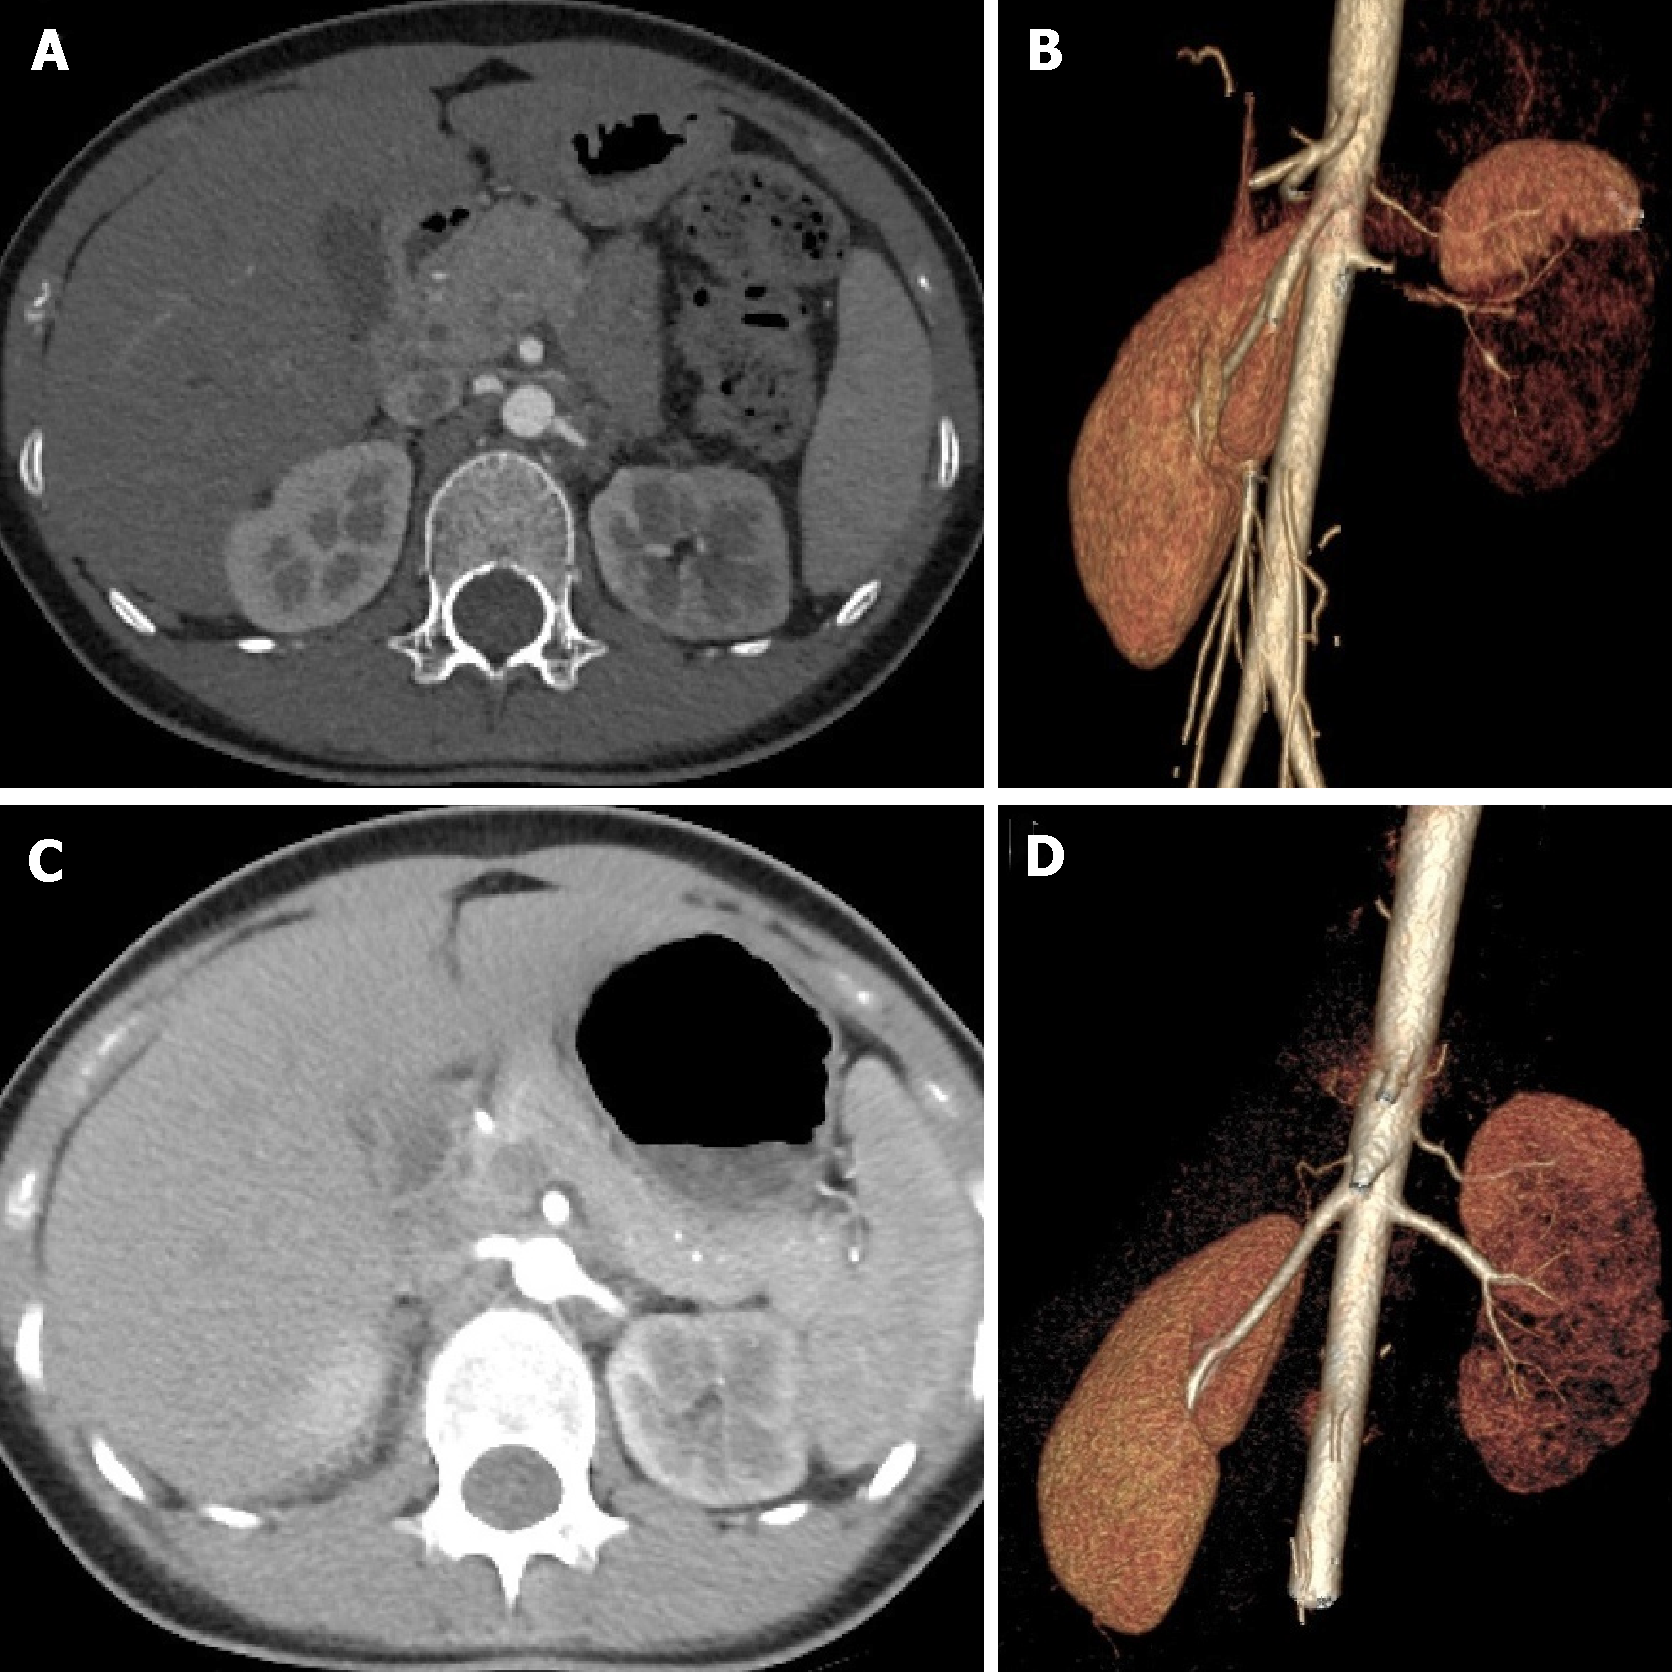
Figure 1 Computed tomography angiography before and after the procedure.
A and B: Computed tomography angiography of the aorta showed the severe stenosis at the origin of the left renal artery; C and D: The left renal artery was patent after percutaneous transluminal angioplasty.
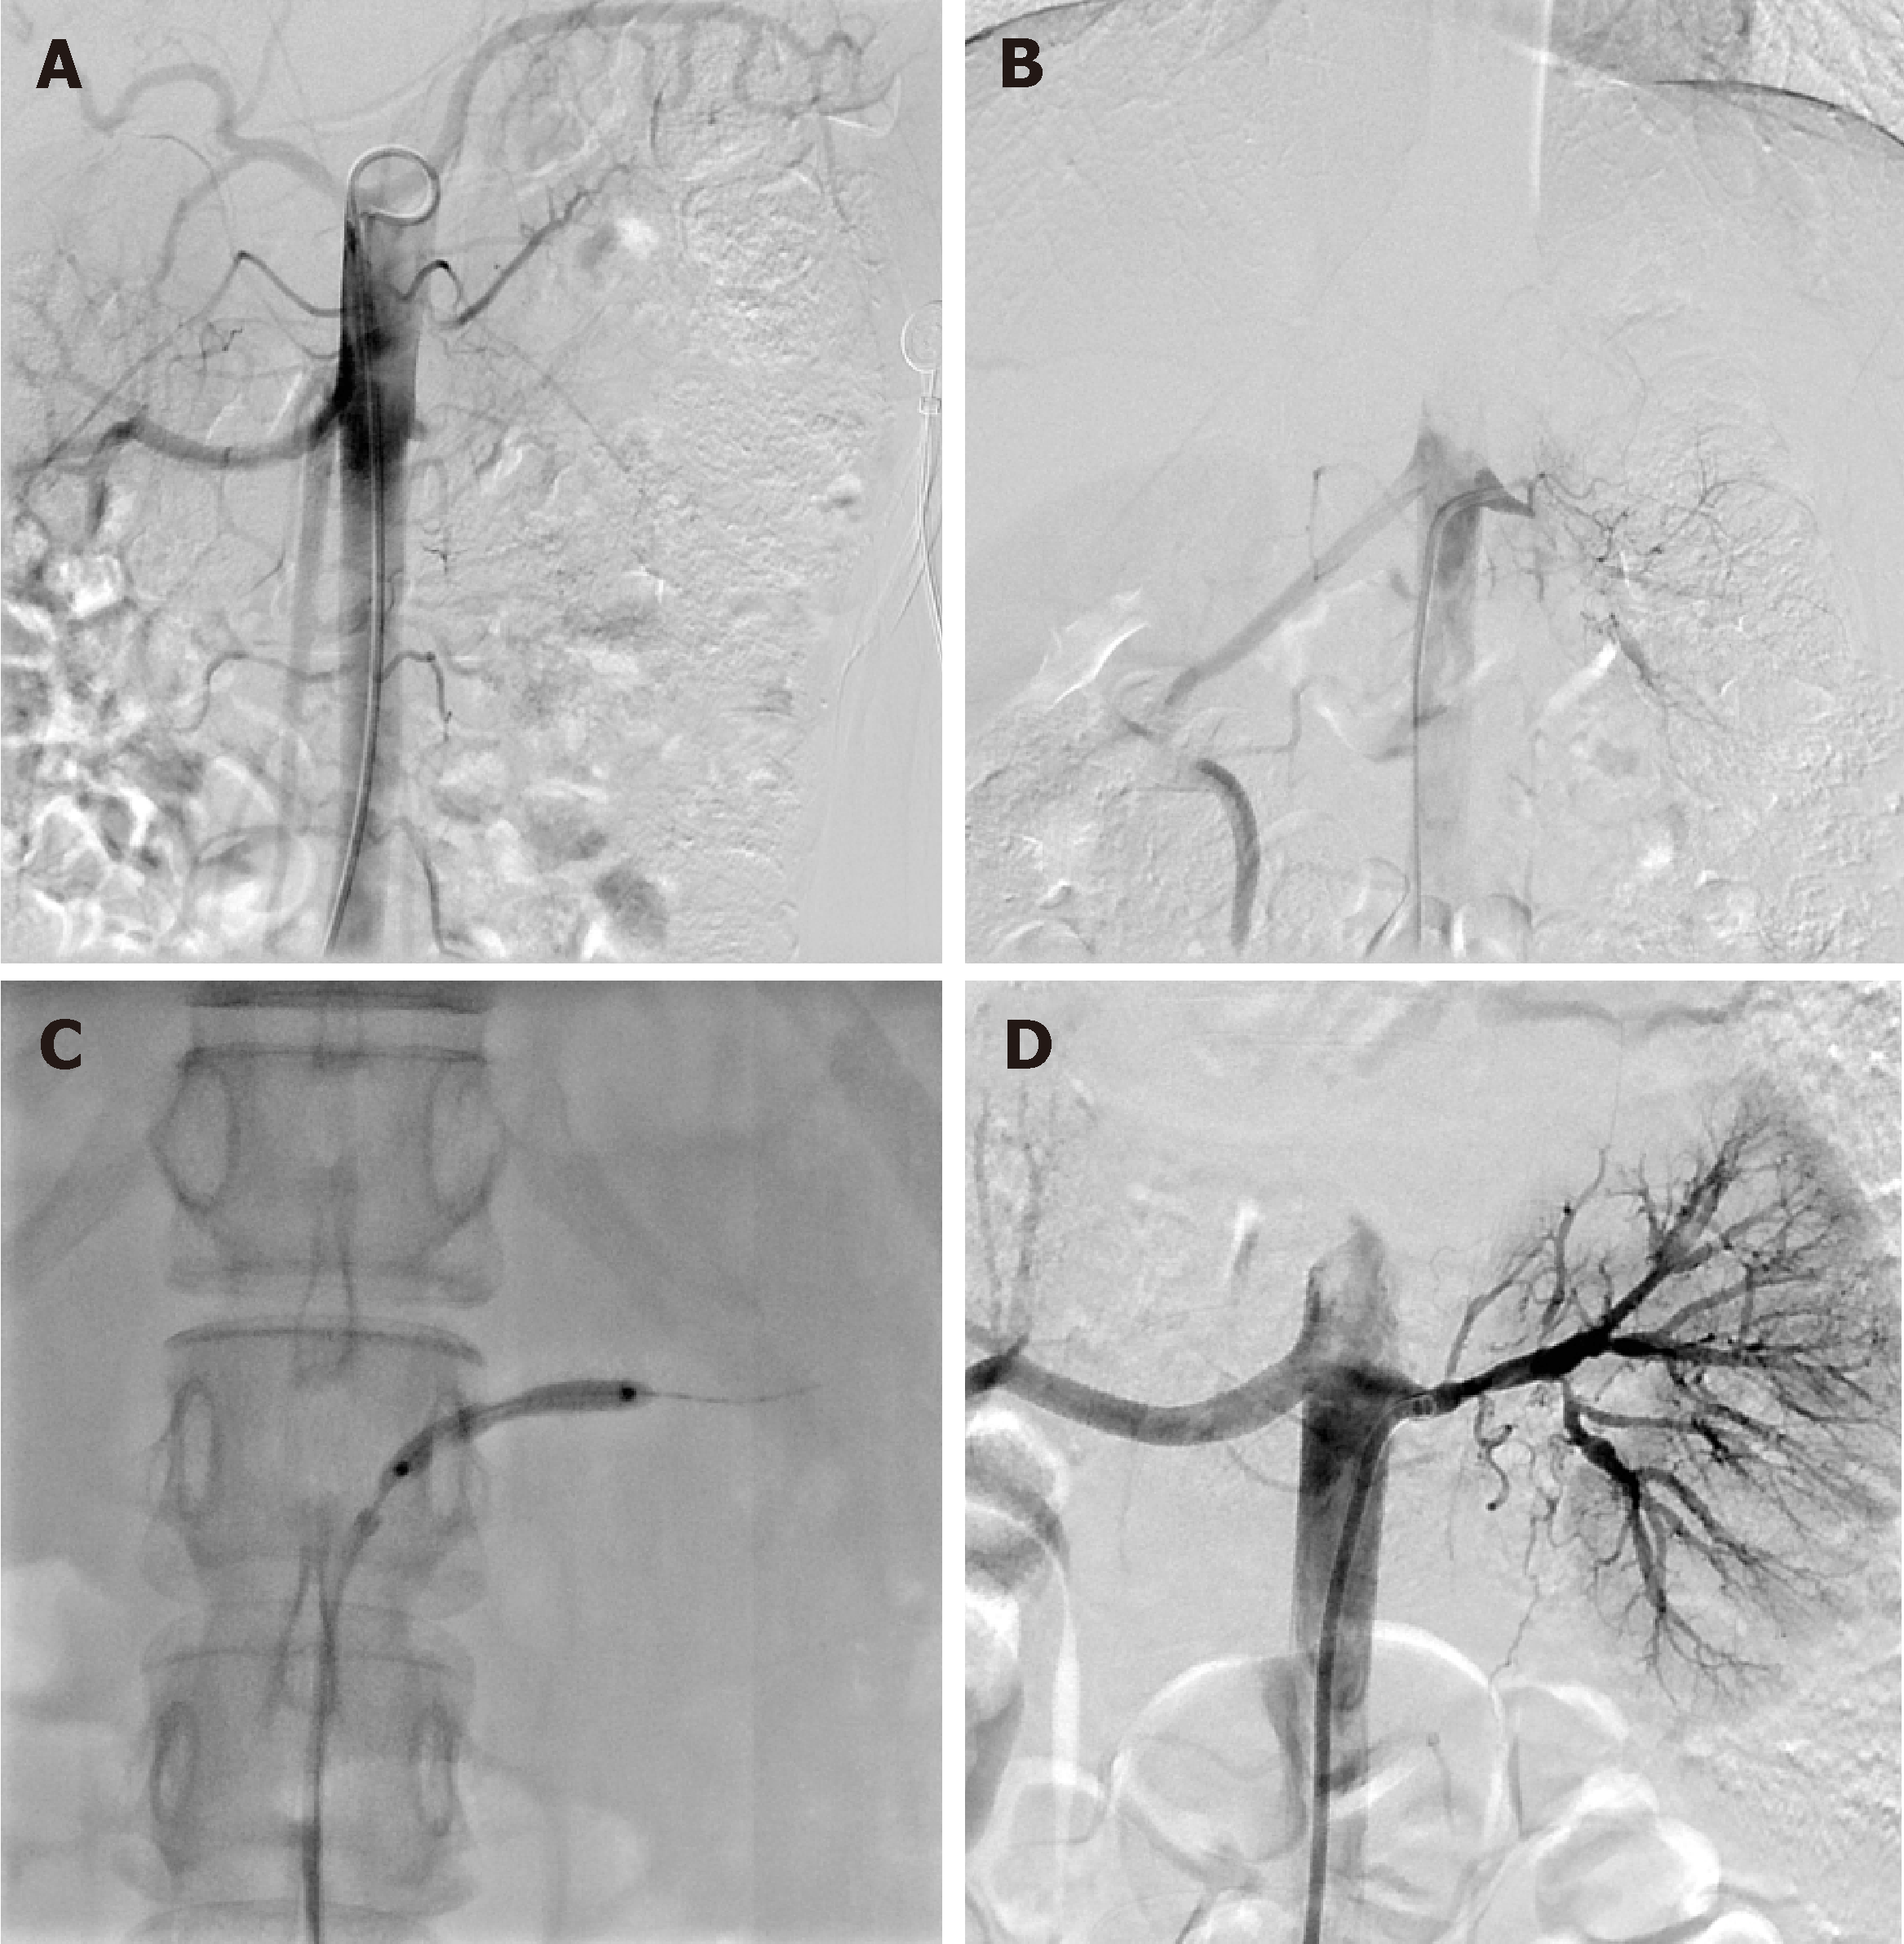
Figure 2 Renal angioplasty procedure.
A and B: Pre-transluminal renal angioplasty; C: Inflation of the balloon at the left renal artery ostium; D: Post-transluminal renal angioplasty.
- Citation: Bi YH, Ren JZ, Yi MF, Li JD, Han XW. Drug coated balloon angioplasty for renal artery stenosis due to Takayasu arteritis: Report of five cases. World J Clin Cases 2019; 7(18): 2888-2893
- URL: https://www.wjgnet.com/2307-8960/full/v7/i18/2888.htm
- DOI: https://dx.doi.org/10.12998/wjcc.v7.i18.2888


