Copyright
©The Author(s) 2019.
World J Clin Cases. Sep 26, 2019; 7(18): 2712-2721
Published online Sep 26, 2019. doi: 10.12998/wjcc.v7.i18.2712
Published online Sep 26, 2019. doi: 10.12998/wjcc.v7.i18.2712
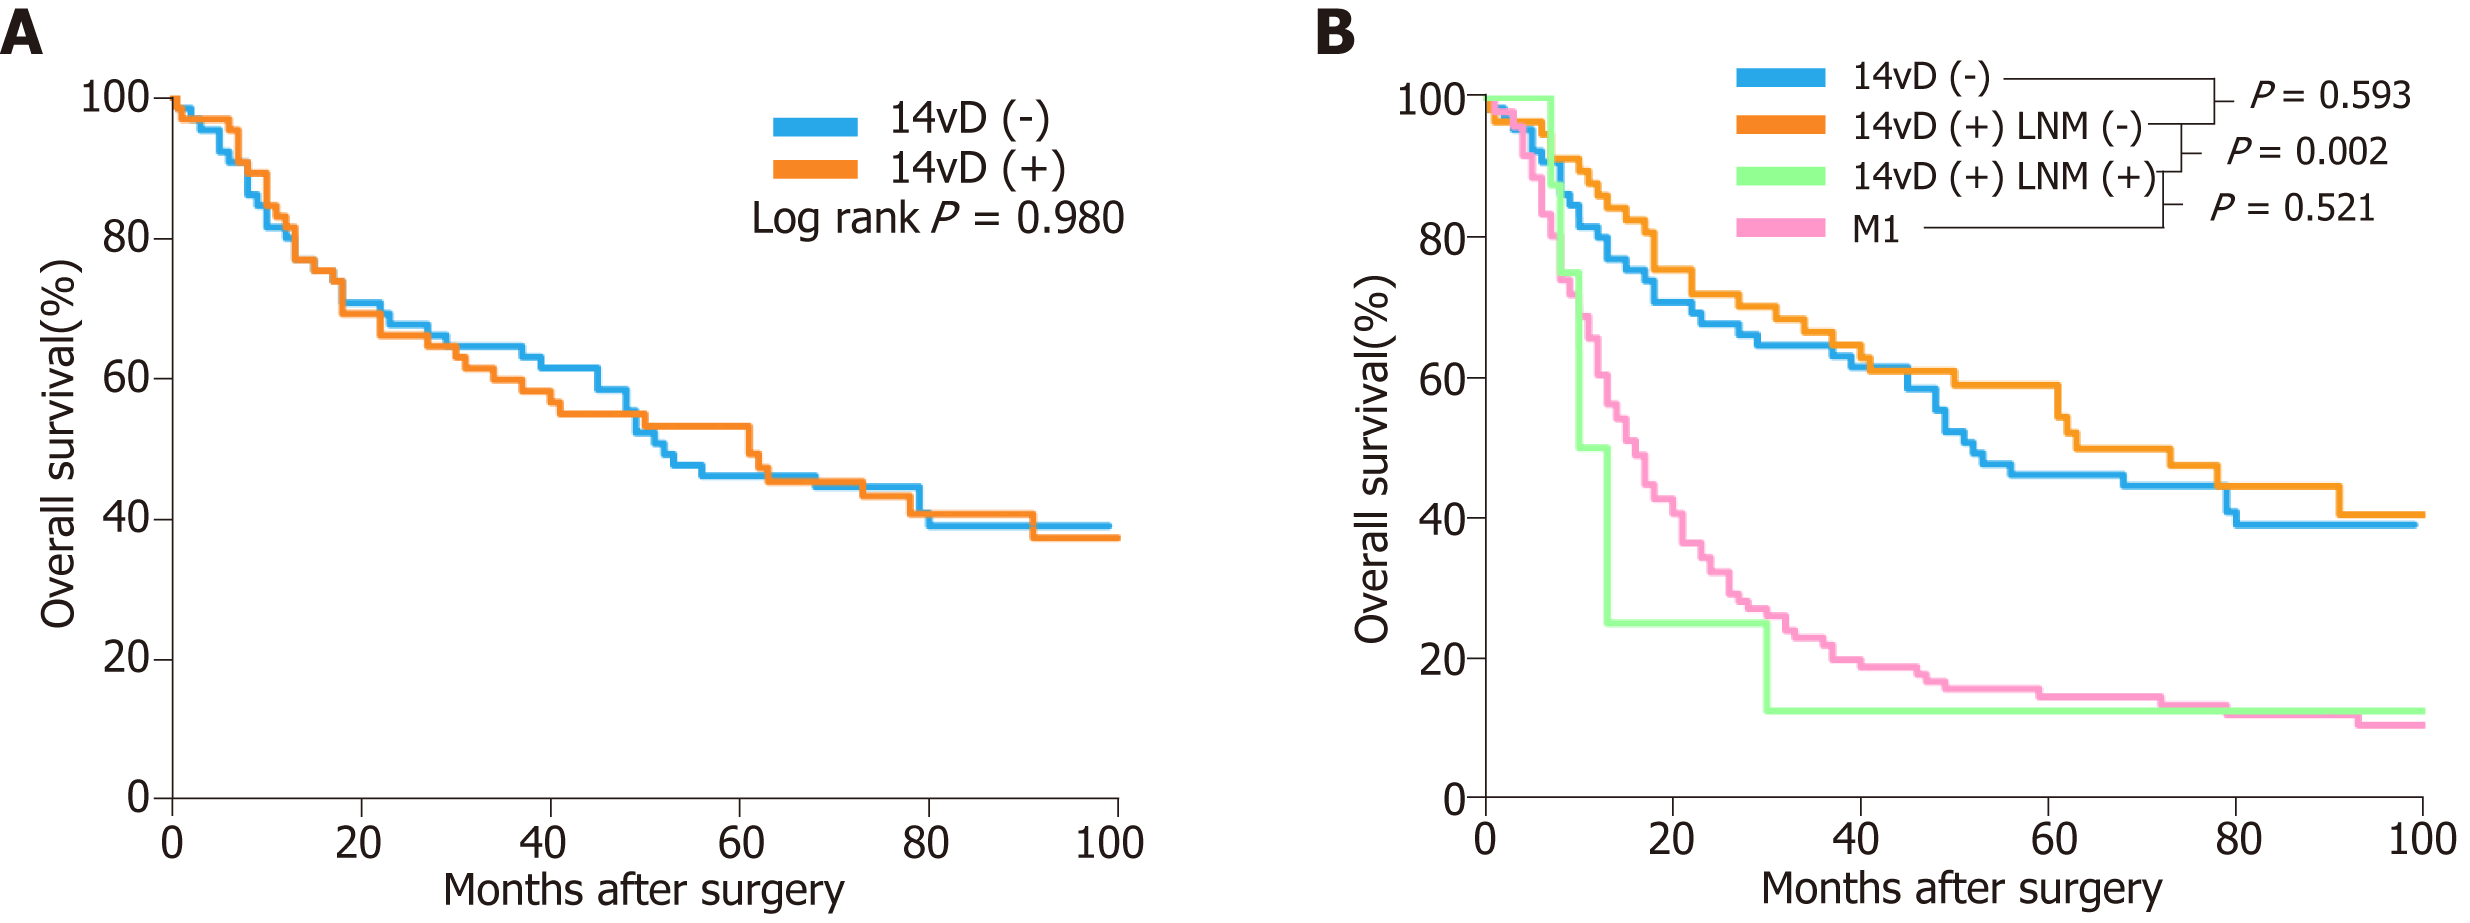
Figure 1 Overall survival curves of patients.
A: Overall survival curves of patients in the 14vD (-) and 14vD (+) groups; B: Overall survival curves of patients in the 14vD (-) group, the 14vD (+) group with and without 14v lymph nodes metastasis, and patients with distant metastasis. LNM (-): Without 14v lymph nodes metastasis; LNM (+): With 14v lymph nodes metastasis.
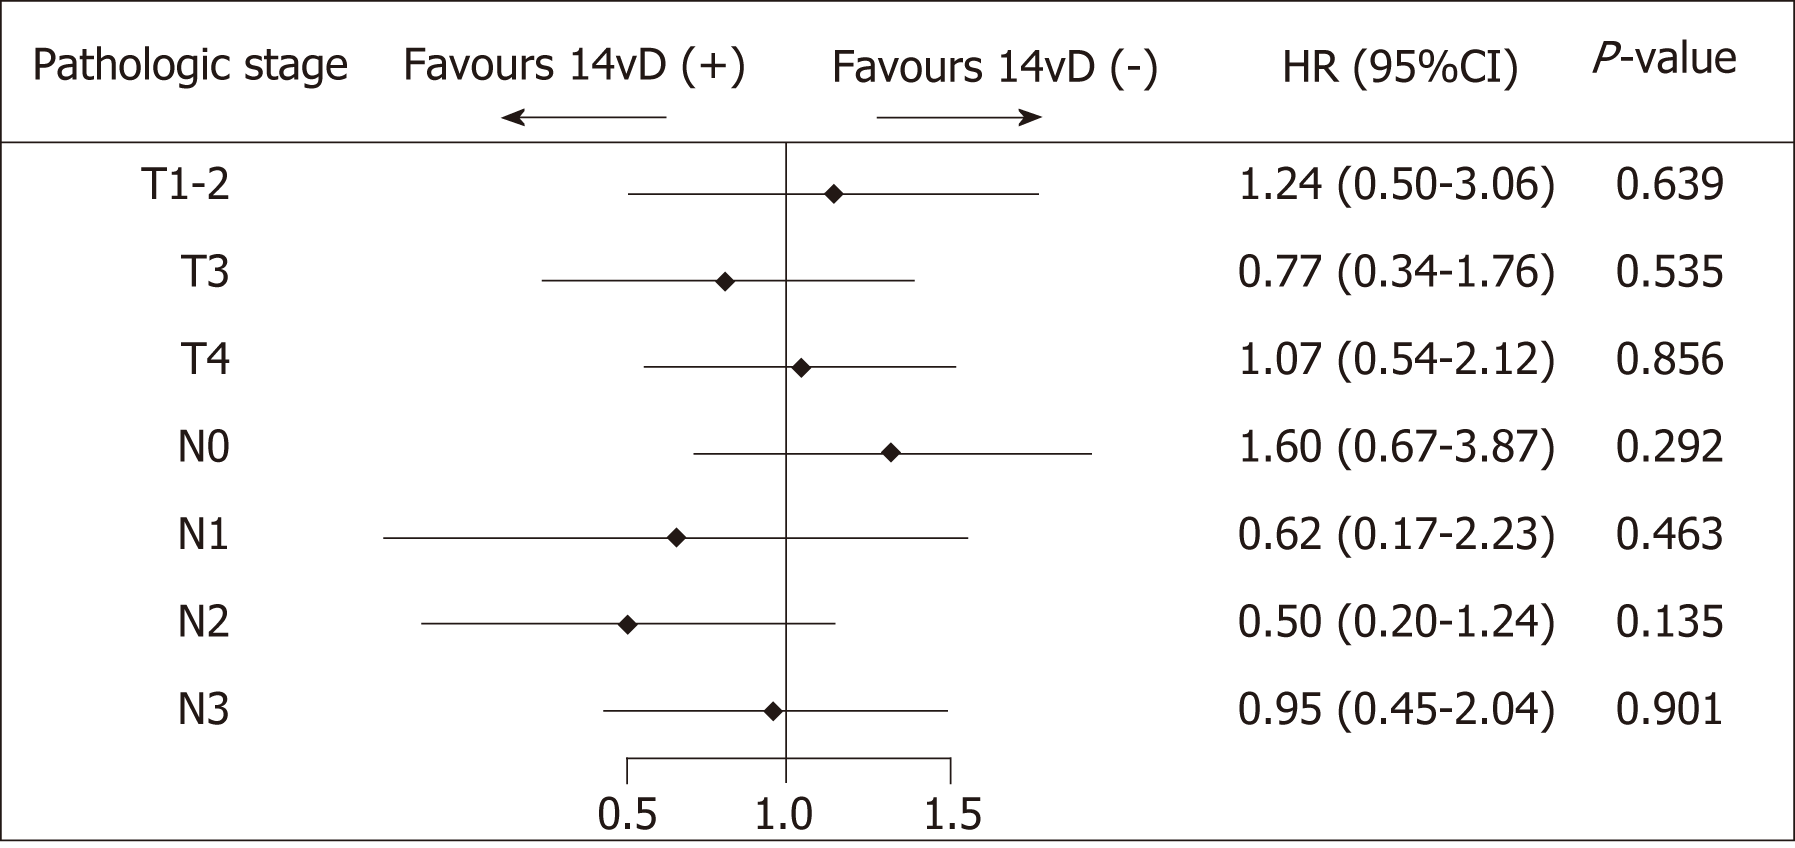
Figure 2 Forest plot of overall survival.
The hazard ratios for adding 14v lymph node dissection were obtained via Cox proportional hazard model for pathologic T stage and pathologic N stage.
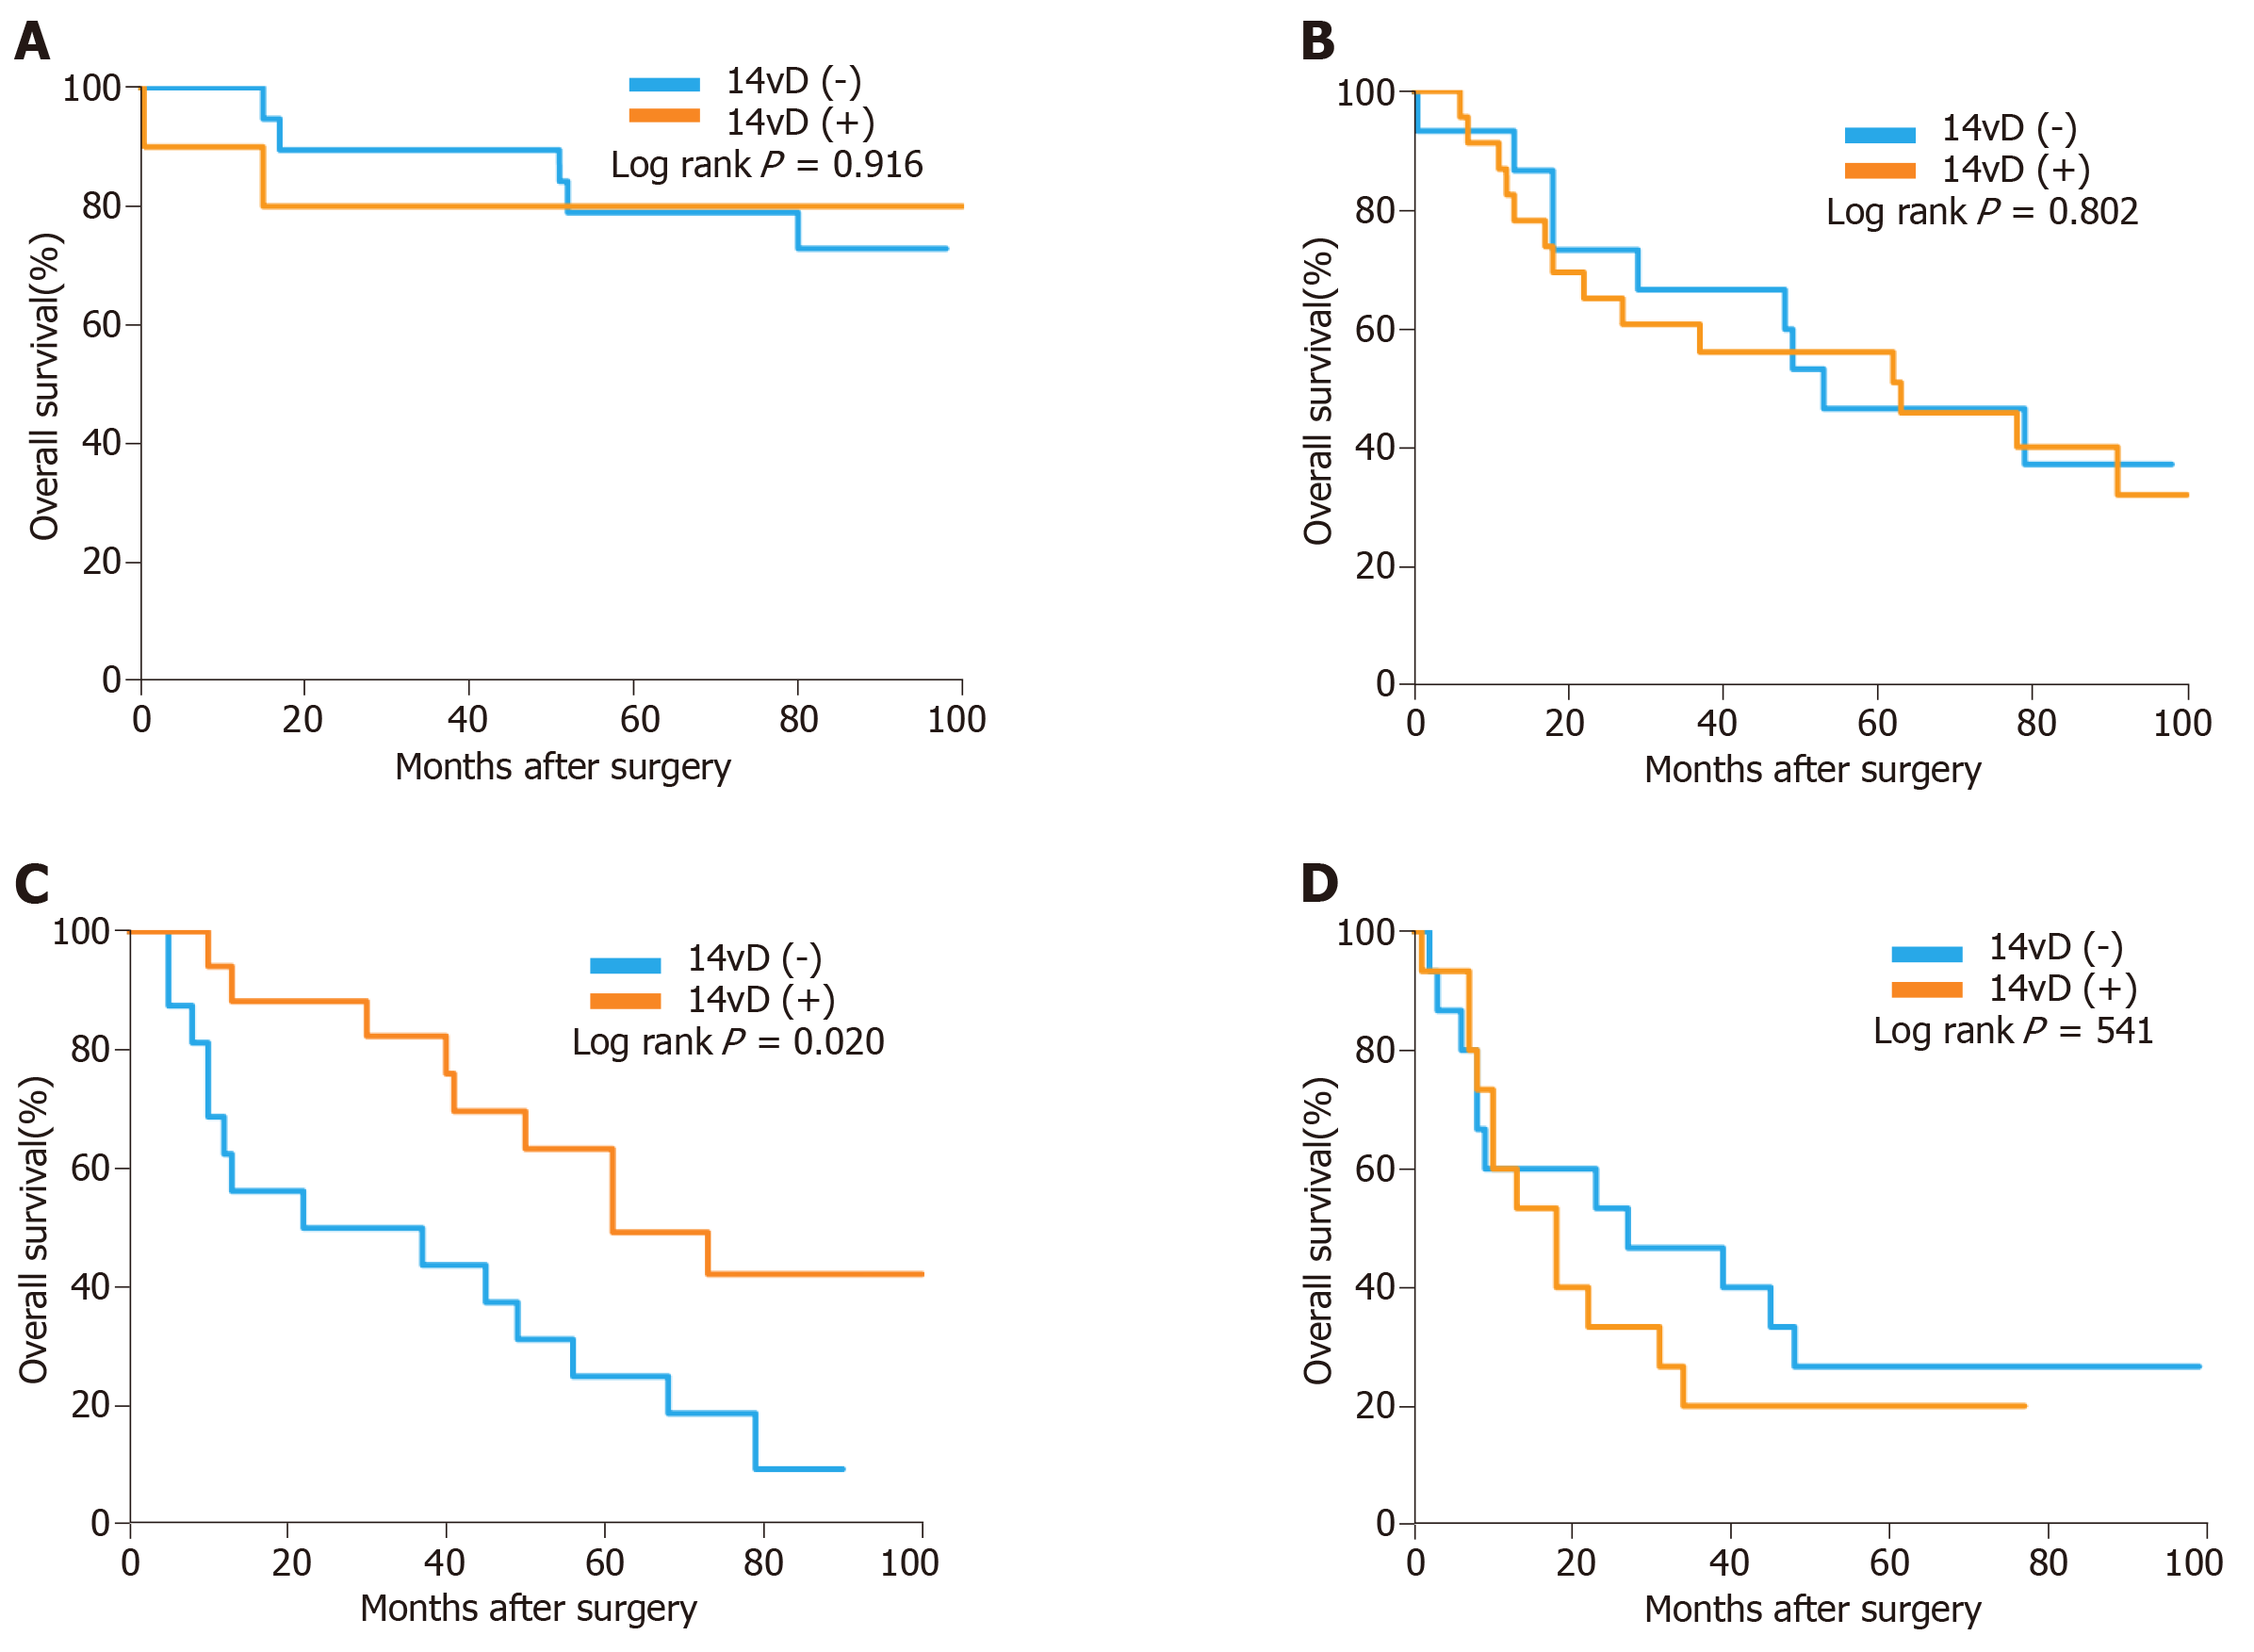
Figure 3 Overall survival according to 14v lymph node dissection in gastric cancer patients.
A: Pathologic stage I; B: Pathologic stage II; C: Pathologic stage IIIA; D: Pathologic stages IIIB/IIIC gastric cancer patients.
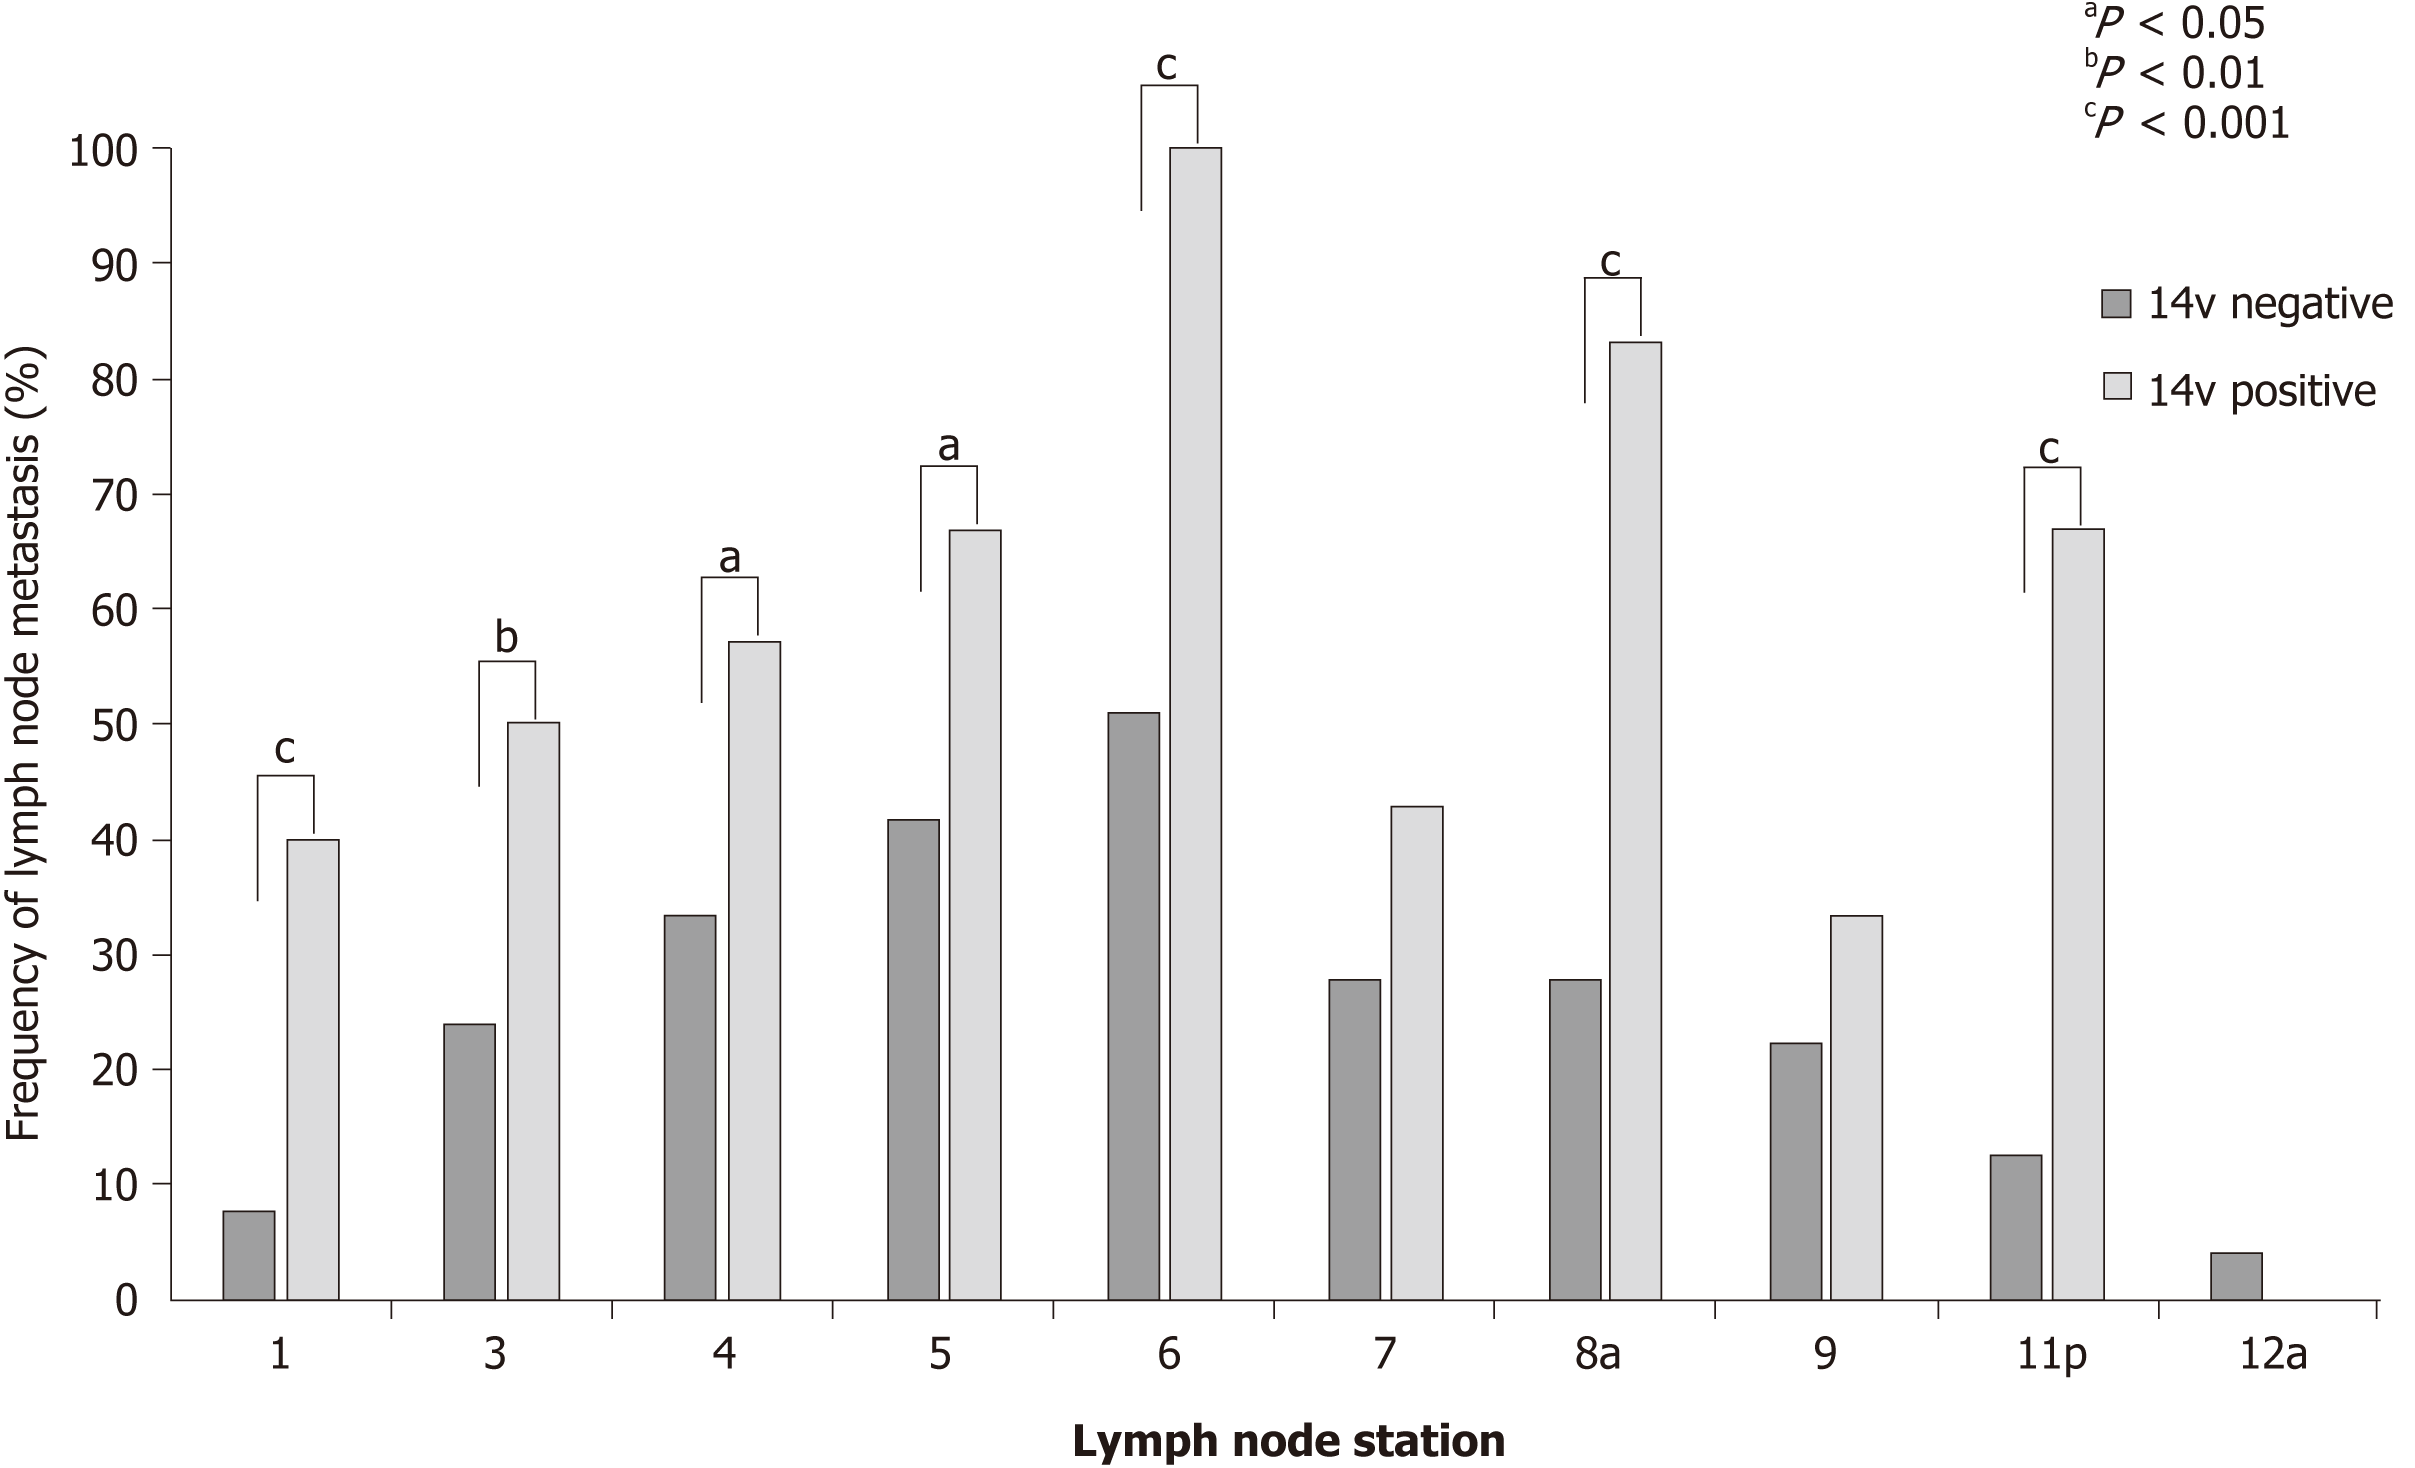
Figure 4 Frequency of metastasis to each lymph node station according to the presence of station 14 lymph node metastasis in the entire study population.
- Citation: Zheng C, Gao ZM, Sun AQ, Huang HB, Wang ZN, Li K, Gao S. Prognostic significance of 14v-lymph node dissection to D2 dissection for lower-third gastric cancer. World J Clin Cases 2019; 7(18): 2712-2721
- URL: https://www.wjgnet.com/2307-8960/full/v7/i18/2712.htm
- DOI: https://dx.doi.org/10.12998/wjcc.v7.i18.2712


