Copyright
©The Author(s) 2019.
World J Clin Cases. Jul 6, 2019; 7(13): 1717-1725
Published online Jul 6, 2019. doi: 10.12998/wjcc.v7.i13.1717
Published online Jul 6, 2019. doi: 10.12998/wjcc.v7.i13.1717
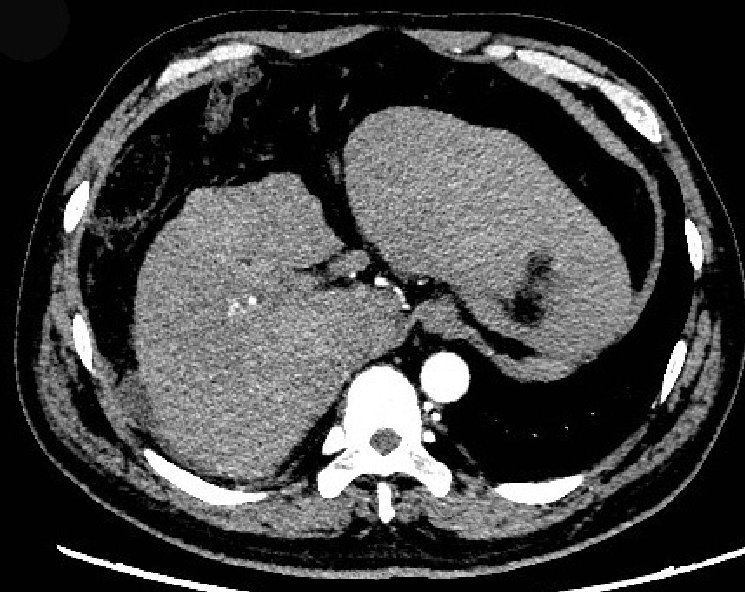
Figure 1 Contrast-enhanced computed tomography image.
The liver volume decreased. Computed tomography showed an irregular shape of the surface, the proportion of each leaf was not coordinated, and the density of the hepatic parenchymal was variable.
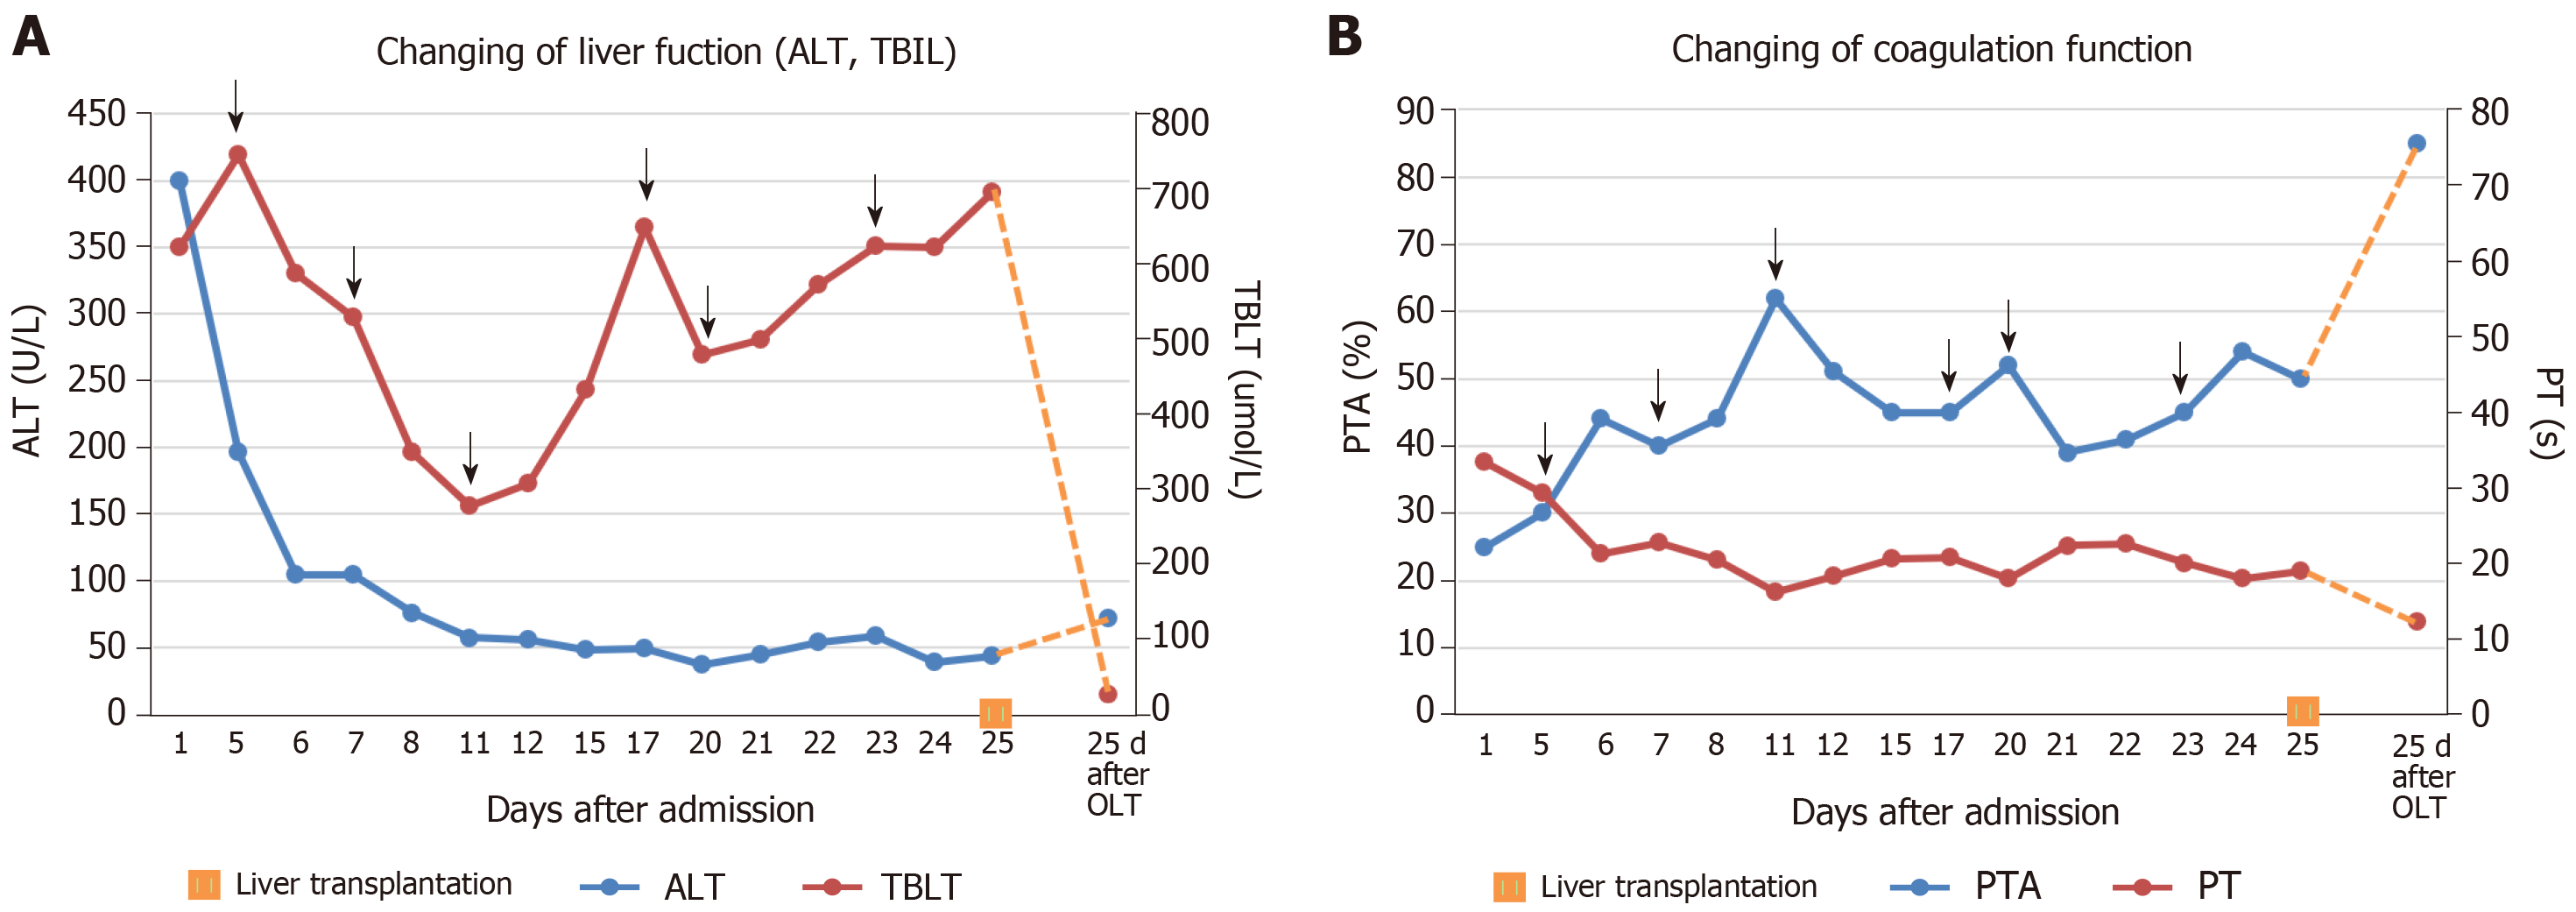
Figure 2 Clinical course.
A: Changes in alanine aminotransferase and total bilirubin; B: Changes in prothrombin time and prothrombin time activity. ALT: Alanine aminotransferase; TBIL: Total bilirubin; PT: Prothrombin time; PTA: Prothrombin time activity; OLT: Orthotopic liver transplantation.
Figure 3 Liver biopsy specimen staining.
HE staining showed massive necrosis of liver tissue, and immunohistochemical staining for CD19 revealed cholestasis and biliary duct hyperplasia.
Figure 4 Timeline of benzbromarone production and countries with published results regarding benzbromarone hepatoxicity
- Citation: Zhang MY, Niu JQ, Wen XY, Jin QL. Liver failure associated with benzbromarone: A case report and review of the literature. World J Clin Cases 2019; 7(13): 1717-1725
- URL: https://www.wjgnet.com/2307-8960/full/v7/i13/1717.htm
- DOI: https://dx.doi.org/10.12998/wjcc.v7.i13.1717


