Copyright
©The Author(s) 2019.
World J Clin Cases. Jun 26, 2019; 7(12): 1492-1498
Published online Jun 26, 2019. doi: 10.12998/wjcc.v7.i12.1492
Published online Jun 26, 2019. doi: 10.12998/wjcc.v7.i12.1492
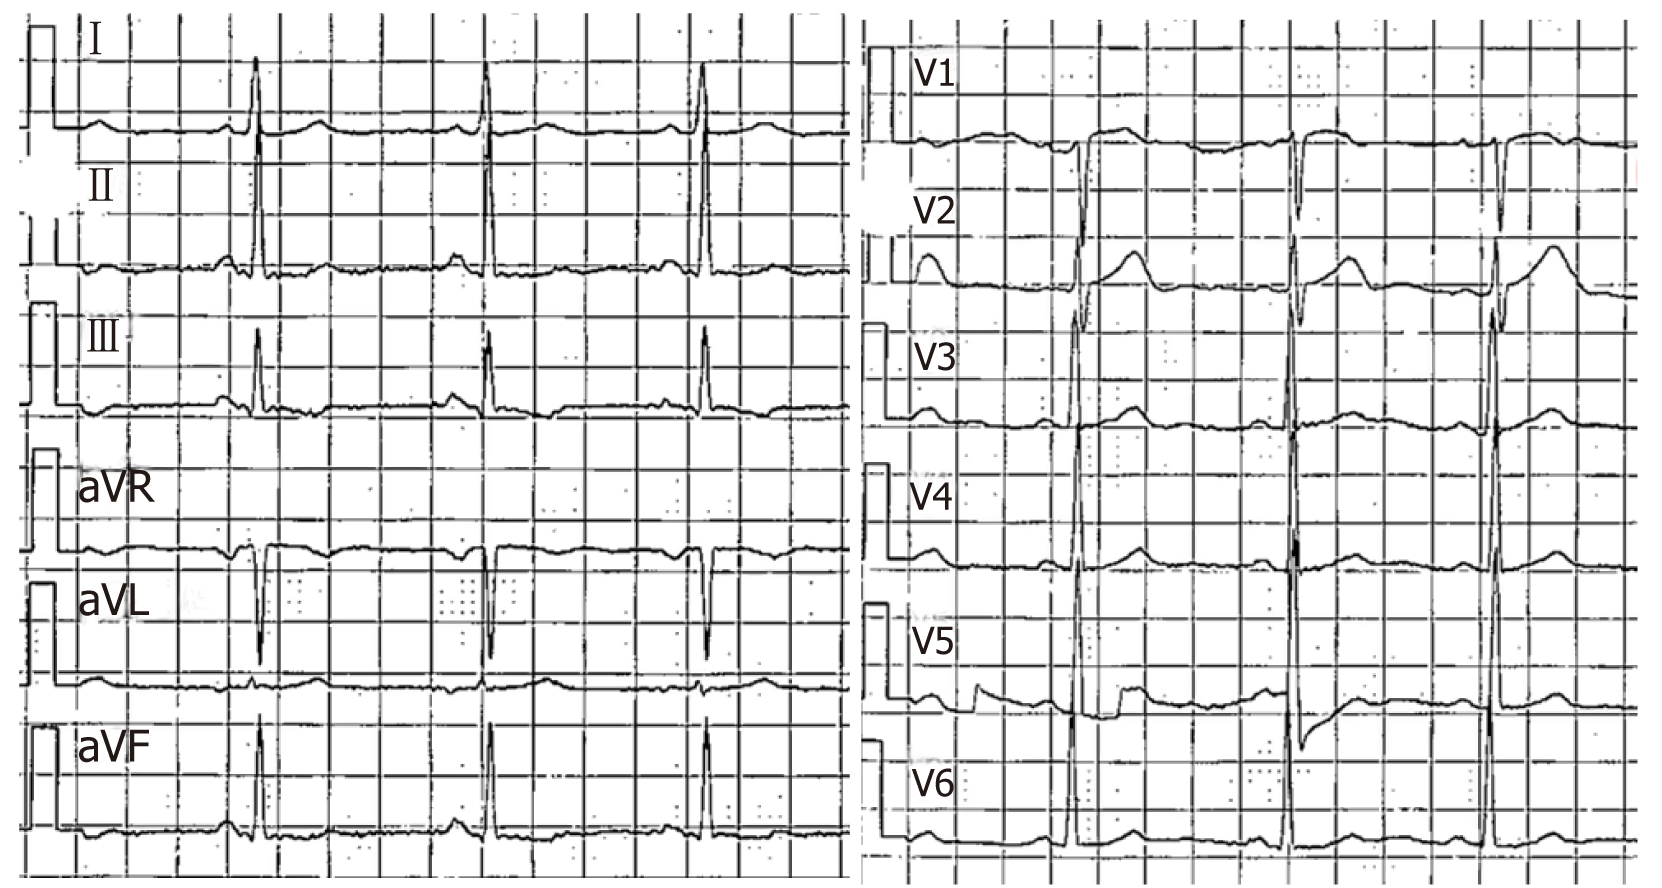
Figure 1 Electrocardiogram at the initial diagnosis of breast cancer showing an almost normal profile.
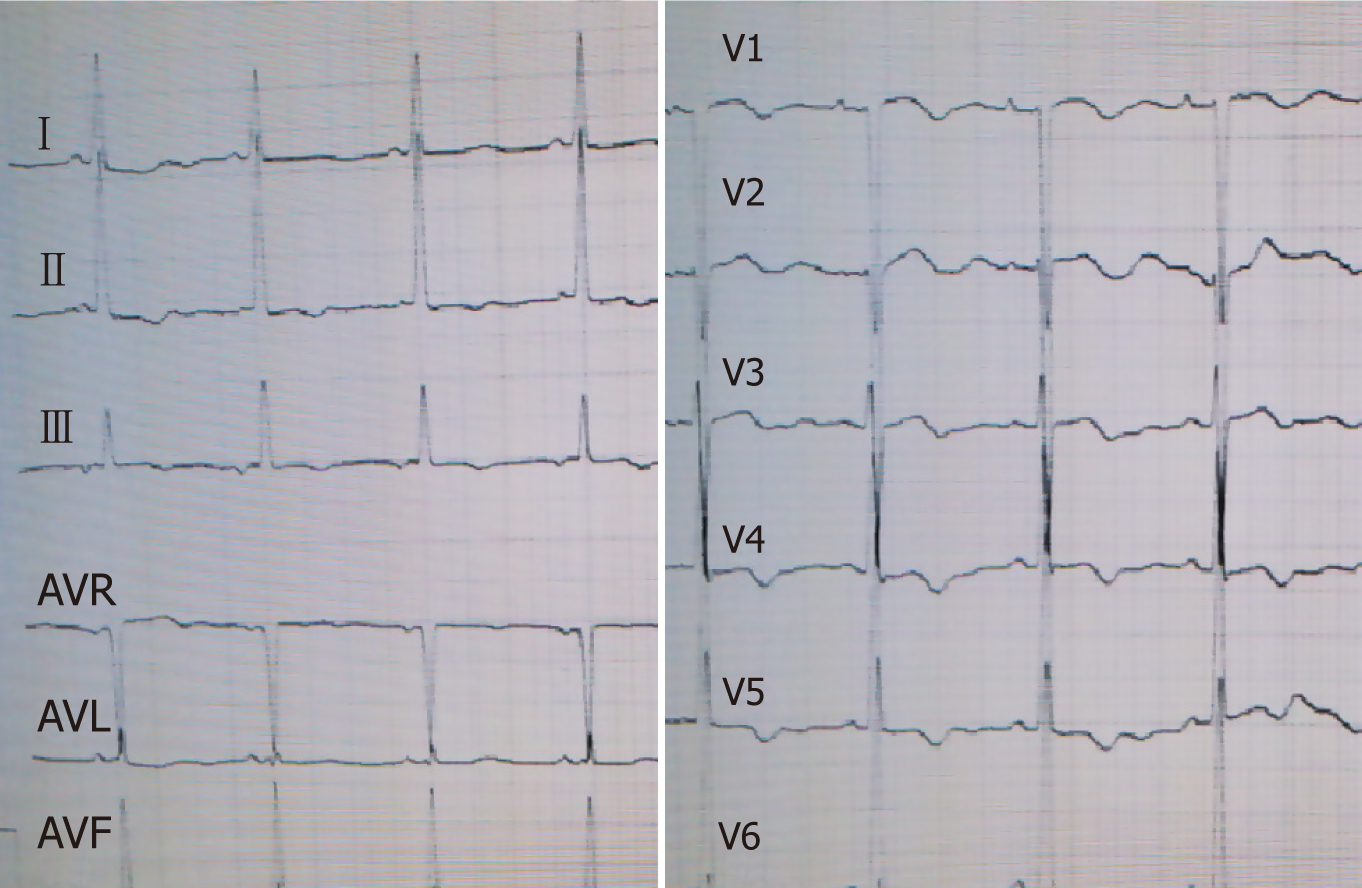
Figure 2 Electrocardiogram when the patient presented with dyspnea.
T-wave inversion can be seen in the leads II, III, AVF, and V1-V6.
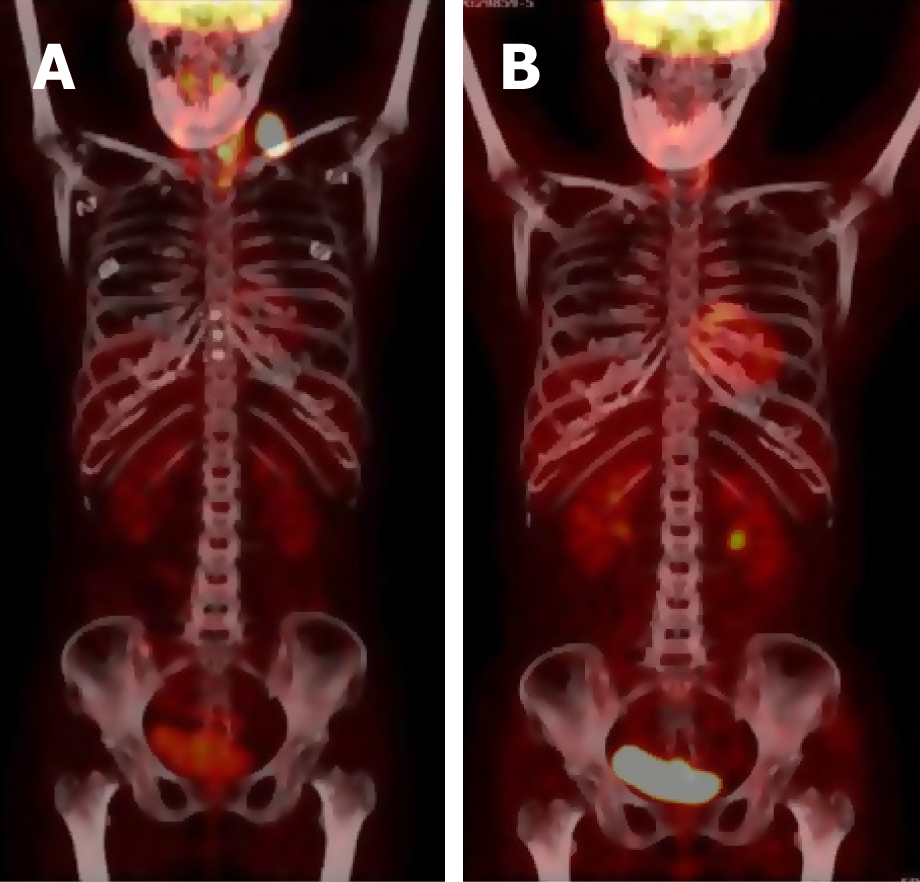
Figure 3 [18F]-fluorodeoxyglucose positron emission tomography findings.
A: Left supraclavicular lymph node enlargement with high uptake of fluorodeoxyglucose at the time of lymphoma diagnosis; B: Disease remission after eight cycles of chemotherapy.
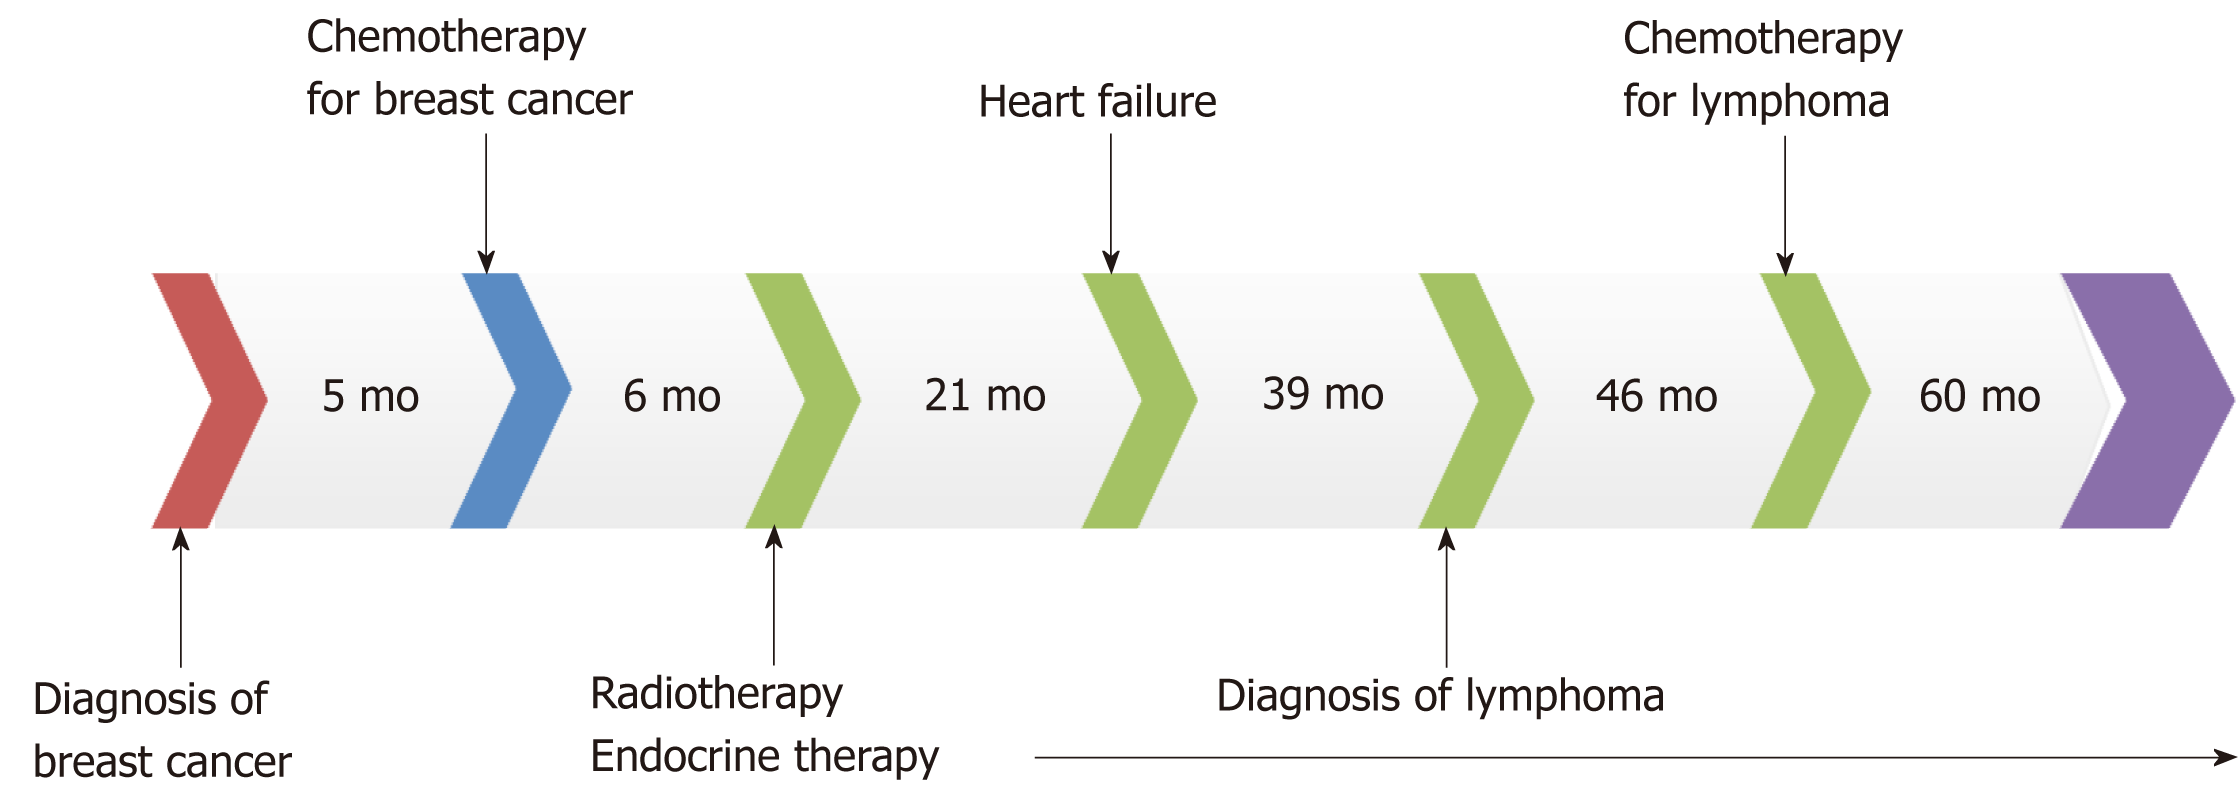
Figure 4 Patient’s anti-cancer treatment schedule from the initial diagnosis of breast cancer to the treatment of lymphoma and accompanying follow-up.
- Citation: Han S, An T, Liu WP, Song YQ, Zhu J. Secondary lymphoma develops in the setting of heart failure when treating breast cancer: A case report. World J Clin Cases 2019; 7(12): 1492-1498
- URL: https://www.wjgnet.com/2307-8960/full/v7/i12/1492.htm
- DOI: https://dx.doi.org/10.12998/wjcc.v7.i12.1492


