
















Copyright: ©Author(s) 2026.
World J Clin Cases. Sep 16, 2026; 14(26): 125200
Published online Sep 16, 2026. doi: 10.12998/wjcc.125200
Published online Sep 16, 2026. doi: 10.12998/wjcc.125200
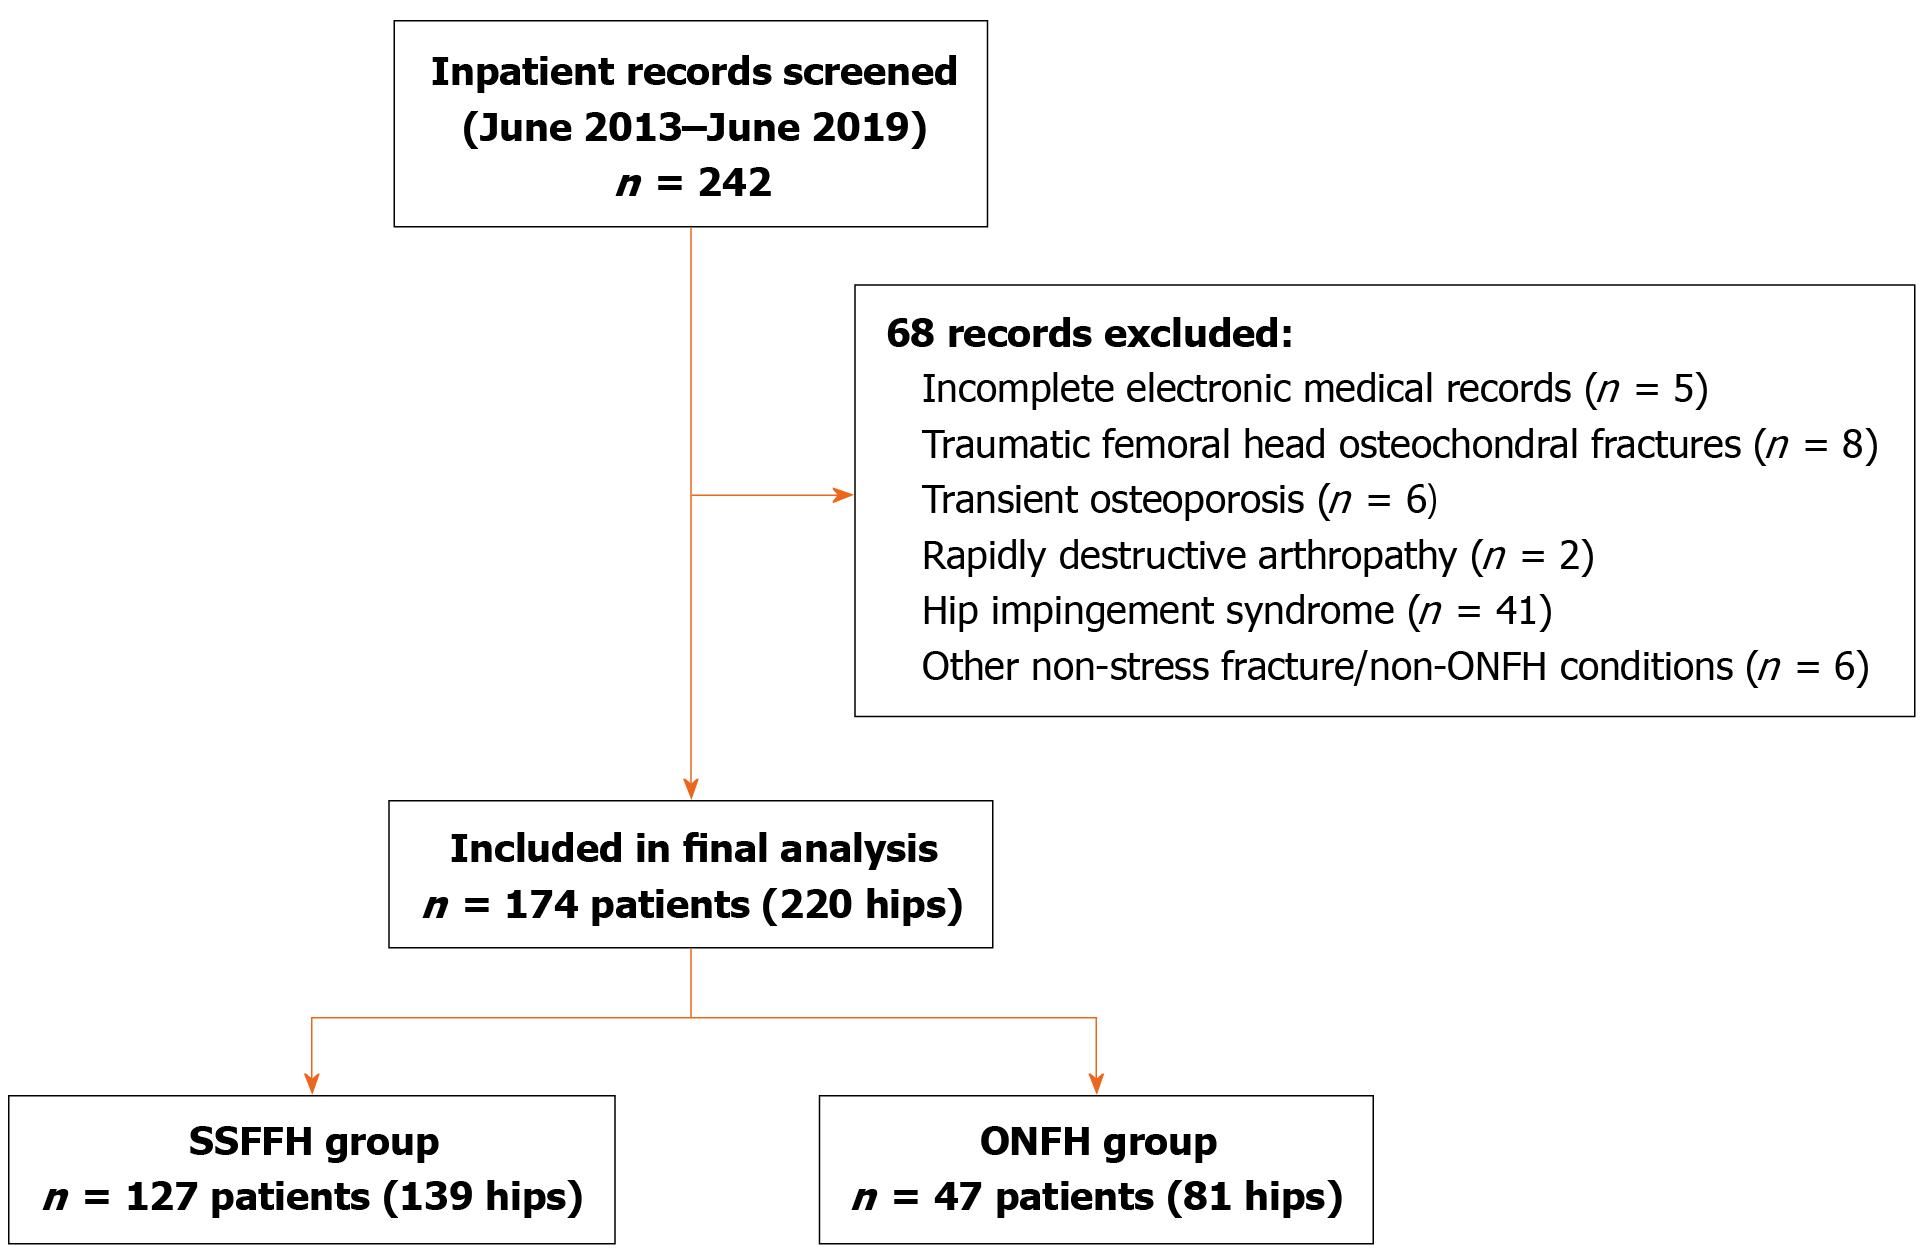
Figure 1 Participant flow diagram.
A total of 242 inpatient records were screened. Sixty-eight records were excluded: Incomplete electronic medical records (n = 5), traumatic femoral head osteochondral fractures (n = 8), transient osteoporosis (n = 6), rapidly destructive arthropathy (n = 2), femoroacetabular impingement syndrome (n = 41), and other non-stress-fracture/non-osteonecrosis of the femoral head (ONFH) conditions (n = 6). The final analysis included 174 patients (220 hips): 127 patients with subchondral stress fracture of the femoral head (139 hips) and 47 patients with ONFH (81 hips). Diagnostic-group classification was based on blinded magnetic resonance imaging review. SSFFH: Subchondral stress fracture of the femoral head; ONFH: Osteonecrosis of the femoral head.
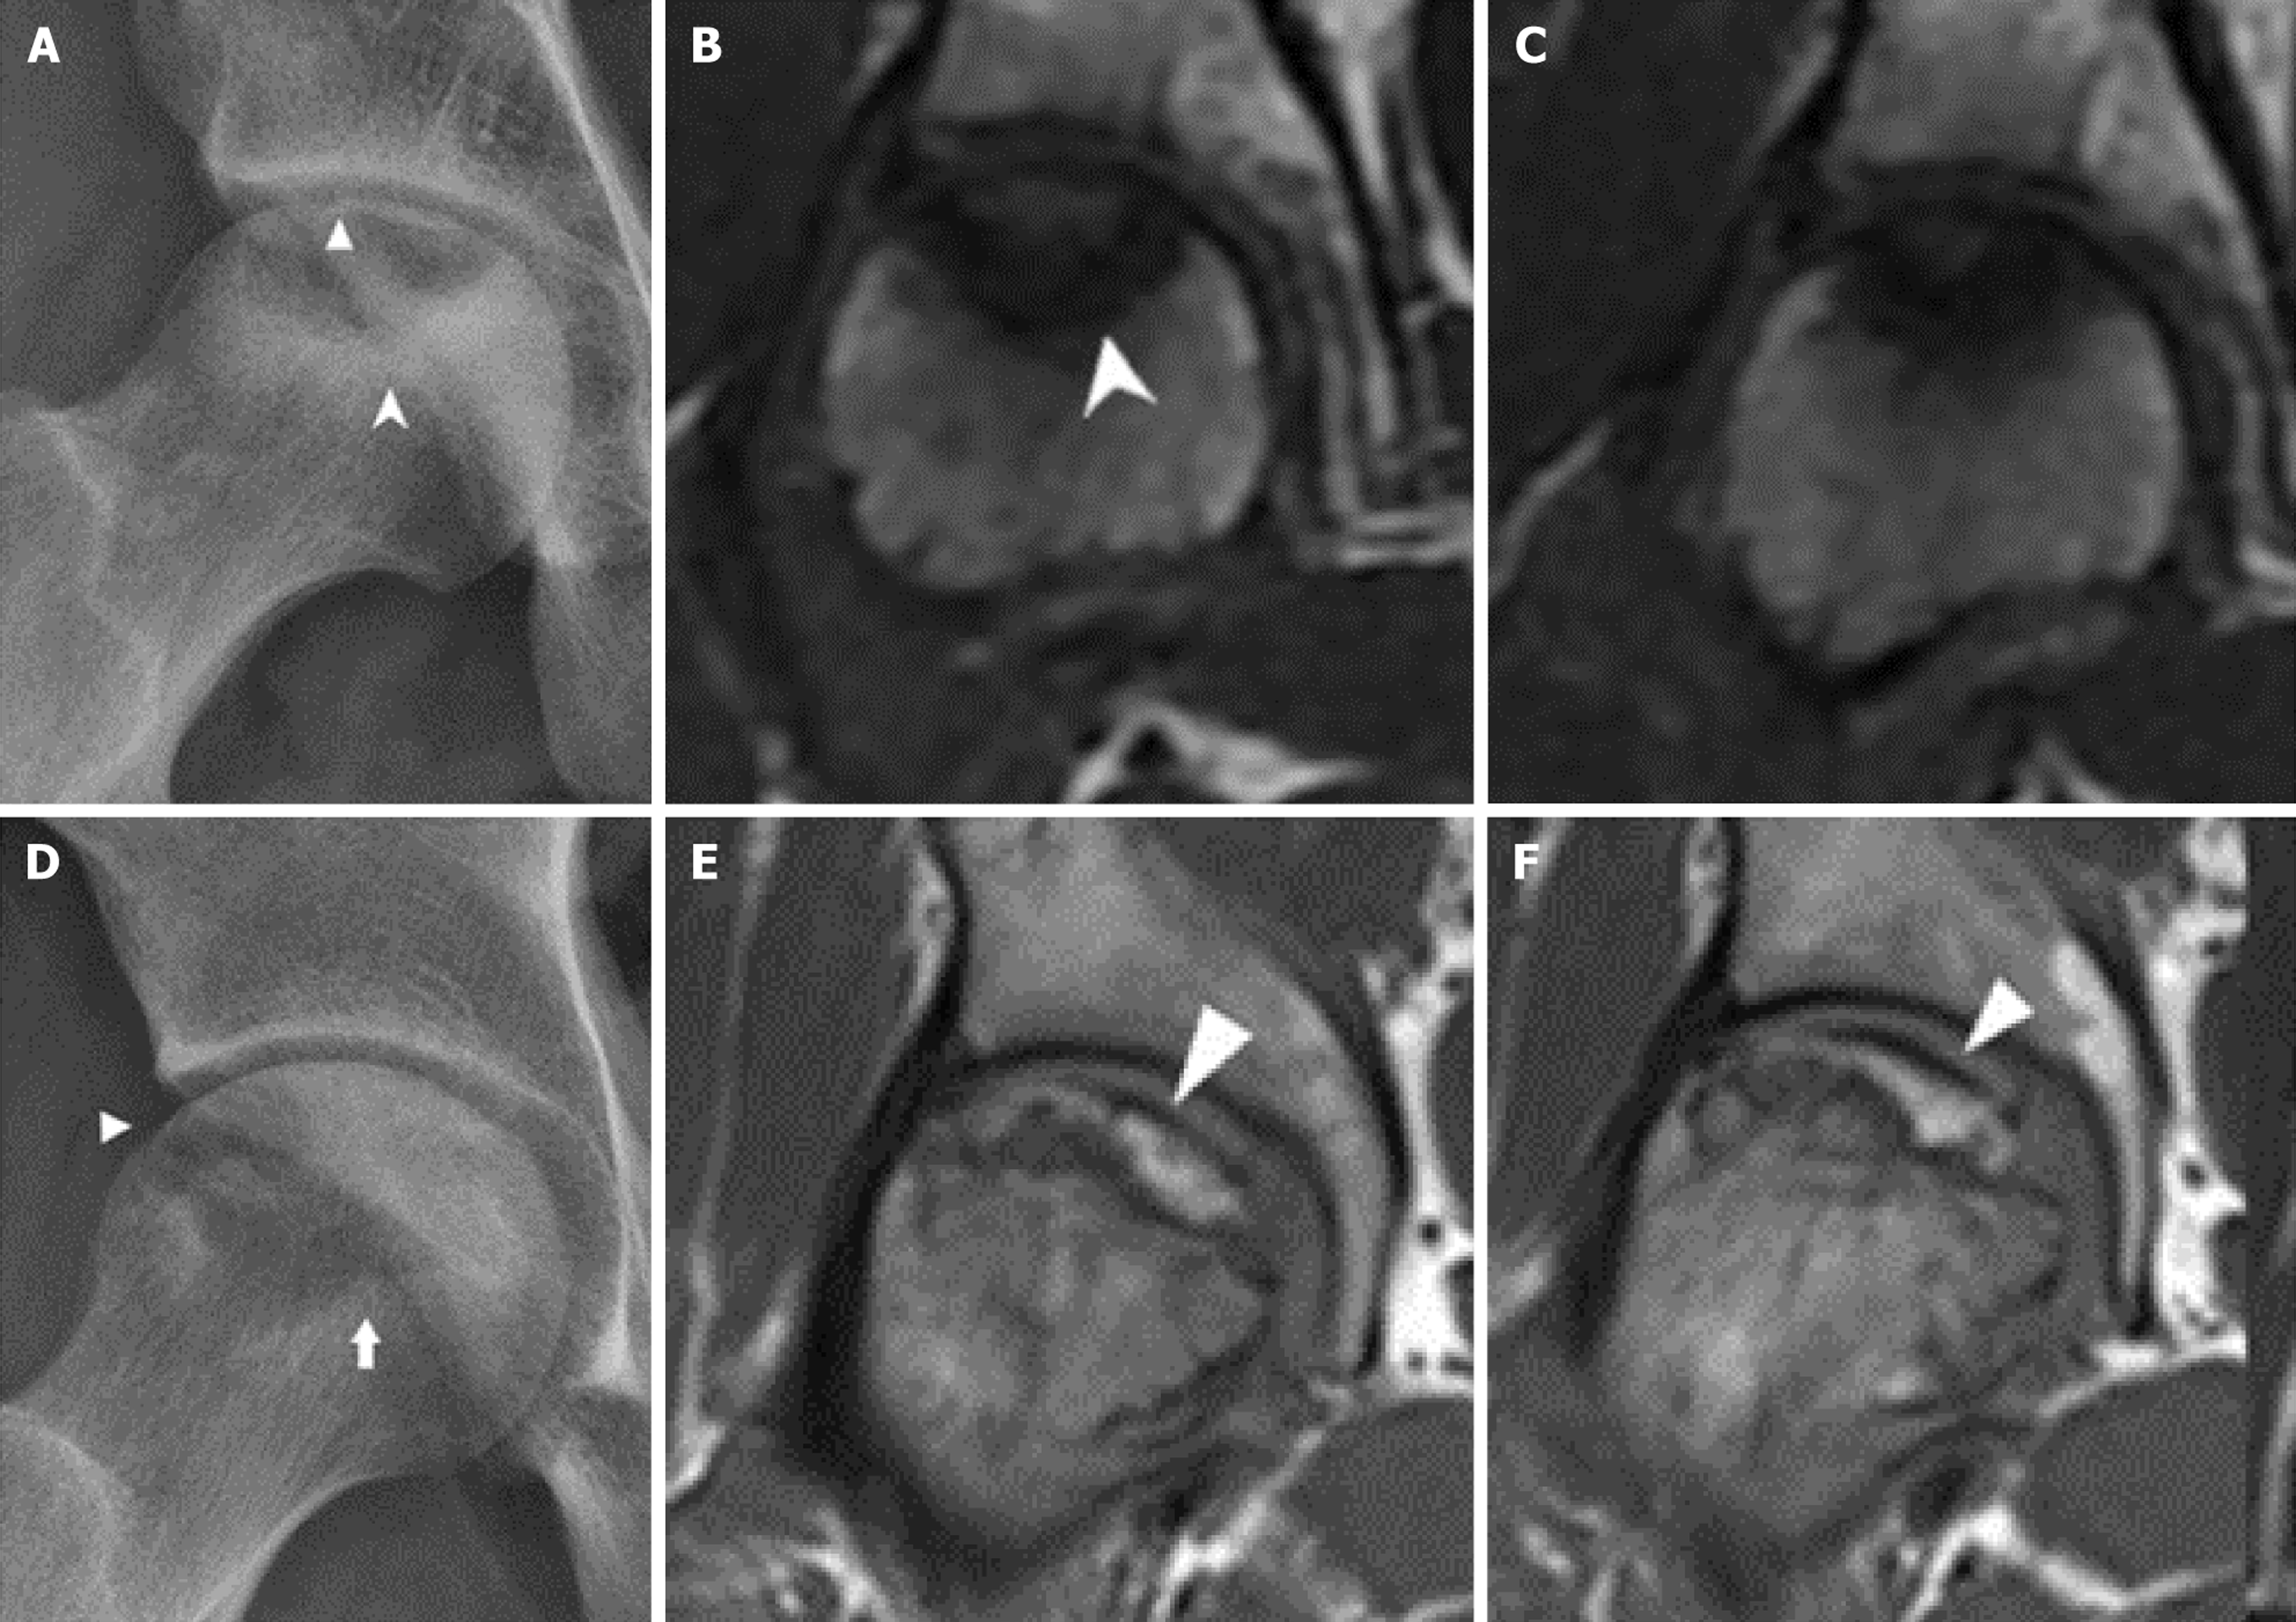
Figure 2 Representative radiographs and T1-weighted magnetic resonance images of subchondral stress fracture of the femoral head and osteonecrosis of the femoral head.
A-F: Imaging findings in a 20-year-old male recruit with subchondral stress fracture of the femoral head (SSFFH) (A-C) and a 45-year-old military officer with osteonecrosis of the femoral head (ONFH) (D-F). A and D: Radiographs show similar articular-surface collapse in both SSFFH and ONFH; the white triangles indicate subchondral fracture; B and C: Magnetic resonance imaging (MRI) of SSFFH reveals an irregular subchondral low-signal band (white arrow) with surrounding bone marrow edema and an irregular, thickened sclerotic margin; E and F: MRI of ONFH demonstrates a smoother, serpiginous low-signal band demarcating the necrotic segment, with a subchondral fracture indicated by the white triangle. These findings illustrate the potential overlap on radiographs and the added value of MRI for differential classification.
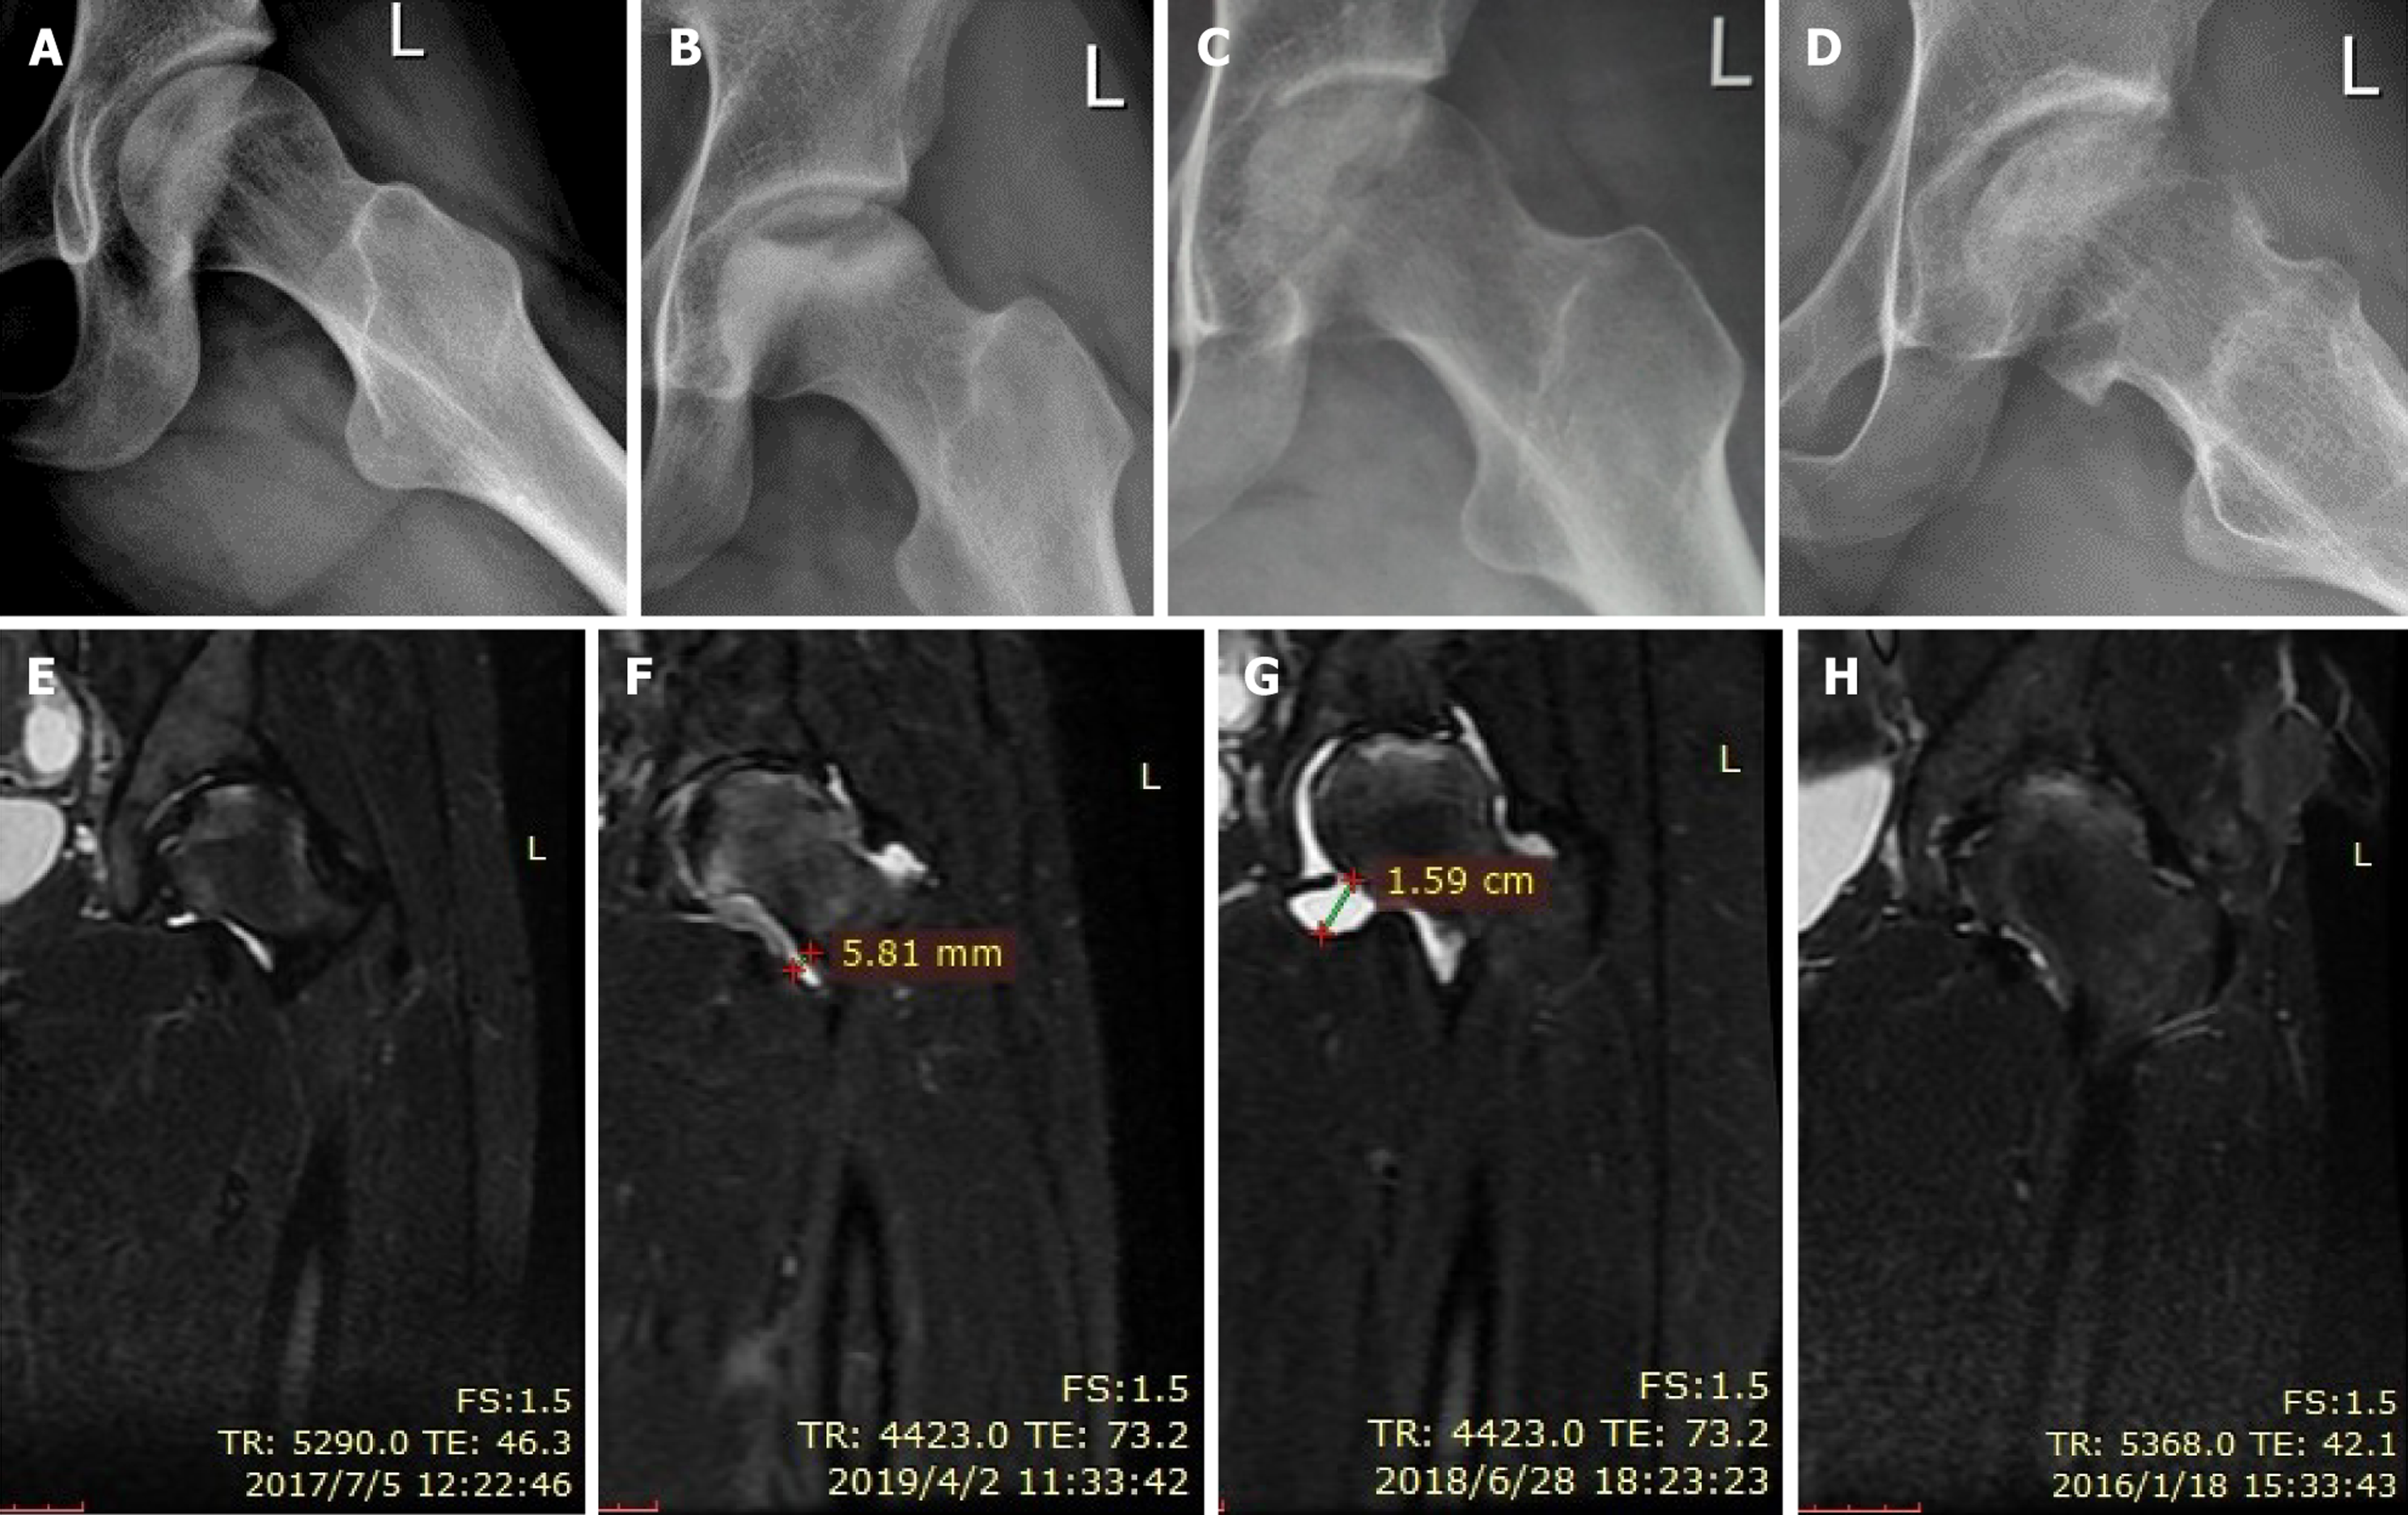
Figure 3 Representative X-ray and magnetic resonance imaging findings of subchondral stress fracture of the femoral head across the predefined imaging stages.
A and E: Stage I: Mild articular-margin depression with localized magnetic resonance imaging bone marrow edema; B and F: Stage I: Mild articular-margin depression with an indistinct fracture line and joint effusion; C and G: Stage II: Obvious articular depression with a clear subchondral fracture line, marked effusion, and extensive bone marrow edema; D and H: Stage III: Femoral-head flattening and advanced degenerative change with less prominent bone marrow edema. The staging framework was adapted from previously described imaging features[6,9].
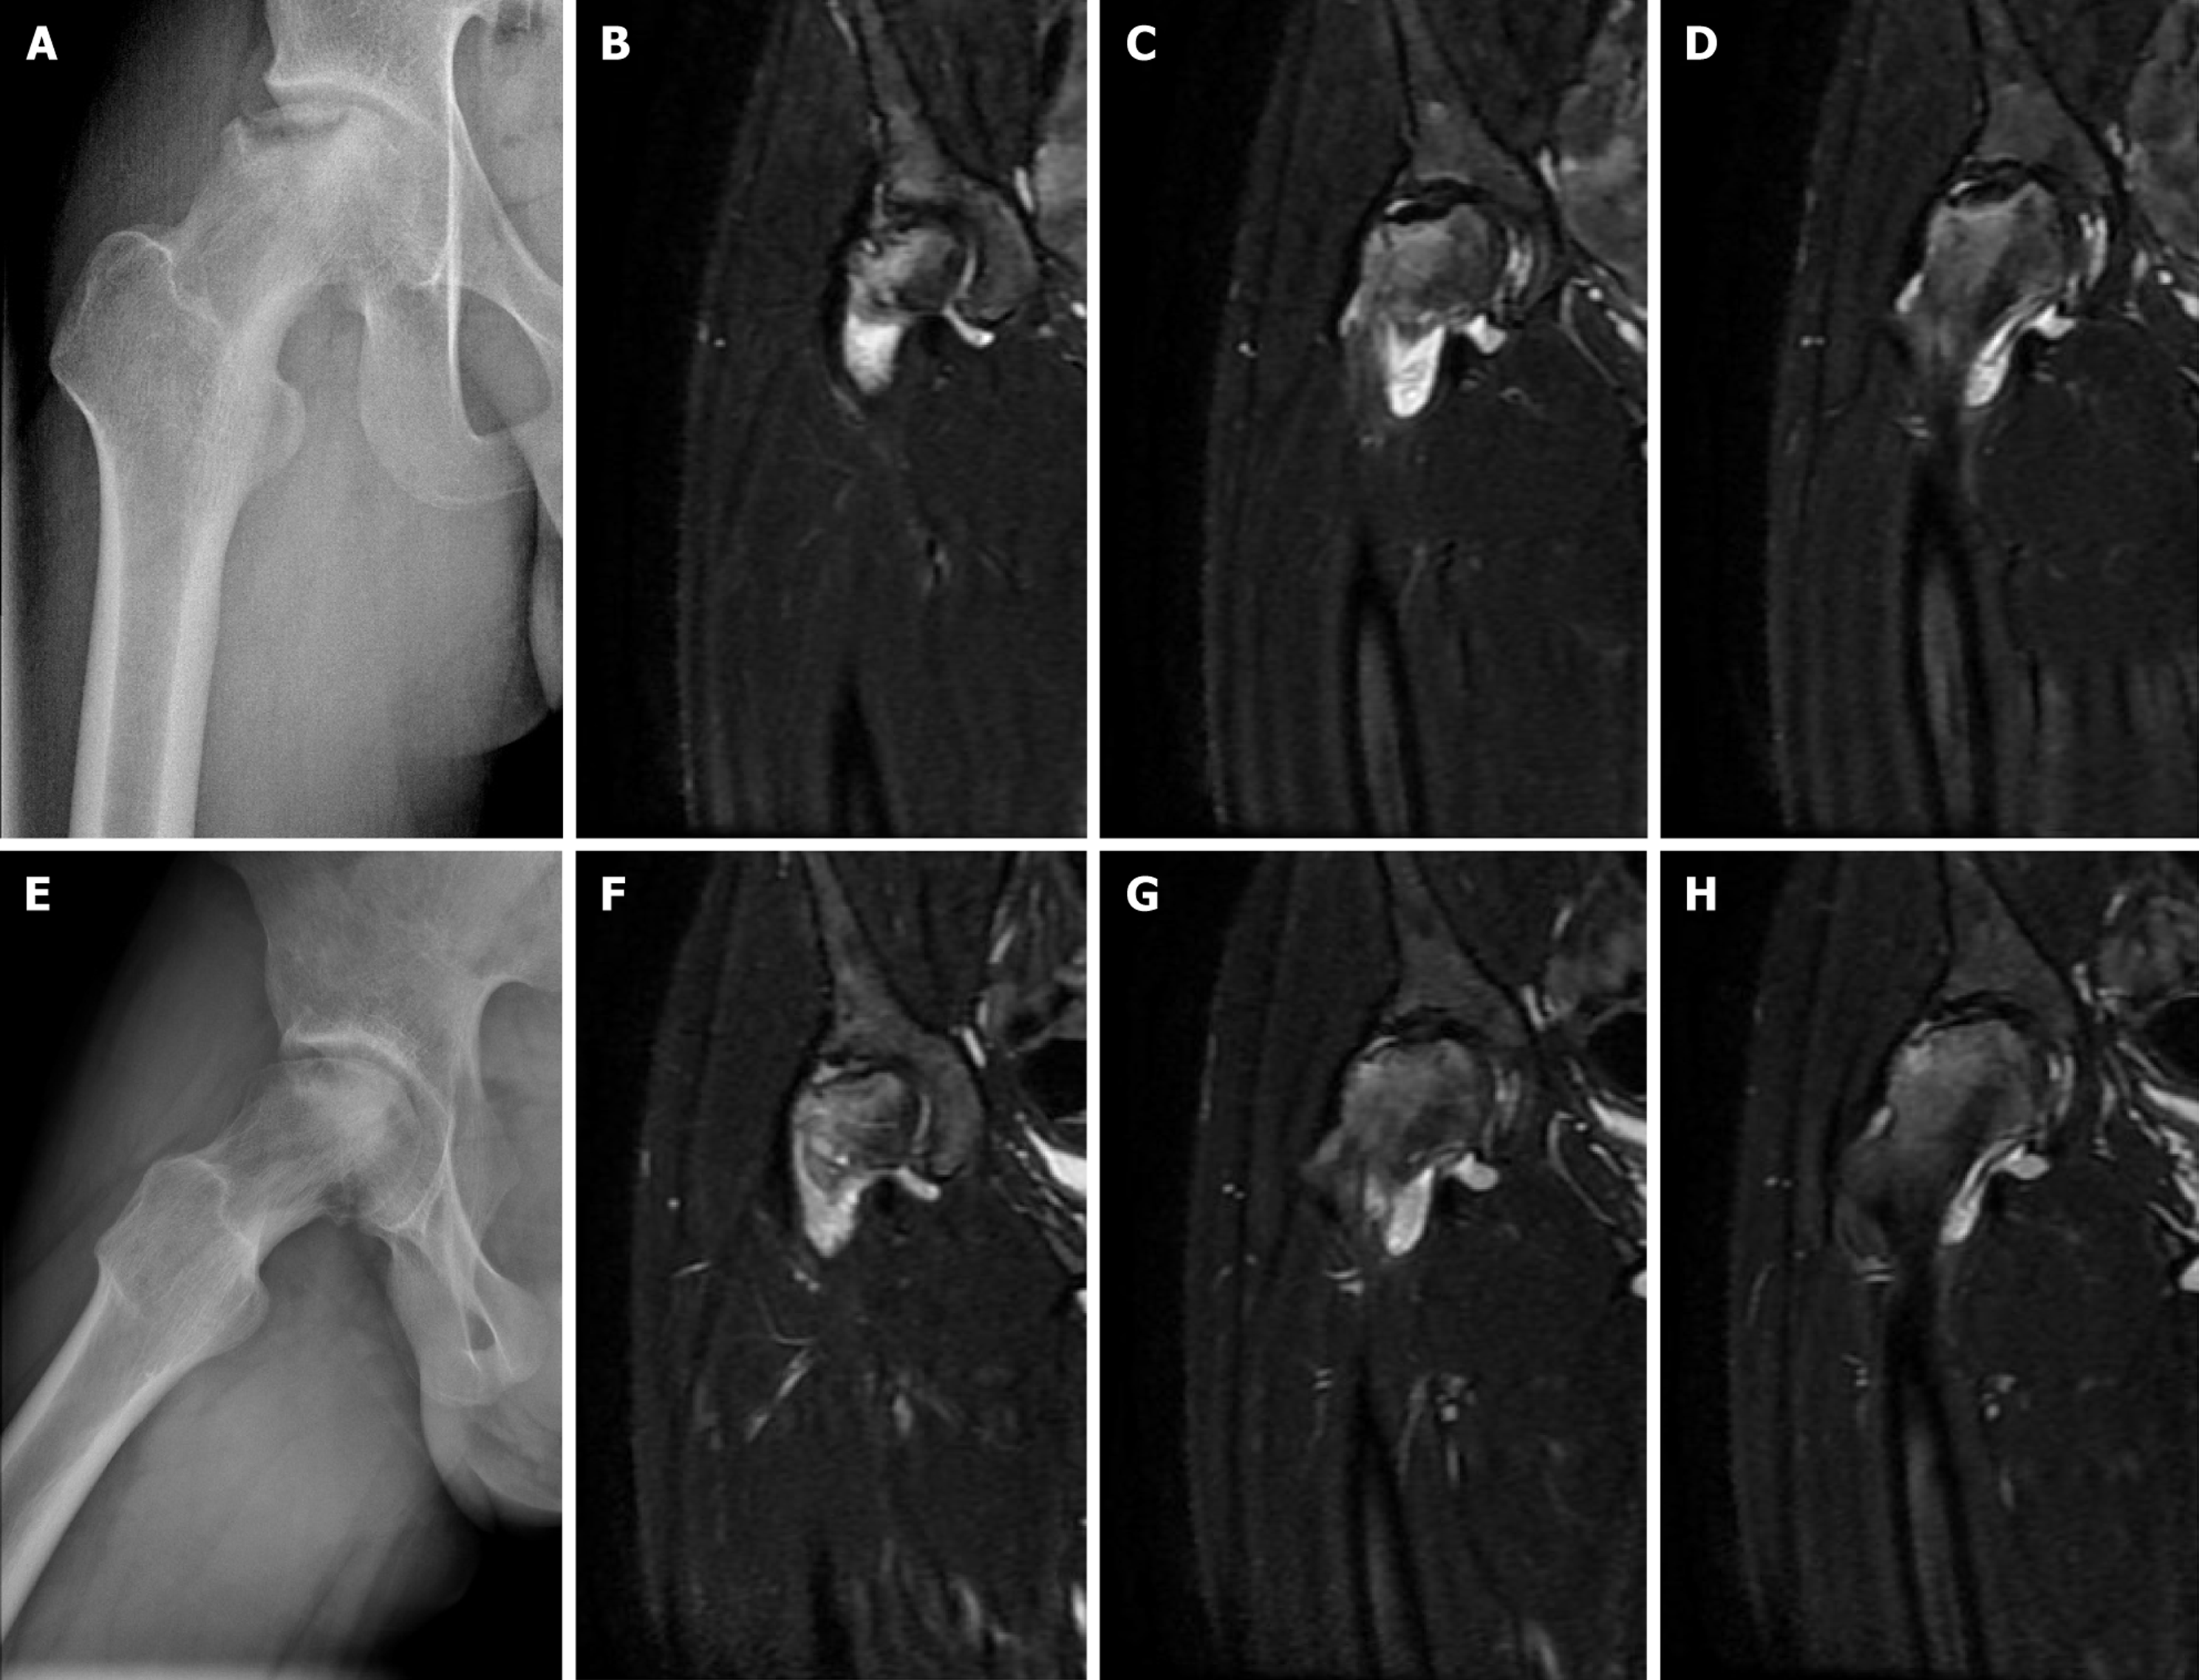
Figure 4 Illustrative longitudinal case of subchondral stress fracture of the femoral head in a 20-year-old recruit.
A-D: Initial Stage II imaging demonstrates a right femoral-head subchondral fracture with marked joint effusion and bone marrow edema; E-H: At 6-month follow-up, the femoral head shows collapse and degenerative change, while joint effusion is markedly reduced. This case illustrates that structural progression may coexist with reduction of selected magnetic resonance imaging fluid-related abnormalities; it is illustrative and does not establish the natural history of the cohort.
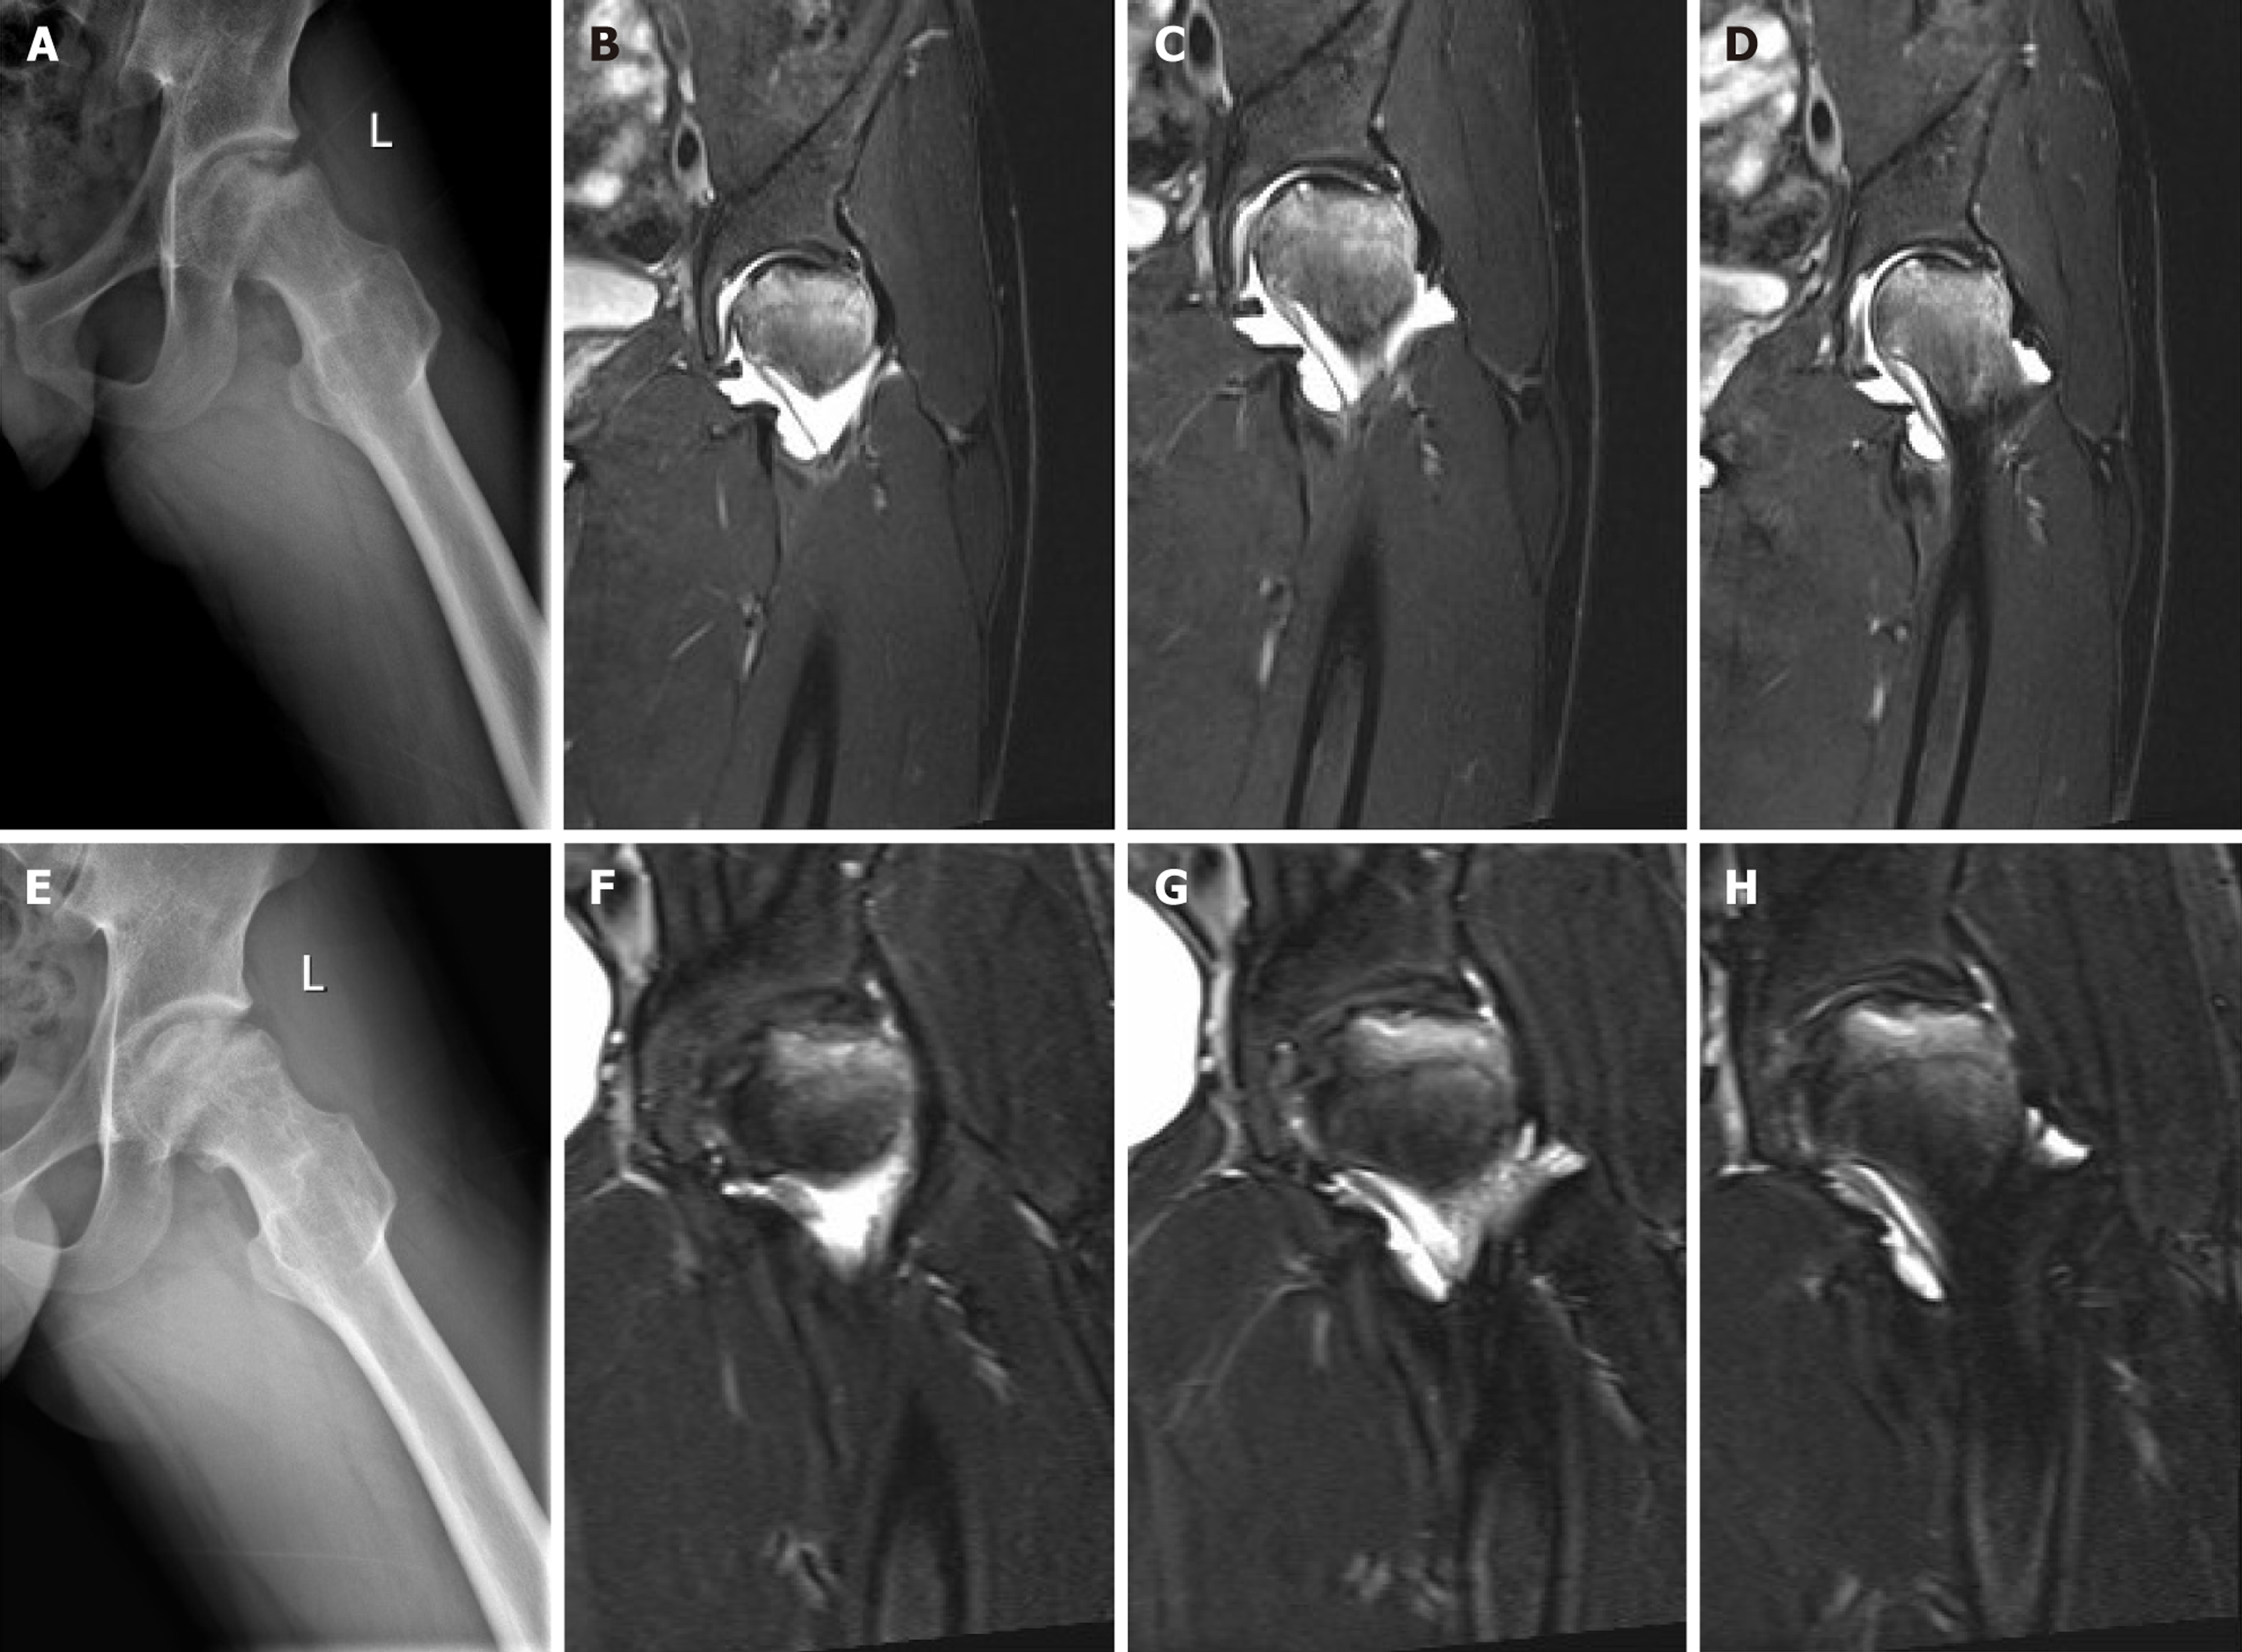
Figure 5 Illustrative longitudinal case of subchondral stress fracture of the femoral head in a 21-year-old recruit.
A-D: Initial Stage II imaging demonstrates a left femoral-head subchondral fracture with marked joint effusion and bone marrow edema; E-H: At 17-month follow-up, the femoral head shows collapse and degenerative change, while joint effusion is markedly reduced. This case illustrates a longer interval between examinations and should not be interpreted as evidence of a uniform disease trajectory.
- Citation: Jiang YF, Wang JB, Zhao B. Subchondral stress fractures of the femoral head associated with military training: Clinical features and analysis. World J Clin Cases 2026; 14(26): 125200
- URL: https://www.wjgnet.com/2307-8960/full/v14/i26/125200.htm
- DOI: https://dx.doi.org/10.12998/wjcc.125200