
















Copyright: ©Author(s) 2026.
World J Clin Cases. Sep 16, 2026; 14(26): 125200
Published online Sep 16, 2026. doi: 10.12998/wjcc.125200
Published online Sep 16, 2026. doi: 10.12998/wjcc.125200
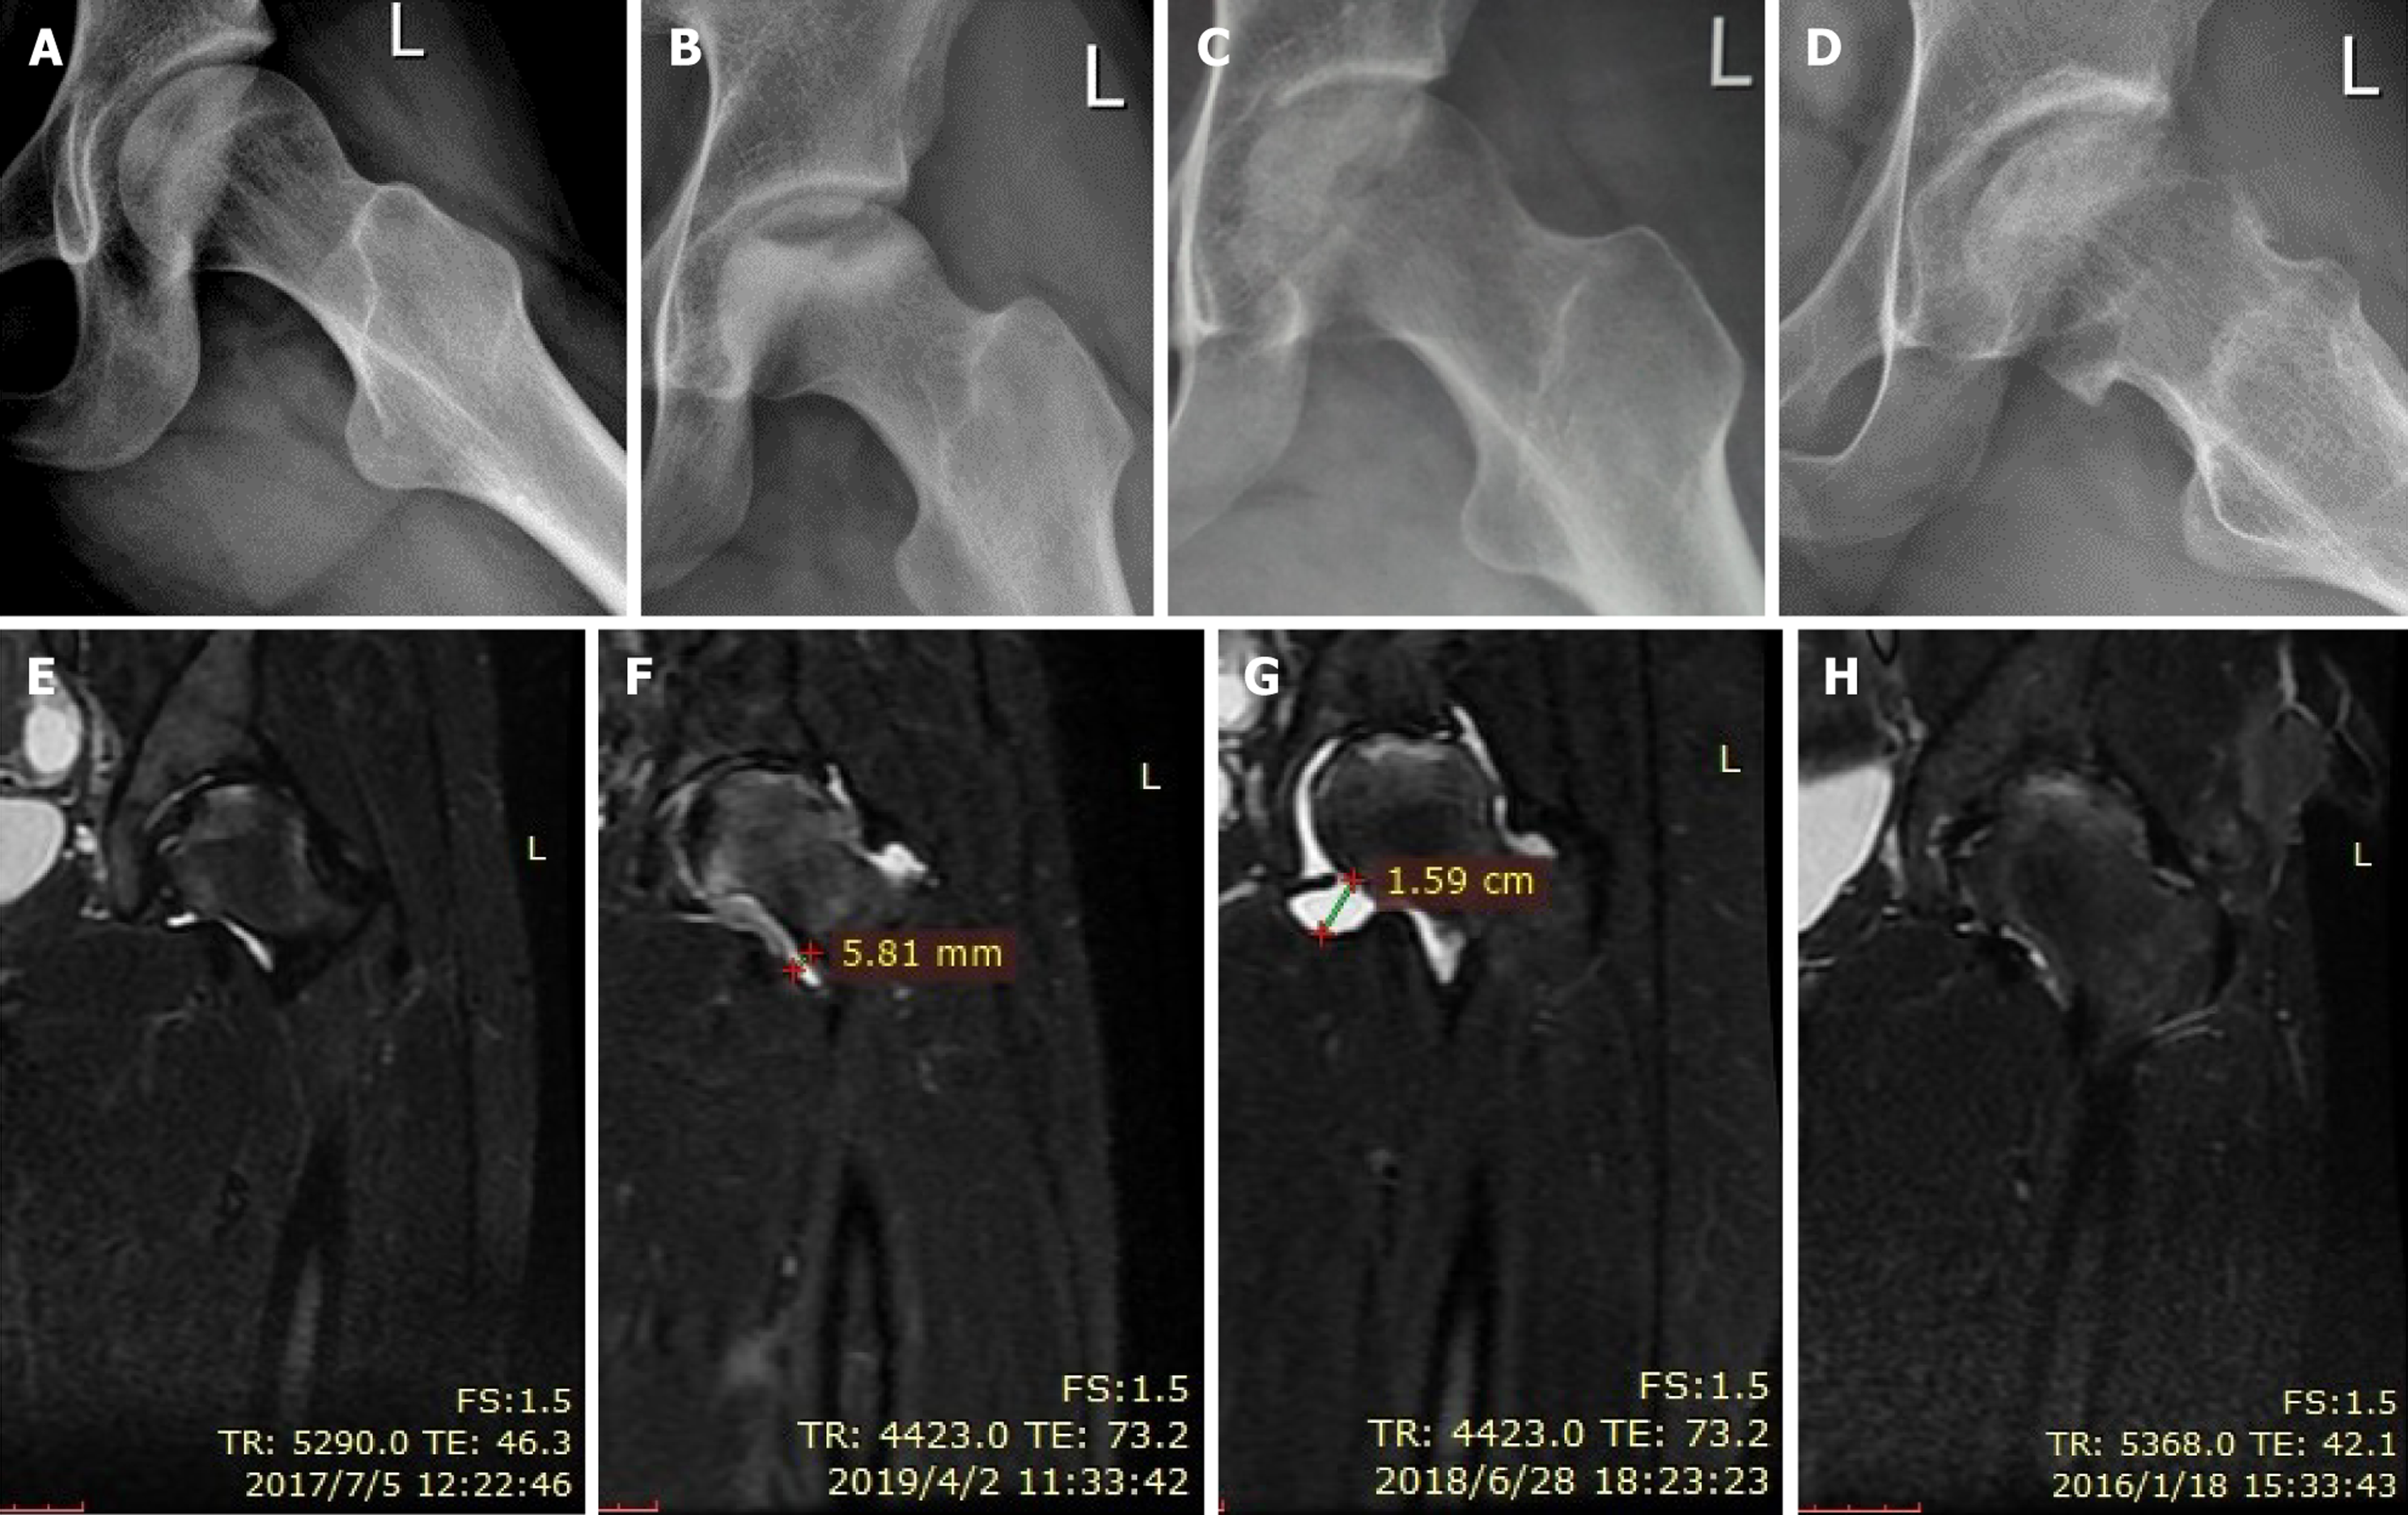
Figure 3 Representative X-ray and magnetic resonance imaging findings of subchondral stress fracture of the femoral head across the predefined imaging stages.
A and E: Stage I: Mild articular-margin depression with localized magnetic resonance imaging bone marrow edema; B and F: Stage I: Mild articular-margin depression with an indistinct fracture line and joint effusion; C and G: Stage II: Obvious articular depression with a clear subchondral fracture line, marked effusion, and extensive bone marrow edema; D and H: Stage III: Femoral-head flattening and advanced degenerative change with less prominent bone marrow edema. The staging framework was adapted from previously described imaging features[6,9].
- Citation: Jiang YF, Wang JB, Zhao B. Subchondral stress fractures of the femoral head associated with military training: Clinical features and analysis. World J Clin Cases 2026; 14(26): 125200
- URL: https://www.wjgnet.com/2307-8960/full/v14/i26/125200.htm
- DOI: https://dx.doi.org/10.12998/wjcc.125200