Copyright
©The Author(s) 2023.
World J Clin Cases. Jan 26, 2023; 11(3): 662-668
Published online Jan 26, 2023. doi: 10.12998/wjcc.v11.i3.662
Published online Jan 26, 2023. doi: 10.12998/wjcc.v11.i3.662
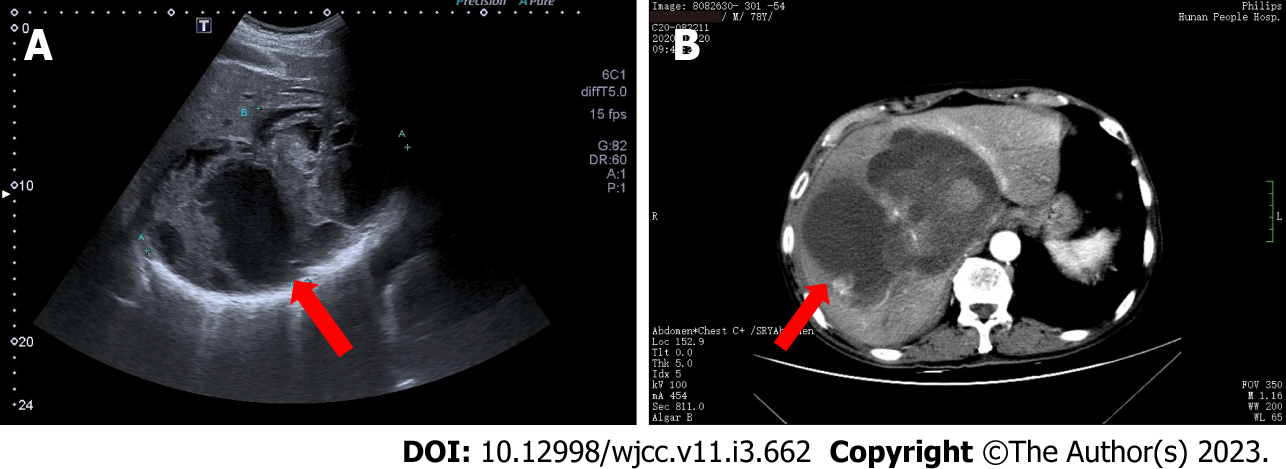
Figure 1 Imaging examination.
A: Liver ultrasound: A giant mixed echogenic mass (as indicated by the red arrow, approximately 18 cm × 11 cm × 12 cm) was observed in the right lobe of the liver with poorly defined boundary, irregular morphology, and uneven internal echoes. The mass was mainly cystic, with multiple solid parts inside. CDFI: A small number of blood flow signals were visible in and around the mixed echogenic mass, and the intrahepatic and right hepatic veins were compressed and offset; B: Enhanced computed tomography (CT) scans: The liver was enlarged and there was a large cystic-solid mass (as indicated by the red arrow, approximately 17 cm × 13 cm × 12 cm) in the right hepatic lobe with irregular morphology, unclear boundary, uneven attenuation, and CT values ranging from 11 to 62 HU. The solid component of the mass was mildly to moderately enhanced. The arterial branches were observed in the mass. The intrahepatic and right hepatic veins and the right anterior branch of the portal vein were occluded.
Figure 2 Pathology of hepatic osteosarcoma.
A: Macroscopic view: A cystic-solid mass was observed in the section of the liver next to the liver capsule. The cystic fluid was already lost, and the grayish-red and grayish-yellow solid area of the tumor was soft with a cut-fish-like surface; B: Pathological microscopy: The short spindle-shaped tumor cells had medium density, an increased nucleus-to-plasma ratio, atypical nuclei, and pathological mitosis. Some tumor cells were converted to osteoblasts. There was osteoid matrix between tumor cells and osteoclast-like giant cells; C: Immunohistochemistry: SATB2 was partially weakly positive.
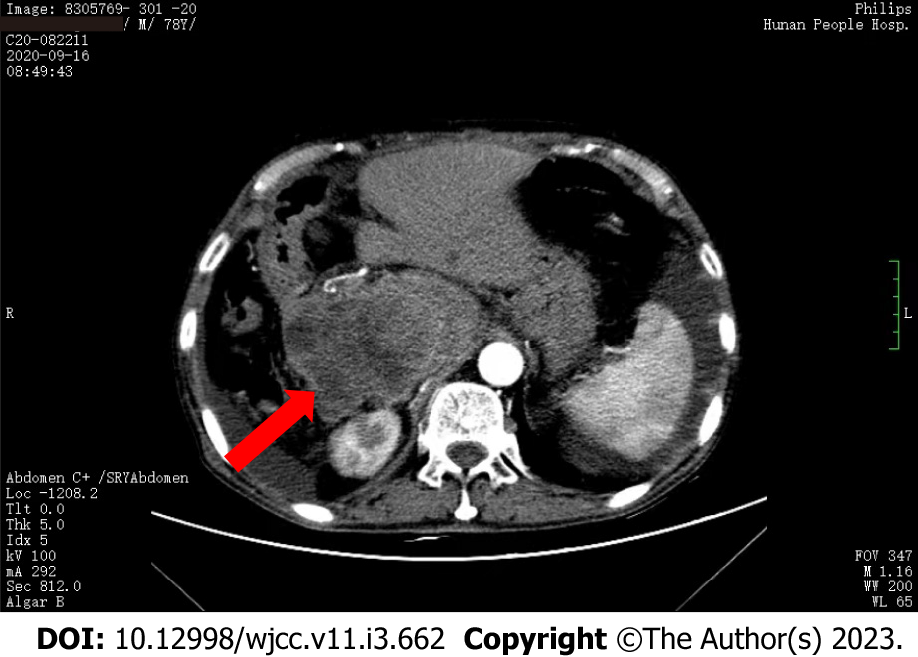
Figure 3 Abdominal contrast-enhanced computed tomography.
The residual liver parenchyma showed a patchy lesion (as indicated by the red arrow, approximately 11 cm × 8 cm × 10 cm) with mixed attenuation and clear boundary near the inferior vena cava. The lesion grew out of the liver contour and had multiply small, patchy hypoattenuating areas. The lesion showed obviously uneven enhancement, while the hypoattenuating areas of the lesion had no obvious enhancement. The hepatic segment of the inferior vena cava was significantly compressed and narrowed.
- Citation: Di QY, Long XD, Ning J, Chen ZH, Mao ZQ. Relapsed primary extraskeletal osteosarcoma of liver: A case report and review of literature. World J Clin Cases 2023; 11(3): 662-668
- URL: https://www.wjgnet.com/2307-8960/full/v11/i3/662.htm
- DOI: https://dx.doi.org/10.12998/wjcc.v11.i3.662


