Copyright
©The Author(s) 2023.
World J Clin Cases. Jan 26, 2023; 11(3): 662-668
Published online Jan 26, 2023. doi: 10.12998/wjcc.v11.i3.662
Published online Jan 26, 2023. doi: 10.12998/wjcc.v11.i3.662
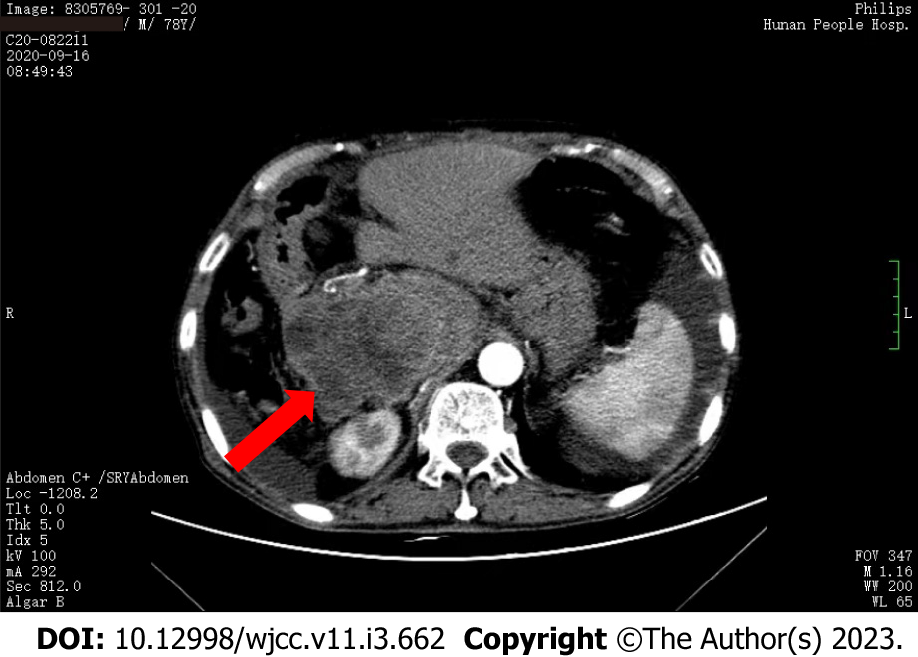
Figure 3 Abdominal contrast-enhanced computed tomography.
The residual liver parenchyma showed a patchy lesion (as indicated by the red arrow, approximately 11 cm × 8 cm × 10 cm) with mixed attenuation and clear boundary near the inferior vena cava. The lesion grew out of the liver contour and had multiply small, patchy hypoattenuating areas. The lesion showed obviously uneven enhancement, while the hypoattenuating areas of the lesion had no obvious enhancement. The hepatic segment of the inferior vena cava was significantly compressed and narrowed.
- Citation: Di QY, Long XD, Ning J, Chen ZH, Mao ZQ. Relapsed primary extraskeletal osteosarcoma of liver: A case report and review of literature. World J Clin Cases 2023; 11(3): 662-668
- URL: https://www.wjgnet.com/2307-8960/full/v11/i3/662.htm
- DOI: https://dx.doi.org/10.12998/wjcc.v11.i3.662


